九州大学学術情報リポジトリ
Kyushu University Institutional Repository
土地利用ゾーニングによる森林減少の削減効果 : ミャンマー全土を対象とした解析
ケイ, カイン, ルイン
http://hdl.handle.net/2324/4110552
出版情報:Kyushu University, 2020, 博士(農学), 課程博士 バージョン:
権利関係:
A country scale analysis on effectiveness of land-use zoning on reducing
deforestation in Myanmar
Kay Khaing Lwin 2020
Kyushu University
A country scale analysis on effectiveness of land-use zoning on reducing deforestation in Myanmar
By
Kay Khaing Lwin
A dissertation submitted to the Graduate School of Bioresources and
Bioenvironmental Sciences, Kyushu University, Japan, in partial
fulfillment of the requirements for the degree of Doctor of Philosophy
i
Table of contents
Chapter 1. General Introduction ... 1
1.1. Background information ... 1
1.2. Forestry in Myanmar ... 3
1.3. Structure of Dissertation and the objectives ... 6
Chapter 2. Assessing the importance of tree cover threshold for forest cover mapping derived from global forest change in Myanmar ... 8
2.1. Introduction ... 8
2.2. Materials and Methods ... 10
2.2.1. Study Area ... 10
2.2.2. Global Forest Change Dataset ... 12
2.2.3. Methodology ... 12
2.3. Results ... 16
2.3.1. Forest Cover Area Estimation ... 16
2.3.2. Accuracy Assessment ... 18
2.4. Discussion ... 22
2.5. Conclusions ... 25
Appendix I ... 26
Chapter 3. A country-scale analysis revealed effective land-use zoning affecting forest cover changes in Myanmar ... 36
3.1. Introduction ... 36
3.2. Study area ... 36
3.3. Methodology ... 39
3.3.1 Treatment and control variables ... 40
3.3.2 Outcome variables ... 41
3.3.3 Confounding variables ... 42
3.3.4 Analysis ... 42
3.4. Results ... 43
3.4.1 Deforestation from 2006 to 2017... 43
3.4.2. Effectiveness of PFE after PSM ... 44
3.5. Discussion ... 47
ii
3.6. Conclusion ... 50
Appendix II ... 51
Chapter 4. Factors affecting deforestation inside and outside Permanent Forest Estate in Myanmar ... 61
4.1. Introduction ... 61
4.2. Materials and Methods ... 63
4.2.1. Study Area ... 63
4.2.2. Data ... 64
4.2.3 Data analysis ... 66
4.3. Results ... 66
4.3.1. Factors affecting deforestation inside PFE ... 66
4.3.2. Factors affecting deforestation in non-PFE ... 69
4.4. Discussion ... 71
4.5. Conclusion ... 72
Chapter 5. General discussion and conclusion ... 74
5.1. Global Forest Change Dataset (GFCD) ... 74
5.2. Effectiveness of Permanent Forest Estate ... 75
5.3. Factors affecting deforestation ... 77
5.4. Conclusion ... 77
References ... 79
iii Lists of Tables
Table 2.1. Number of sample points for the five ecological zones ... 13
Table 3.1. Number of treated and control forest pixels in matching ... 43
Table 3.2. Deforestation from 2006 to 2017 calculated from the GFCD in the study area ... 43
Table 3.3. Average treatment effect on treated (ATT) for deforestation ... 45
Table 4.1. Characteristics of the variables used in GLM ... 65
Table 4.2. Results of regression analysis for deforestation inside PFE ... 67
Table 4.3. The estimated delta Akaike’s information criterion (∆AIC) values for deforestation in PFE ... 68
Table 4.4. Results of regression analysis for deforestation in non-PFE ... 69
Table 4.5.The estimated delta Akaike’s information criterion (∆AIC) values for deforestation in non-PFE ... 70
iv List of Figure
Figure 1.1. Overview location of Permanent Forest Estate (RF, PPF and PA) in Myanmar ... 5 Figure 2.1. (a) Forest Cover Change from 2001-2016, (b) Five ecological zones showing sample points in Myanmar. ... 11 Figure 2.2. Geo-synchronized view of each sample using Collect Earth Software ... 15 Figure 2.3. Percentage of forest and non-forest in 2016 at the national scale and in the five ecological zones: (a) using original percent tree cover and (b) using average tree cover percent of 3 × 3 neighboring pixels. ... 17 Figure 2.4. Overall accuracy (OA), producer's accuracy, and user's accuracy for forest and non-forest at the national scale and in the five ecological zones using original percent tree cover ... 19 Figure 2.5. Overall accuracy (OA), producer's accuracy, and user's accuracy for forest and non-forest areas at the national scale and in the five ecological zones using the average tree cover percent of nine neighboring pixels ... 20 Figure 2.6. Forest cover maps for 2016 developed from the Global Forest Cover Database (GFCD) using original tree cover percent in 2000 [10] and (a) 40% tree cover threshold, or (b) 90% tree cover threshold. ... 21 Figure 2.7. Forest cover maps for 2016 developed from the Global Forest Cover Database (GFCD) using average tree cover percent of neighboring pixels in 2000 [10]
and (a) 40% tree cover threshold, or (b) 90% tree cover threshold. ... 22 Figure 3.1. Location of reserved forest (RF), protected public forest (PPF), protected areas (PAs), forest cover in 2005 and forest loss between 2001 and 2016. Forest cover extent and loss layer were downloaded from Global Forest Change website (Hansen et al. 2013b). ... 39 Figure 3.2. Annual deforestation rate between PFE and non-PFE before and after matching ... 46 Figure 4.1 The location of Permanent Forest Estate with forest cover changes ... 64
v
Acknowledgement
First of all, I would like to express my deep gratitude and sincere thanks to my supervisor, Professor Dr. Nobuya Mizoue, for giving me the great opportunity to study in the Laboratory of Forest Management, Kyushu University, and for his invaluable advice, guidance and encouragement throughout my study period.
My sincere gratitude also goes to Associate Professor Dr. Tetsuji Ota for his kindly guidance, constructive advices and continuous supports in every singly work of my study.
I would like to extend my gratitude to Associate Professor Dr. Takahiro Fujiwara for accepting as an advisor of this dissertation, and for valuable comments and suggestions for my dissertation.
I would like to thanks to Dr. Katsuto Shimizu from Forestry and Forest Products Research Institute (FFPRI), for his comments and suggestions during this research.
I am truly thankful to the Government of Japan for providing the scholarship to study in Kyushu University, and also to Government of Myanmar that gave me the opportunity to pursue my PhD degree. I would like to thank to Forest Department for supporting the required data to complete this study smoothly. Finally, my special thanks also go to all members of Lab of Forest management, Kyushu University for their kindly friendship and sharing the times with me.
vi
Acronyms and Abbreviations
AAC Annual Allowable Cut
AIC Akaike’s Information Criterion
Aster GDEM Advanced spaceborne thermal emission and reflection radiometer (Aster) Global Digital Elevation Map
ATT Average Treatment effect on the Treated DoP Department of Population
FAO Food and Agriculture Organization of the United Nations FLEG-T Forest Law Enforcement, Governance and Trade
FRA Global Forest Resources Assessment GADM Database of Global Administrative Areas GFCD Global Forest Change Dataset
GLM Generalized Linear Model
INDC Intended National Determined Commitment MSS Myanmar Selection System
MIMU Myanmar Information Management Unit NDVI Normalized Different Vegetation Index (NDVI)
OA Overall Accuracy
PA Producer’s Accuracy
PAs Protected Areas
PFE Permanent Forest Estate PPF Protected Public Forest PSM Propensity Score Matching
RF Reserved Forest
SEPAL System for Earth observation, data access, Processing, Analysis for Land monitoring
SMS Subtropical Mountain System TDF Tropical Dry Forest
TMDF Tropical Moist Deciduous System TMS Tropical Mountain System
vii TRF Tropical Rain Forest
UA User’s Accuracy
UNFCCC United Nations Framework Convention on Climate Change VFVLM Law Vacant, Fallow and Virgin Lands Management Law
VIF Variance Inflation Factor
viii
Summary
Forests providing a variety of ecosystem services are a cost-effective way to mitigate climate change. Therefore, it is important to secure the sustainable management of invaluable forest resources. Around the world, designating permanent forest land is a way to keep the forests in long-term. In Myanmar, forests cover about 42.92% of the country’s total areas, and forestry sector plays an essential role in the sustainable development of the country. Permanent Forest Estate (PFE) comprising reserved forest (RF), protected public forest (PPF), and protected areas (PAs) are constituted in Myanmar in order to secure the sustainable forest management. The policy target and the commitment to UNFCCC intended to constitute PFE from 30%
in 2019 up to 40% of total country area by 2030. However, because forest areas are decreasing year by year, it is crucial to understand the performances of PFE on reducing deforestation. Thus, the main objectives of this study are to evaluate the forest conservation effectiveness of the PFE compared with non-PFE areas, and also to understand the impacts of each of land-use zoning in the PFE on reducing deforestation.
Remote sensing based forest cover map is a reliable data source for large area monitoring. In this study, I used Global Forest Change Dataset (GFCD) developed by Hansen et al. (2013). However, the accuracy of GFCD is still debate, and it is important to understand whether global land cover product is reliable or not for the specific country. Therefore, firstly, I investigated the accuracy of GFCD using different tree cover thresholds for five ecological zones in Myanmar because an arbitrary choice of a tree cover threshold may yield an overestimation or underestimation of forest cover. The results showed that different tree cover thresholds were required to achieve the highest overall accuracy for different ecological zones. At national scale, the optimal threshold is 40% to achieve the highest accuracy. Therefore, I used 40% tree cover threshold to define forests in further study using GFCD.
In second study, the conservation effectiveness of PFE on reducing deforestation was investigated comparing with non-PFE. This study applied deforestation data from 2006 to 2017 of GFCD and the analysis was conducted using Matching method to control the location bias. The analysis showed that PFE was effective in reducing deforestation, although deforestation occurred inside PFE.
ix
Within PFE, there are different land-use zonings such as reserved forest (RF), protected public forest (PPF), and protected areas (PAs). No surprisingly, PAs are the most effective land use zoning in reducing deforestation among different land use zoning. Although RF and PPF are production forests and extraction of forest resources including logging was conducted inside them, they have a lower deforestation than non-PFE. Thus, policy to constitute PFE up to 40% of the total country areas by 2030 is a good mechanism to control deforestation in Myanmar.
However, it should be noted that annual deforestation in both PFE and non-PFE is increasing within the study period, and the efforts to mitigate deforestation should be conducted more effectively and efficiently.
The third study investigated the relationship between deforestation and biophysical factors using the Logistic regression analysis. The most important factor in PFE is slope, followed by distance to road and village. In non-PFE, the most influencing factors are distance to PFE, slope and distance to village. The results showed that deforestation in both PFE and non-PFE is more likely to occur in accessible areas and the areas far from government control. In non-PFE, the probability of being deforestation was increased in the areas far from PFE. It might be related with the presence of government officials near PFEs. The findings can support the policy and decision makers in the implementation of interventions to mitigate deforestation.
In conclusion, GFCD is a powerful tool for large-area monitoring of forest cover changes. However, it is crucial to consider the tree cover threshold in defining forest depending on the dominant ecological zones. The analysis using deforestation data from GFCD showed that PFEs as a whole and each land-use zoning of PFEs are effective in reducing deforestation. Thus, the policy measure to constitute PFE is a good mechanism for sustainable forest management. However, further efforts to mitigate the increased rate of deforestation in PFEs should be conducted more effectively and efficiently. While expanding the areas of PFEs to fulfill the targets, the forests remained in accessible areas should be considered as a priority. It is also crucial to implement the efforts to control deforestation in non-PFE because considerable areas of forests would be remained as non-PFE even after expanding the extent of PFEs up to 40%. In this context, actively participation of local community plays a key role in forest conservation and management. In addition, the government
x
should secure land tenure security in non-PFE and it is also important to strengthen forest law enforcement, governance and trade (FLEG-T) and timber legality assurance system.
1
Chapter 1
General Introduction 1.1. Background information
Forests provide a number of services represented by climate regulation and habitat restoration and are the most critical renewable resources to the planet. They play a vital role for income, livelihoods and well-being for human, particularly indigenous people living near the forests and relying on forest products for their subsistence as well (FAO. 2018). However, according to the Global Forest Resources Assessment (FRA, 2015), global forest areas decreased about 3% between 1990 and 2015, while the annual rate of net forest loss was falling twice from 7.3 M ha yr-1 in the 1990s to 3.3 M ha yr-1 between 2010 and 2015 (FAO. 2016a). Tropical regions especially experienced the higher forest cover loss (Hansen et al. 2013a) with annual rate of loss 5.5 M ha yr-1 from 2010 to 2015 (Keenan et al. 2015).
Tropical forests occupy approximately 44% of the total world’s forest areas (Keenan et al. 2015; Apan et al. 2017), covering only about 7% of the earth’s land surface (Estoque et al. 2019). Besides the home to billions of people and wildlife, tropical forests contribute to global carbon balance (Sasaki 2012; Sullivan et al. 2017), becoming both sources and sinks of carbon (Mitchard 2018). However, because of deforestation due to human disturbances such as logging (Ota et al. 2019) and agriculture expansion (Yang et al. 2019), tropical forests are now recognized as the most threatened ecosystems in the earth (Hansen et al. 2013a; FAO. 2016a). Thus, the deforestation of tropical forests has been global concerns (DeFries et al. 2005; Malhi et al. 2014; Heino et al. 2015; Sloan & Sayer 2015), and interventions to combat deforestation in tropical forests became the core of global environmental policy.
Understanding underlying factors of deforestation is a prerequisite to combat deforestation and thus is one of the most critical issues in policy development to curtail deforestation (Hosonuma et al. 2012; Htun et al. 2013; Liu et al. 2015;
Morales-Barquero et al. 2015; Lim et al. 2017; Guerra-Martínez et al. 2019).
According to the summary of proximate causes and underlying factors of deforestation based on 152 subnational case studies (Geist et al. 2002), tropical deforestation is driven by major three causes, which are agriculture expansion, wood extraction and infrastructure development and five driving forces, which are
2
demographic, economic, technological, policy and institutional and cultural factors.
However, factors influencing deforestation vary among nations or regions (e.g. Mon et al. 2012; Vu et al. 2014; Phompila et al. 2017; Lonn et al. 2018), and over time even within a specific study area (Htun et al. 2013). Thus, it is crucial for each country and region to reveal the factor affecting deforestation on their situation.
Besides, it is important to evaluate the effectiveness of conservation approaches for reducing tropical forests. Land-use zoning, which segments the landscape into units with different legal status, is one of the traditional approaches to reduce deforestation. A variety of studies evaluated the performances of land-use zoning, e.g. protected areas (Andam et al. 2008; Andam et al. 2013; Brun et al. 2015;
Cuenca et al. 2016; Gray et al. 2016; Miranda et al. 2016; Oldekop et al. 2016;
Bowker et al. 2017; Apan et al. 2017; Maharaj et al. 2019) and community forests (Ellis & Porter-Bolland 2008; Porter-Bolland et al. 2012; Lonn et al. 2019; Oldekop et al. 2019)) around the world. However, the results showing the conservation performances vary across nations or landscape, and land-use policies, and thus the effectiveness of land-use zoning should be evaluated in each nation and region.
Permanent Forest Estate (PFE) is designated as permanent land use to keep the forests in long-term (FAO. 2016a). Within PFE, forests are managed by categorizing into different land-use zonings which are allocated for timber production, local supply, nature conservation, recreation, and conservation of wildlife and their habitats (Bruggeman et al. 2015) by assigning different legal status. According to FRA 2015, out of 2.2 billion ha of proposed permanent forest land, about 1.5 billion ha have been designated as PFE and more than half of PFE are found in the tropical regions (FAO.
2016a). While there are considerable portions of PFE, the study evaluating effectiveness of the PFE and the land-use zonings within PFE are few. As a limited study, Bruggeman et al. (2015) evaluated the effectiveness of the PFE and land-use zoning in Cameroon. However, the study only focused on a specific region in Cameroon, which is in African regions. It is still unclear whether PFE effectively reduces deforestation at a national scale in Southeast Asia.
For evaluating conservation performances and analyzing driving factors on deforestation of land-use policy in a large area, a fundamental map for forest cover changes over time is essential (Lim et al. 2017). Remote sensing based forest cover map is reliable data source (Hansen et al. 2000) and one of the powerful tools to study
3
over large areas (e.g. entire country). Recently, several freely available global forest cover maps are developed by using various data sources. However, because global maps are typically not reliable at national or local scales (Sannier et al. 2016), validation of the suitability of global maps for specific regions is important.
1.2. Forestry in Myanmar
Myanmar is geographically located between latitudes 9° 28´ and 28° 29´ N and longitudes 92° 10´ and 101° 10´ E. Owing to long length of land, stretching for 9,236 km from north to south and 2,051 km from east to west, and various topography, the country has several climate zones ranging from temperate region to dry zone. Due to various climate zones, Myanmar is endowed with natural forests comprising with various special composition and stand structure (Htun et al. 2012) and has high forest cover in Southeast Asia (Yang et al. 2019). There are six major forest types in Myanmar, namely mangrove forest (1.12%), tropical evergreen forest (17.30%), mixed deciduous forest (38.20%), dry forest (10.00%), deciduous dipterocarp forest (4.26%), hill and temperate evergreen forest (26.92%), and scrub and grass land (2.20%) (Forest Department. 2020).
In Myanmar, all forests are state-owned forests and classified into Permanent Forest Estate (PFE) and unclassified forests. The PFE comprises with reserved forest (RF), protected public forest (PPF) and protected areas (PAs) in order to ensure sustainable forest management, to restore ecological balance, conserve biodiversity and environment and to strengthen management of wild flora and fauna. Since monarchial times, the first forest policy was started in 18th century with the legislation that the teak tree was royal and no-one was allowed to cut it without permission (Linn
& Liang 2015). After the first Anglo-burmese war at 1824, the British conquered Tenasserim region (nowadays Tanintharyi) and teak forests in Tenasserim were managed under a system of laissez-faire forestry (1824-1855) (Bryant 1997). After the second Anglo-burmese war at 1852, the British occupied lower Myanmar, and Dr.
Brandis was appointed to manage the forests. In 1856, Dr. Brandis founded the Forest department in order to manage the forest scientifically. The scientific forest management had been introduced in Pegu (nowadays Bago) teak forests. Because of the extensive depletion of teak forests in Tenasserim, a new approach had been created with the constitution of reserved forests leading to timber production in long-
4
term (Bryant 1993). Although several reserved forests were selected in the 1860s, the very first reserved forest was legally created in May 1870. Along with the extension of Forest Department, an increase in the creation of reserved forests has been occurred, and by 1900, reserved forest covered about 4.44 Mha (Bryant 1993). The Burma forest act was enacted in 1902 and updated in 1992. In 1883, the elephant preservation act was enforced and the wildlife protection has been implemented within the boundary of reserved forests and some restricted areas. In 1936, the Burma wildlife protection act was enacted and the first wildlife sanctuary was established in 1918.
The state timber commission recommended to implement the proposal in 1944 that
“the forest estate shall be administered not only for the benefit of the population of today but also for posterity: hence suitable areas shall be reserved on a permanent basis, brought under proper protection and management, and developed with the view to securing sustained annual yields”.
According to Myanmar Forest Policy in 1995, one of the policy measures for protection and management is to stipulate 35% of the total country’s areas as PFE such as RF, PPF and PAs. The target of PFE is extended to 40% according 30-year National Forestry Master Plan (2001–02 to 2030–31) and the extended target is also one of the commitment of Intended National Determined Commitment of Myanmar (INDC) which was submitted to UNFCCC (The Government of Myanmar 2015). As of December 2019, 31.34% of total country area has been declared as PFE (Forest Department. 2020). The unclassified forests which are located outside of PFE could be managed according to Forest Law, but land covered with unclassified forests is defined as “Virgin Land” according to The Vacant, Fallow and Virgin Land Management Law (2012) under the management of Ministry of Agriculture, Livestock and Irrigation. Therefore, there is overlapping management between government sectors.
5
Figure 1.1. Overview location of Permanent Forest Estate (RF, PPF and PA) in Myanmar In Myanmar, forest cover decreased drastically from about 59% of the total land area of the country in 1990 to about 43% in 2015 due to various factors.
According to FRA (2015), Myanmar stands in third place among ten highest deforested countries over the world during 2010-2015 with annual net deforestation rate of 1.7%. Forest cover change in Myanmar has been analyzed by various studies (Leimgruber et al. 2005; Songer et al. 2009; Htun et al. 2010; Mon et al. 2012; Liu et al. 2015; Wang & Myint 2016; Shimizu et al. 2017; Reddy et al. 2019; Yang et al.
2019). In addition, various studies identifying the factors influencing deforestation in specific regions of interest were also conducted in Bago Yoma (Mon et al. 2012), Paung laung watershed (Mon et al. 2009), and Popa mountain national park (Htun et al. 2013). Regarding with evaluating the effectiveness on forest conservation and
6
social sectors, some studies have been conducted in a specific land-use zoning of PFE (Allendorf et al. 2006; Htun et al. 2010; Allendorf et al. 2012; Htun et al. 2012;
Allendorf & Allendorf 2013; Biswas et al. 2015; Allendorf et al. 2017). However, no study evaluated the conservation performances of PFE at national level to understand the effectiveness of conservation policy, and factors influencing deforestation inside PFE and unclassified forests at national scale as well.
1.3. The objectives and structure of dissertation
The main objectives of this study are to evaluate the forest conservation effectiveness of the PFE compared with non-PFE areas, and also to understand the impacts of each of land-use zoning of PFE on reducing deforestation.
The dissertation is organized with five chapters and chapter 1 represents general introduction including background of the study, forestry in Myanmar and research objectives.
Chapter 2 evaluated the importance of tree cover thresholds in defining forest and non-forests using remote sensing based global forest cover maps. The study was conducted at national scale and analysis was focused on different ecological zones of Myanmar in order to identify the effect of changing tree cover thresholds on the accuracy of forest cover maps from the Global Forest Change Dataset (GFCD) and to examine the influence of different ecological zones on the optimal threshold of tree cover to achieve the highest overall accuracy.
Chapter 3 studied about the effectiveness of PFE in reducing deforestation.
This study was conducted at national scale using deforestation data from GFCD. The conservation performance was evaluated using matching method to control the bias.
The objectives of this chapter are to evaluate forest conservation effectiveness of PFE compared with non-PFE areas which are also known as unclassified forests, and to evaluate conservation performances of each land-use zoning of PFE by comparing with non-PFE.
Chapter 4 studied the factors influencing and driving deforestation within PFE and non-PFE using Generalized linear model. The objective of this chapter is to investigate the relationship between driving factors and deforestation and examine the most influencing factor.
7
Chapter 5 included general discussions and conclusion to cover all the research works.
8
Chapter 2
Assessing the importance of tree cover threshold for forest cover mapping derived from Global Forest Cover in Myanmar 2.1. Introduction
Deforestation in tropical forests has been of concern for decades (Keenan et al.
2015). Because tropical deforestation negatively impacts the global carbon budget (Houghton 2012; Baccini et al. 2017) and biodiversity (Brooks et al. 2002; Hughes 2017; Giam 2017), forest policy and management need to reverse forest loss. Forest cover maps, which identify forest and non-forest areas, are essential baseline information for tracking forest cover changes; therefore, comprehensive forest cover maps are necessary for policy and management decisions. Remote sensing is one of the tools used to provide complete forest cover maps over extensive land areas, such as entire countries.
Satellite remote sensing is a commonly used to map land cover in a systematic and cost-effective fashion over a variety of spatial extents (Wulder et al. 2008; Gómez et al. 2016). However, creating a forest cover map from raw remote sensing data can be a barrier for users (Turner et al. 2015), because it requires expertise in remote sensing and professional software. An alternative solution is to use existing global datasets for forest cover. Currently, there are several freely available land cover map products, which have been developed from various data sources.
The Global Forest Change Dataset (GFCD) developed by Hansen et al. (Hansen et al. 2013a) is one of these freely available global datasets. This is a Landsat-derived dataset with 30-m resolution and includes three layers, which are: (1) percent tree cover in 2000 (0%–100%) (hereafter tree cover), (2) annual forest cover loss (2000–
2016), and (3) forest cover gain (2000–2016). The GFCD is widely used all over the world (e.g., Santika et al. 2017; Johanne. Pelletier et al. 2019; Oldekop et al. 2019).
One of the barriers to using the GFCD, however, is that the data do not provide information on forest and non-forest areas. Thus, users must apply knowledge of forest cover from other sources. One practical option is to create a forest cover map from the percent tree cover layer of the GFCD (Davis et al. 2015; Sannier et al. 2016;
Peter. Potapov et al. 2017; Lonn et al. 2018; Lonn et al. 2019). In this option, users
9
distinguish forest and non-forest areas by applying a threshold of tree cover. Because the definition of the threshold directly affects the areas of forest and non-forest, setting an appropriate threshold is very important.
Previous studies have used different thresholds while using the GFCD. For example, Davis et al. (Davis et al. 2015) and Lonn et al. (Lonn et al. 2019) used a 30% threshold to distinguish forests and non-forests in Cambodia, but Yang et al.
(Yang et al. 2017) used a 10% threshold in China. Lui et al. (Lui & Coomes 2015) used a 50% tree cover threshold in accordance with the definition of forest cover gain in the GFCD, for rainforest cover change analysis of Gola National Park (Sierra Leone, West Africa). A case study in Brazil applied different thresholds to create forest cover maps from the GFCD and suggested that a 95% threshold yielded the highest overall accuracy (McRoberts et al. 2016). The various thresholds defined by previous studies imply that the appropriate threshold of tree cover depends on the region of interest. Thus, it is necessary to pay extra attention to the tree cover threshold to define forest areas, when the GFCD is used for monitoring large areas.
To the best of my knowledge, no study has yet evaluated the effect of the tree cover threshold on the accuracy of forest cover detection based on the GFCD for different regions. Although some studies evaluated the accuracy of the GFCD, they have mainly focused on the accuracy of the forest loss or gain layer (Burivalova et al. 2015;
Linke et al. 2017; Arjasakusuma et al. 2018). A few studies (Sannier et al. 2016;
McRoberts et al. 2016) have investigated the effect of the tree cover threshold on the accuracy of the forest cover map derived from the GFCD. However, they did not consider differences in the effect of tree cover thresholds among different regions.
Because it is necessary to understand the accuracies of the GFCD within different forest types and various canopy densities to be appropriate for specific local contexts (Mitchard et al. 2015), here, I investigated the effect of the tree cover thresholds on the accuracy of forest cover detection from the GFCD over different regions.
The Republic of the Union of Myanmar (hereafter Myanmar) used to be one of the most forested countries in mainland Southeast Asia. However, the forest area in Myanmar has decreased rapidly (FAO. 2016a). Monitoring forest cover changes in Myanmar is crucial for action against such deforestation. The GFCD may be an important option for monitoring, despite Myanmar being a long north–south orientated country. The elevation ranges from sea level to more than 5000 m. In some
10
places the annual rainfall reaches 6000 mm but, in other parts of the country, annual rainfall is below 500 mm. Given these diverse topographic and climatic conditions, Myanmar is divided into five ecological zones. Because of these different ecological zones, I may have to use different zonal thresholds to map forest cover using the GFCD.
In this study, I investigated the accuracy of forest cover maps created from the GFCD using different tree cover thresholds across the different ecological zones based on country-scale evaluation of Myanmar. The specific objectives of the study were: (1) to identify the effect of changing tree cover threshold on the accuracy of forest cover maps from the GFCD, and (2) to examine the influence of different ecological zones on the optimal threshold of tree cover to achieve the highest overall accuracy. I evaluated the importance of the tree cover threshold when using the GFCD for monitoring large areas, such as in Myanmar.
2.2. Materials and Methods
2.2.1. Study Area
Myanmar is located in Southeast Asia between latitudes 9°32′–28°31′N and longitude 92°10′101°11′E. It is the second largest country in Southeast Asia, with a total area of approximately 0.67 million km2. According to the Global Forest Resources Assessment (FRA) 2015 (FAO. 2014), forests covered approximately 42.92% of the total land area in Myanmar.
Based on the Global Ecological Zones provided by the Food and Agricultural Organization of the United Nations (FAO) (FAO. 2012), Myanmar is divided into five ecological zones: the subtropical mountain system, tropical dry forest, tropical moist deciduous forest, tropical mountain system, and tropical rainforest (Figure 2.1). An ecological zone is defined as a broad area that has relatively homogeneous natural vegetation formations. The boundaries of ecological zones approximately correspond to the Köppen–Trewartha climatic types, based on temperature and rainfall. Mountain systems are classified as separate ecological zones, characterized by a high variation in both vegetation formations and climatic conditions (Simons 2001).
11
Figure 2.1. (a) Forest Cover Change from 2001-2016, (b) Five ecological zones showing sample points in Myanmar.
The country border data were downloaded from the Database of Global Administrative Areas (GADM) (GADM.), Forest Cover Change Data were from the Global Forest Change website (Hansen et al. 2013b) and the ecological zones were from the Food and Agricultural Organization website (Global Ecological Zone.).
Detailed explanations of the climate, physiography, and vegetation for each ecological zone in the Asian domain are provided in the FAO report by Simons (Simons 2001). Briefly, each ecological zone has different vegetation features. For example, the natural vegetation of the tropical rainforest is mainly dense moist evergreen forest, although semi-deciduous and moist deciduous forests are also distributed in the drier parts of this zone (Simons 2001). In contrast, the natural vegetation of tropical moist deciduous forests comprises mainly deciduous and semi- deciduous species, where teak (Tectona grandis) is found (Simons 2001). In Myanmar, bamboo (Dendrocalamus strictus) is also a common species in tropical moist deciduous forests (Simons 2001). The vegetation of tropical dry forests is complex but dry deciduous dipterocarp forests and mixed deciduous woodlands are common in the tropical dry forests of the Southeast Asian region, including Myanmar
12
(Simons 2001). The vegetation of the subtropical mountain system and tropical mountain system varies by region.
2.2.2. Global Forest Change Dataset
The GFCD version 1.4, which included: (i) percent tree cover in 2000, (ii) annual loss layer, and (iii) a gain layer, was downloaded from the website (Hansen et al.
2013b). All datasets were first clipped using the Myanmar boundary. Then, I defined forest area in 2000 using a threshold of percent tree cover. Here, I tested nine thresholds from 10% to 90%, with intervals every 10%, and generated nine forest cover maps for 2000. For each forest in the 2000 layer, I created a forest cover map for 2016 by combining the annual loss layer (2001–2016) and gain layer (2001–
2016). I defined a pixel as forest in 2016 according to two criteria: (1) when a given pixel was forest in 2000 and was not classified as forest loss between 2001 and 2016, and (2) when a given pixel was classified as forest gain. The pixels satisfying either one of these two criteria were defined as forest. In contrast, I defined the pixels that did not satisfy the above criteria as non-forest in 2016. I assessed the accuracy of these nine different 2016 forest cover maps. When forest cover maps are created using a threshold, the information from neighboring pixels may improve their accuracy.
Thus, I tested two different options for percent tree cover in 2000. In the first case, the original percent tree cover in 2000 was used. In the second case, the average value of tree cover in 2000 of a central pixel and its neighborhood was used. In this study, I used the average tree cover of 3 x 3 neighboring pixels.
2.2.3. Methodology
2.2.3.1. Determination of Sample Points
To determine the total number of sample points for the whole study area, the following equations (Olofsson et al. 2014) were used:
n ≈ (∑ WiSi S(ô) )
2
(1)
Si = √Ui(1 − Ui) (2)
13
where n is the calculated number of total samples, S(ô) is the standard error of the overall accuracy that I would like to achieve, Wi is the mapped proportion of the area of class i, Si is the standard deviation of class i, and Ui is the expected user accuracy of class i. In this study, there were two classes, forest and non-forest. I assumed the mapped proportions of the areas of the forest class and non-forest class were 0.4 and 0.6, respectively. I also set the Ui of both forest and non-forest classes as 0.8. A total of 1600 sample points were used.
Table 2.1. Number of sample points for the five ecological zones
Ecological Zones Area (1000 ha) Sample Points
Subtropical Mountain System 412 100
Tropical Dry Forest 5998 137
Tropical Moist Deciduous Forest 23,080 527
Tropical Mountain System 14,550 334
Tropical Rainforest 22,670 502
Total 66,710 1600
I applied stratified random sampling to allocate the samples to each ecological zone. To calculate the number of allocated samples, I used the Stratified Area Estimator-Design tool on the SEPAL platform (Sepal Platform.). The SEPAL platform is part of the Open Foris suite of tools (FAO. 2016b); it semi-automatically determines the number of samples according to the area of each stratum (an ecological zone) in my case, the total sample size, and the minimum sample size.
Because the minimum sample size of each stratum should be at least 20–100 samples (FAO. 2016b), I assigned at least 100 samples to each ecological zone. The respective number of sample points calculated by the tool for the five ecological zones are shown in Table 2.1; sample points were randomly distributed in each ecological zone.
14 2.2.3.2. Reference Data Collection
There are various approaches to collecting reference data, such as field survey data (Z. Yang et al. 2017; Venkatappa et al. 2019), Google Earth (Potere 2008;
Hansen et al. 2013a; Brun et al. 2015; Lui & Coomes 2015; Tilahun & Teferie 2015;
Rwanga & Ndambuki 2017; Y. Yang et al. 2017; Dhar et al. 2019; Yang et al. 2019), and very high resolution satellite images, like Aerial photo, GeoEye, and QuickBird (Mahdianpari et al. 2019; Poortinga et al. 2019). In this study, Collect Earth, which is a free open-source software designed to facilitate data collection for land cover monitoring (Bey et al. 2015), was used to interpret forest and non-forest from the samples for the ground situation (Figure 2.2). This software enabled the users to interpret the land cover of the sampled area with plot layout design through imageries with varying spatial and temporal resolutions within Google Earth, Bing Maps, and Google Earth Engine (Bey et al. 2016); it geo-synchronized the views of the ground situation at each sample within different imageries (Figure 2.2 a–c). Previous studies used Collect Earth for various purposes, including ground truth data collection for accuracy assessment, land cover change analysis, and vegetation survey, for analyses at global scale (Bastin et al. 2017) and specific regions of interest (Asrat et al. 2018;
Leite et al. 2018; Messina et al. 2018; Muro et al. 2018; Vega Isuhuaylas et al. 2018;
Alban et al. 2019; Mitri et al. 2019; Johanne Pelletier et al. 2019).
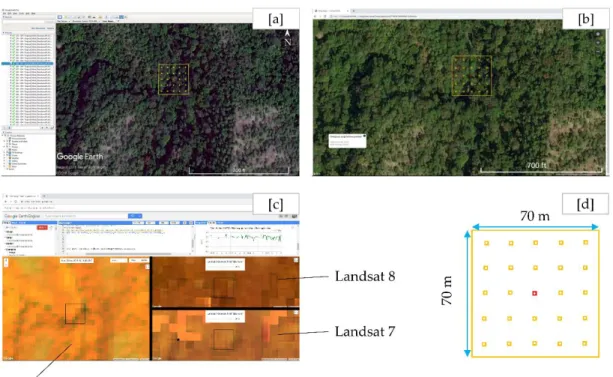
At the time of reference data collection, I defined forest as an area that was larger than 0.49 ha with tree cover of more than 10%, consistent with the forest definition of the FAO (MacDicken 2012). According to this definition, I set each sample from Section 2.2.3.1 as a 0.49 ha plot (70 m × 70 m) having a systematic grid of 5 × 5 points (i.e., 25 points), as shown in Figure 2.2 d. Within each plot, I identified forest or non-forest areas by counting the number of points covered with trees, based on visualization of the ground situation through geo-synchronized views within Google Earth, Bing Maps, and Google Earth Engine. If the number of points with tree crowns in each plot was equal to or more than three (i.e., > 3/25 = 0.12), I classified the sample as forest. Otherwise, I classified the sample as non-forest.
15
Figure 2.2. Geo-synchronized view of each sample using Collect Earth Software (a) Google Earth image, (b) Bing Map image, (c) Google Earth Engine showing normalized difference vegetation index (NDVI) values and different satellite images,
such as Sentinel-2, Landsat 7, Landsat 8, (d) schematic of a 0.49 ha plot with 25 points. The red point in the center of the plot represents the original sample described
in Section 2.2.3.1.
2.2.3.3. Accuracy Assessment
The accuracies for all nine forest cover maps were assessed using overall accuracy (OA), producer’s accuracy (PA) and user’s accuracy (UA) derived from a confusion matrix between each forest cover map and reference data from Collect Earth. First, I evaluated the effect of the tree cover threshold on the accuracy of each ecological zone using the forest cover maps derived from the nine thresholds from 10% to 90%. Then, the effect of the tree cover threshold at a national scale was evaluated. For the national-scale evaluation, I calculated the national-scale accuracy (1) when the tree cover threshold was uniquely determined over the whole area of the country, and (2) when the tree cover threshold was determined by the optimal thresholds of tree cover from the ecological zones. For the former case, I calculated OA, PA and UA at a national scale from all nine forest cover maps as in the
16
evaluation of each ecological zone. For the latter case, I used the tree cover threshold that received the highest OA for each ecological zone. McNemar’s test, which is a non-parametric test to assess the performance of a classification (Foody 2004), was applied to evaluate national scale and ecological zone accuracies.
2.3. Results
2.3.1. Forest Cover Area Estimation
Figures 2.3 a,b show the relationship between the ratio of forest to non-forest and the tree cover threshold. The forest and non-forest areas derived from the two different cases of percent tree cover were similar. Forest area gradually decreased with an increase of the tree cover threshold. However, the gradients depended on ecological zones. Tropical dry forest showed the lowest forest cover and forest areas decreased in a linear fashion. Tropical moist deciduous forest, tropical mountain system, and tropical rainforest showed a similar trend. The forests of these three ecological zones occupied an area of approximately 75% for both cases of percent tree cover, when the tree cover threshold was 10%; it remained at more than 50%, until the tree cover threshold reached 60%. Then, the forest cover ratio decreased sharply, as the tree cover threshold rose from 60% to 90%. The forest cover in the subtropical mountain system was less than 50% in the first case and approximately 52% in the other case, when the tree cover threshold was 10%; it gradually decreased as the threshold increased.
At the national scale, when the tree cover threshold was uniquely determined over the whole country, the trend was similar to that for the tropical moist deciduous forest, tropical mountain system and tropical rainforest in both percent tree cover cases. The forest cover ratio decreased proportionally, as the tree cover threshold rose from 10%
to 50%.
17
Figure 2.3. Cont.
Figure 2.3. Percentage of forest and non-forest in 2016 at the national scale and in the five ecological zones: (a) using original percent tree cover and (b) using average tree cover percent of 3 × 3 neighboring pixels.
18 2.3.2. Accuracy Assessment
2.3.2.1. Ecological Zones
The OA, UA and PA for each ecological zone using original percent tree cover are shown in Figure 2.4; there are different accuracies for different tree cover thresholds in different ecological zones. In the subtropical mountain system, the OA ranged from 75% to 85% and the highest OA was obtained when the tree cover threshold was 20%. The OA was stable, with a range from 82% to 85% when tree cover threshold changed from 10% to 80%; but it gradually decreased, when the tree cover threshold changed from 80% to 90%. The OA of the tropical dry forest was over 90% for all tree cover thresholds. The highest OA was obtained between tree cover thresholds of 10% and 30%; it also decreased with further increases in tree cover threshold. In the tropical moist deciduous forest, the OA ranged from 58.4% to 74.6% and the highest OA was found at a 40% tree cover threshold. The OA increased, when the tree cover threshold increased from 10% to 40%; but it gradually decreased with an increase in the tree cover threshold from 50% to 90%. The OA of the tropical mountain system showed a similar trend to that of tropical moist deciduous forest and ranged from 60.2% to 78.4%. The OA gradually increased in accordance with the threshold of tree cover, when the threshold was between 10% and 30%. The OA then gradually decreased. Although the OAs of the other ecological zones were highest when the threshold of tree cover was between 10% and 40%, the tropical rainforest zone needed a tree cover threshold of 80% to achieve highest OA.
The OA of the tropical rainforest increased from 68.1% at 10% tree cover threshold to 73.7% at 80% threshold and then decreased to 67.5% at 90% tree cover threshold.
Therefore, the highest OA was found at various optimal tree cover thresholds, depending on the ecological zone.
The UA and PA of forest and non-forest areas for each ecological zone showed similar trends, except for the tropical dry forest zone. The UA of forest and PA of non-forest areas increased with an increase of tree cover threshold from 10% to 90%, while the PA of forest and UA of non-forest decreased. In the tropical dry forest zone, the UAs of forest and non-forest and PA of non-forest were nearly 100%, indicating they were independent of the tree cover threshold. However, the PA of forest decreased in accordance with increasing tree cover threshold. The PA only reached a
19
maximum of 41.7% and showed lower values than the PA of forest in other ecological zones.
The OA, UA and PA values for each ecological zone using the average of percent tree cover are shown in Figure 2.5. The results were similar to the results for the original percent tree cover. The highest OAs were slightly higher than those using the original percent tree cover in the tropical mountain system, subtropical mountain system, and tropical moist deciduous forest.
Figure 2.4. Overall accuracy (OA), producer's accuracy, and user's accuracy for forest and non-forest at the national scale and in the five ecological zones using original percent tree cover
20
Figure 2.5. Overall accuracy (OA), producer's accuracy, and user's accuracy for forest and non-forest areas at the national scale and in the five ecological zones using the average tree cover percent of nine neighboring pixels
In the tropical dry forest, the highest OAs were same as those using the original percent tree cover. In the tropical rainforest, the highest OAs were lower than those using the original percent tree cover. The highest OAs of the two options were different, with a maximum difference between the two of 7% for the subtropical mountain system. The optimal thresholds using the average of percent tree cover were different from those using the original percent tree cover in the subtropical mountain system, tropical mountain system, and tropical rainforest. The highest OAs were achieved at 40% threshold in the subtropical mountain system and tropical mountain system, and at 70% threshold in the tropical rainforest.
2.3.2.2. National Scale
At a national scale, when the tree cover threshold was uniquely determined for the whole country using original percent tree cover (see Appendix), the OA was almost stable between 10% and 80% tree cover thresholds (Figure 2.4). The OA decreased when the tree cover threshold changed from 80% to 90%. The highest OA was 76.1%, when the tree cover threshold was 40%. Figure 2.6 shows forest cover maps using 40% and 90% tree cover thresholds, which gave the highest and lowest OAs, respectively. The UA of forest increased in accordance with an increase in the tree cover threshold from 10% to 90%. In contrast, the PA of forest continuously
21
decreased from 93.5% to 27.9%, when the tree cover threshold changed from 10% to 90%.
When the tree cover threshold was determined by the optimal thresholds of tree cover from the ecological zones using the original percent tree cover, OA was 77.5%.
The PA and UA of forest were 85.1% and 69.0%, respectively. The PA and UA of non-forest were 71.9% and 86.8%, respectively. McNemar’s test showed that there was no significant difference at the 0.05 level between the highest OA, when the tree cover threshold was uniquely determined for the whole country (i.e., the OA when the tree cover threshold was 40%) and the OA when the tree cover threshold was determined by the optimal thresholds of tree cover from the ecological zones.
Figure 2.6. Forest cover maps for 2016 developed from the Global Forest Cover Database (GFCD) using original tree cover percent in 2000 [10] and (a) 40% tree cover threshold, or (b) 90% tree cover threshold.
22
Figure 2.7. Forest cover maps for 2016 developed from the Global Forest Cover Database (GFCD) using average tree cover percent of neighboring pixels in 2000 [10]
and (a) 40% tree cover threshold, or (b) 90% tree cover threshold.
When average tree cover percent was used, the results at a national scale showed similar results. When the tree cover threshold was uniquely determined, the highest OA was 77%. This was achieved when the tree cover threshold was 40%, as for the original percent tree cover and the lowest accuracy was found at 90% tree cover threshold. Forest cover maps at 40% and 90% tree cover threshold which have highest and lowest OAs were shown in Figure 2.7. When the tree cover threshold was determined by the optimal thresholds of tree cover from the ecological zones, the highest OA was 78.1%. There was no significant difference at the 0.05 confidence level between the highest OA when the tree cover threshold was uniquely determined and the OA when the tree cover threshold was determined by the optimal thresholds of tree cover from the ecological zones.
2.4. Discussion
The GFCD is a powerful dataset that provides data on tree cover, forest loss, and forest gain. However, to create a forest cover map from the GFCD, it is necessary to choose an appropriate tree cover threshold. Not surprisingly, the tree cover threshold affects the estimated forest cover (Figure 2.3). An arbitrary choice of tree cover
23
threshold may yield an overestimation or underestimation of forest cover. Thus, appropriate determination of the threshold is of practical importance. Here, I investigated the accuracy of the GFCD across different ecological zones based on a country-scale evaluation of Myanmar.
I tested forest cover maps using original tree cover percent downloaded from the website of GFCD and average tree cover percent of neighboring pixels. In both cases, the results of OA, UA and PA showed similar trends in different ecological zones. In addition, the optimal threshold at a national scale was 40% for both cases and the highest OAs showed little difference. Therefore, neighboring pixels were not necessary for accurate forest cover mapping using the GFCD.
The results clearly showed that different tree cover thresholds were required to achieve the highest OA for different ecological zones. The OAs of ecological zones other than the tropical rainforest were highest when the tree cover threshold was less than 50%. However, an 80% tree cover threshold was required to achieve the highest OA in the tropical rainforest. Previous studies that used the GFCD have selected different thresholds. The studies in Cambodia used 30% as the threshold (Davis et al.
2015), while a study in Brazil demonstrated that a 95% threshold yielded the highest OA (McRoberts et al. 2016) and a 70% threshold had the highest OA in Gabon (Sannier et al. 2016). According to the Global Ecological Zones (Simons 2001), Cambodia is dominated by tropical dry forest and tropical moist deciduous forest, but Brazil and Gabon are dominated by tropical rainforest, although tropical moist deciduous forests are sub-dominant in Brazil. Because the results showed that a higher threshold is required for tropical rainforest, the differences in the thresholds among countries may be explained by the differences in their dominant ecological zones. In this study, a 40% tree cover threshold was optimal to get the highest overall accuracy in tropical moist deciduous forest. A case study of Gola National Park in Sierra Leone (Lui & Coomes 2015) used 50% tree cover threshold, where tropical moist deciduous forest is dominant, to achieve an accuracy of more than 90%.
Therefore, this study generally confirms that different tree cover thresholds are necessary for different ecological zones, when creating forest cover maps using the GFCD.
While the results indicated that the best threshold to achieve the highest OA depended on the ecological zone, the result also showed that the threshold could be
24
uniquely determined for the whole country. The optimal threshold for each ecological zone, except for tropical rainforest, was concentrated between 10% and 40%. In addition, the variations of the OA for each ecological zone, (except for tropical rainforest), when tree cover threshold was between 10% and 40%, were small. Thus, the effect of changing the threshold on the OA was limited for all ecological zones, except for tropical rainforest. The difference in optimal thresholds and the area ratio between the tropical rainforest and the other zones will substantially affect the optimal threshold at the national scale. In the case of Myanmar, tropical rainforests occupied only approximately 30% of the total area and the remainder was occupied by other ecological zones. Because most of the land was covered by ecological zones other than tropical rainforests, the OA could be uniquely determined over the whole country. However, the threshold may need to be determined by the ecological zone in regions, where tropical rainforests occupy more area than in Myanmar.
According to the FRA 2015 (FAO. 2014), forests covered approximately 42.92%
of the total land area in Myanmar. Thus, the GFCD overestimated the forest cover even at a 40% tree cover threshold, which yielded the highest OA at national scale. As shown in Figures 2.4 and 2.5, when the OA was the highest with 76.1% at a 40% tree cover threshold at national scale, the UA of forest with 66.1% had a lower value than the PA of forest with 89.5%. This trend reflects an overestimation of the forest class.
The overestimation of forest was observed, when the tree cover threshold was between 10% and 70%. Because a threshold between 10% and 50% is commonly applied (e.g., Davis et al. 2015; Peter Potapov et al. 2017; Lonn et al. 2018; Lonn et al. 2019), the overestimation of forest area when the GFCD is used needs to be considered. The other reason for the overestimation was linked to the definition of forest. In this study, the forest was defined based on a visual interpretation of tree crowns. In the case of the forest cover reported by the FRA 2015 (FAO. 2014), “forest does not include land that is predominantly under agricultural or urban land use”
(MacDicken 2012, p. 3). Thus, land covers such as fruit tree plantations and oil palm plantations are not included in the forest cover reported by the FRA 2015 (MacDicken 2012). However, because the tree cover in the GFCD does not take into account the land use of forests, forest areas derived from the GFCD will be overestimated.
In this study, I evaluated the effect of different tree cover thresholds on the accuracy of forest cover maps from the GFCD and the importance of tree cover
25
thresholds in five ecological zones, distributed across Myanmar. The results could be applied to the other regions having the same ecological zones as Myanmar, especially within the tropics. Because Myanmar is located in a tropical region, this study focused on only a limited number of ecological zones. Further study focusing on temperate and boreal regions is also required to refine this method. Clearly, direct comparison among different tropical countries would also be worthwhile.
2.5. Conclusions
Tree cover threshold is one of the important indicators used to create forest cover maps from remote sensing data. This study evaluated the effect of changing tree cover thresholds on the accuracy of forest cover maps derived from the GFCD and the importance of tree cover thresholds for creating forest cover maps from the GFCD for large-area monitoring. It is clearly showed that OA of forest cover maps increased or decreased in accordance with the change of tree cover thresholds for nine different thresholds from 10% to 90% and that the range of effect of changing tree cover threshold on the accuracy was different in five ecological zones. Because the highest OA was found at various thresholds for different ecological zones, different optimal tree cover thresholds should be selected to achieve the highest OA. However, in the unique case of Myanmar, it was able to determine the threshold over the whole country. I concluded that the threshold of tree cover for creating a forest cover map from the GFCD at national scale should be determined according to the areal ratio of ecological zones. The results from this study suggest a need to consider tree cover threshold, when creating forest cover maps from the GFCD, especially in regions where tropical rainforest is dominant. Because this study focused on tropical forest regions, further study is needed in temperate and boreal regions. Clearly, comparative study of different tropical countries is also necessary.
26
Appendix I
Nine forest cover maps in 2016 and the results of accuracies using (i) tree cover percent in original pixel (later: one pixel) and (ii) average tree cover percent in 3 x 3 neighboring pixels (later: 3 x 3 pixels)
SMS = Subtropical Mountain System TDF = Tropical Dry Forest
TMDF = Tropical Moist Deciduous Forest TMS = Tropical Mountain System
TRF = Tropical Rain Forest
OA = Overall Accuracy
UA (F) = User’s Accuracy (Forest) PA (F) = Producer’s Accuracy (Forest) UA (NF) = User’s Accuracy (Non-forest) PA (NF) = Producer’s Accuracy (Non-forest)
27
Figure S2.1: Forest cover maps in 2016 using tree cover percent in one pixel and (3x3) pixels at 10% tree cover threshold
Table S2.1: Accuracies of forest cover maps in 2016 using one pixel and (3x3) pixels at 10% tree cover threshold
10% tree cover threshold (one pixel)
National SMS TDF TMDF TMS TRF
OA 73.4 83.0 94.9 70.2 74.9 68.1
UA(F) 62.5 65.9 100.0 62.5 69.5 56.4
PA(F) 93.5 90.0 41.7 93.6 95.6 95.1
UA(NF) 92.5 94.9 94.7 89.4 90.6 93.7
PA(NF) 58.7 80.0 100.0 48.9 50.3 49.7
10% tree cover threshold ( 3 x 3 pixels)
National SMS TDF TMDF TMS TRF
OA 71.7 76.0 94.9 68.3 73.1 67.1
UA(F) 60.6 55.8 100.0 60.8 67.4 55.6
PA(F) 94.5 96.7 41.7 94.0 97.2 95.6
UA(NF) 93.2 97.9 94.7 89.2 93.2 94.0
PA(NF) 54.9 67.1 100.0 44.9 44.4 47.7
28
Figure S2.2: Forest cover maps in 2016 using tree cover percent in one pixel and (3x3) pixels at 20% tree cover threshold
Table S2.2: Accuracies of forest cover maps in 2016 using one pixel and (3x3) pixels at 20% tree cover threshold
20% tree cover threshold (one pixel)
National SMS TDF TMDF TMS TRF
OA 75.1 85.0 94.9 72.5 77.2 68.9
UA(F) 64.2 69.2 100.0 64.8 71.8 57.1
PA(F) 92.9 90.0 41.7 92.4 95.6 94.6
UA(NF) 92.2 95.1 94.7 88.8 91.4 93.3
PA(NF) 61.9 82.9 100.0 54.3 55.6 51.3
20% tree cover threshold ( 3 x 3 pixels)
National SMS TDF TMDF TMS TRF
OA 74.2 85.0 94.9 70.6 76.6 68.5
UA(F) 63.2 69.2 100.0 62.9 70.9 56.7
PA(F) 93.8 90.0 41.7 93.2 96.7 95.6
UA(NF) 92.9 95.1 94.7 89.0 93.1 94.3
PA(NF) 59.8 82.9 100.0 50.0 52.9 50.0
29
Figure S2.3: Forest cover maps in 2016 using tree cover percent in one pixel and (3x3) pixels at 30% tree cover threshold
Table S2.3: Accuracies of forest cover maps in 2016 using one pixel and (3x3) pixels at 30% tree cover threshold
30% tree cover threshold (one pixel)
National SMS TDF TMDF TMS TRF
OA 75.9 84.0 94.9 73.8 78.4 70.1
UA(F) 65.5 69.4 100.0 66.4 73.4 58.3
PA(F) 91.4 83.3 41.7 91.2 94.5 93.1
UA(NF) 91.1 92.2 94.7 87.9 90.1 92.0
PA(NF) 64.5 84.3 100.0 58.0 59.5 54.4
30% tree cover threshold ( 3 x 3 pixels)
National SMS TDF TMDF TMS TRF
OA 75.8 88.0 94.2 73.4 77.8 69.3
UA(F) 65.1 75.0 100.0 65.7 73.0 57.4
PA(F) 92.3 90.0 33.3 92.4 93.9 94.6
UA(NF) 91.8 95.3 94.0 89.1 89.1 93.4
PA(NF) 63.6 87.1 100.0 56.2 58.8 52.0
30
Figure S2.4: Forest cover maps in 2016 using tree cover percent in one pixel and (3x3) pixels at 40% tree cover threshold
Table S2.4: Accuracies of forest cover maps in 2016 using one pixel and (3x3) pixels at 40% tree cover threshold
40% tree cover threshold (one pixel)
National SMS TDF TMDF TMS TRF
OA 76.1 83.0 94.2 74.6 78.1 70.1
UA(F) 66.1 68.6 100.0 67.7 74.3 58.3
PA(F) 89.5 80.0 33.3 89.2 91.2 93.1
UA(NF) 89.6 90.8 94.0 86.2 85.7 92.0
PA(NF) 66.3 84.3 100.0 61.2 62.7 54.4
40% tree cover threshold ( 3 x 3 pixel )
National SMS TDF TMDF TMS TRF
OA 77.0 90.0 94.2 75.0 79.3 70.3
UA(F) 67.0 88.5 100.0 67.9 75.0 58.5
PA(F) 90.1 76.7 33.3 90.0 92.8 93.1
UA(NF) 90.3 90.5 94.0 87.1 88.2 92.1
PA(NF) 67.4 95.7 100.0 61.2 63.4 54.7
31
Figure S2.5: Forest cover maps in 2016 using tree cover percent in one pixel and (3x3) pixels at 50% tree cover threshold
Table S2.5: Accuracies of forest cover maps in 2016 using one pixel and (3x3) pixels at 50% tree cover threshold
50% tree cover threshold (one pixel)
National SMS TDF TMDF TMS TRF
OA 75.9 84.0 94.2 73.4 77.8 70.5
UA(F) 66.8 73.3 100.0 68.1 75.6 58.8
PA(F) 85.5 73.3 33.3 83.3 87.3 91.7
UA(NF) 86.6 88.6 94.0 80.9 81.6 90.8
PA(NF) 68.8 88.6 100.0 64.5 66.7 56.0
50% tree cover threshold ( 3 x 3 pixels)
National SMS TDF TMDF TMS TRF
OA 76.5 87.0 94.2 74.4 78.7 70.3
UA(F) 67.8 87.0 100.0 69.0 77.2 58.7
PA(F) 85.0 66.7 33.3 84.1 86.2 90.7
UA(NF) 86.4 87.0 94.0 81.9 81.1 89.8
PA(NF) 70.3 95.7 100.0 65.6 69.9 56.4
32
Figure S2.6: Forest cover maps in 2016 using tree cover percent in one pixel and (3x3) pixels at 60% tree cover threshold
Table S2.6: Accuracies of forest cover maps in 2016 using one pixel and (3x3) pixels at 60% tree cover threshold
60% tree cover threshold (one pixel)
National SMS TDF TMDF TMS TRF
OA 74.8 82.0 93.4 71.7 76.6 70.3
UA(F) 67.5 77.3 100.0 68.5 77.2 59.3
PA(F) 78.3 56.7 25.0 75.3 80.7 86.3
UA(NF) 81.9 83.3 93.3 75.3 75.9 86.3
PA(NF) 72.2 92.9 100.0 68.5 71.9 59.4
60% tree cover threshold ( 3 x 3 pixels)
National SMS TDF TMDF TMS TRF
OA 76.8 87.0 94.2 74.6 78.1 71.5
UA(F) 69.8 94.7 100.0 71.3 80.0 60.2
PA(F) 79.9 60.0 33.3 78.1 79.6 88.2
UA(NF) 83.5 85.2 94.0 78.2 76.0 88.2
PA(NF) 74.5 98.6 100.0 71.4 76.5 60.1
![Figure 2.6. Forest cover maps for 2016 developed from the Global Forest Cover Database (GFCD) using original tree cover percent in 2000 [10] and (a) 40% tree cover threshold, or (b) 90% tree cover threshold](https://thumb-ap.123doks.com/thumbv2/123deta/9786600.1869800/34.893.217.716.437.813/figure-forest-developed-global-database-original-threshold-threshold.webp)
![Figure 2.7. Forest cover maps for 2016 developed from the Global Forest Cover Database (GFCD) using average tree cover percent of neighboring pixels in 2000 [10]](https://thumb-ap.123doks.com/thumbv2/123deta/9786600.1869800/35.893.216.737.100.485/figure-forest-developed-global-forest-database-average-neighboring.webp)
