ISSN:1347-0825 CODEN:CSKKCS
Bull NARO Inst Livest Grassl Sci
畜 草 研 研 報
畜産草地研究所
独立行政法人 農業・食品産業技術総合研究機構
Bulletin of NARO Institute of Livestock and Grassland Science
NARO Institute of Livestock and Grassland Science
(NILGS)
Ibaraki, Japan
第 15 号 〈 No.15 〉 平成 27 年 3 月 -March2015-
所 長
Director-General草地研究監
Director, Grassland Research
編集委員長
Editor-in-Chief
副編集委員長
Deputy Editor編集委員
Associate Editor土 肥 宏 志
Hiroshi DOHI大 同 久 明
Hisaaki DAIDO阿 部 啓 之
Hiroyuki ABE吉 田 信 代
Nobuyo YOSHIDA小 迫 孝 実
Takami KOSAKO間 野 吉 郎
Yoshiro MANO秋 山 典 昭
Fumiaki AKIYAMA手 島 茂 樹
Shigeki TEJIMA浦 川 修 司
Shuji URAKAWA平 子 誠
Makoto HIRAKO森 岡 理 紀
Riki MORIOKA野 村 将
Masaru NOMURAEditorial Board
第 15 号(平成 27 年3月)
− 目 次 −
− 原著論文 −
方位と斜度が東日本(冷涼地域)におけるセンチピードグラス(Eremochloa ophiuroides (Munro)
Hack.)被覆速度におよぼす影響(英文)
……… 平野清・北川美弥・中野美和・
西田智子・池田堅太郎・山本嘉人…… 1
近赤外分光分析による単味飼料を用いた濃厚飼料の飼料成分推定の検討
……… 江口研太郎・野中和久……11
飼料中カリウムおよびタンパク質を制御した泌乳牛の尿量低減化が尿石症を発症させる可能性
……… 大谷文博・樋口浩二・小林洋介・野中最子……19
NARO INSTITUTE OF
LIVESTOCK AND GRASSLAND SCIENCE
No.15 (March2015)
CONTENTS
Research Papers
Kiyoshi HIRANO, Miya KITAGAWA, Miwa NAKANO, Tomoko NISHIDA, Kentaro IKEDA and Yoshito YAMAMOTO :
The Influence of Slope Aspect and Slope Angle on the Spread of Centipedegrass (Eremochloa
ophiuroides (Munro) Hack.) in Eastern Japan (Temperate Climate) ……… 1
Kentaro EGUCHI and Kazuhisa NONAKA :
The Feasibility of Near Infrared Reflectance Spectroscopy for the Analysis of Feed Composition
of Concentrated Feed Used Feed Ingredients ………11
Fumihiro OHTANI, Kouji HIGUCHI, Yousuke KOBAYASHI and Itoko NONAKA :
The Possibility to Develop Urolithiasis in Lactating Dairy Cows Reduced Urine Volume by
Controlling Dietary Potassium and Protein ………19
Introduction
In Japan, abandoned cultivated lands have been increasing because of labor shortages, particularly in mountainous areas15). On a relatively flat land, agricultural machinery can facilitate the introduction of highly productive grass species. In contrast, on a steep slope terrain, using agricultural machinery is difficult. Cattle
grazing is one of the most suitable and promising options for utilizing such lands17). However, Koyama et al.14) reported that if cattle grazing is continued on abandoned cultivated lands, the amount of native plants might reduce, vegetation will decline, and grazing will not be possible. Turf grasses such as Zoysia japonica Steud., which is one of the most commonly used grasses in abandoned cultivated lands in Japan19), are useful in such a situation since they can be Abstract
In order to economically and rapidly introduce centipedegrass (Eremochloa ophiuroides (Munro) Hack.) to support grazing on abandoned cultivated lands in eastern Japan (temperate climate), we used continuous rather than categorical data to investigate the influence of slope aspect and slope angle on the rate of spread in centipedegrass. We planted centipedegrass in 2003, and the coverage of centipedegrass was investigated in 61 quadrats with varying slope aspects and slope angles between 2003 and 2008. The number of years from the initial appearance to the maximum rate of centipedegrass spread (YMS, years of maximum spread) was calculated. The quadratic surface regression was also calculated to estimate the relationship among YMS, slope angle, and slope aspect. The highest YMS was 1.0–1.5 years in the quadrats that faced south and were relatively flat, whereas the lowest YMS was 3.0–3.5 years in the quadrats that faced north and had a slope angle of 10–20°. Therefore, centipedegrass can be introduced using a lower seeding rate on flat or gentle-sloping lands with southern aspects, even in eastern Japan (temperate climate) that had -4.7°C of daily minimum air temperature in monthly average. Further, quadratic surface regression showed significant effect of slope aspect and slope angle, but its predictability was low, suggesting that plant species shading centipedegrass affected the spread of centipedegrass.
Key words: Eremochloa ophiuroides, slope angle, slope aspect, spread rate, turf grass
Kiyoshi HIRANO, Miya KITAGAWA1, Miwa NAKANO, Tomoko NISHIDA2, Kentaro IKEDA3 and Yoshito YAMAMOTO
Received 2013.4.10, accepted 2014.10.3
The Influence of Slope Aspect and Slope Angle on the Spread of Centipedegrass (Eremochloa ophiuroides (Munro) Hack.) in Eastern Japan (Temperate Climate)
Grassland Management Research Division,
NARO Institute of Livestock and Grassland Science, Nasushiobara, 329-2793 Japan
1 Grassland Management Research Division,
NARO Institute of Livestock and Grassland Science, Miyota, 389-0201 Japan
2 National Institute for Agro-Environmental Sciences, Tsukuba, 305-8604 Japan
3 NARO Tohoku Agricultural Research Center, Morioka, 020-0198 Japan
maintained with little or no fertilizer, conserve soil on the slopes12), and are tolerant to trampling by cattle9). However, it has a lower seed germination rate, and introduction of this grass species by sowing seeds is difficult. Hence, Z.
japonica seedlings are usually transplanted; however, this requires considerable manpower4,13).
R e c e n t l y, c e n t i p e d e g r a s s (E r e m o c h l o a ophiuroides (Munro) Hack.), native to south China5), is increasingly being used as turf grass type plant species10). Because centipedegrass has a higher germination rate, it can be introduced by sowing seeds24). In Japan, studies have focused on the applicability of centipedegrass in relatively warm southwestern regions5,8), since this species is a warm-season perennial grass10). Increasing the usage of centipedegrass in Japan requires that more information should be obtained regarding its adaptability to temperate climate such as that found in eastern Japan.
In our previous study, we used centipedegrass grassland to graze reproductive cows in regions with a temperate climate, and showed the effectiveness of this grass for calf production6). Introducing centipedegrass in temperate climate requires information regarding the method to increase the spread of centipedegrass. Higher seeding rate increases the rate of spread in centipedegrass including seed germination, seedling establishment, and leafy stolon elongation24). However, centipedegrass seeds are expensive (about 15,000 yen・kg-1 in Japan), and increasing the seeding rate is difficult in abandoned cultivated lands. Thus, a method to increase the rate of spread in centipedegrass with lower seeding rate is required.
Slope angle and slope aspect affect the introduction of grasses23) and grassland vegetation2). If topographical features affect the rate of spread in centipedegrass, conditions that increase the spread rate would reduce the seeding rate and thus decrease the cost of introducing centipedegrass. The effect of slope aspect on the rate of spread in centipedegrass has been evaluated in southwestern Japan7), but not in eastern Japan. The effects of slope angle and slope aspect need to be elucidated because abandoned cultivated lands have varying and continuous slope angles and aspects. However, previous studies on the effect of slope aspect and slope angle on grassland vegetation used categorical data (fixed angles and aspects) rather than continuous data1,2,7,20,22). Evaluation of the rate of spread in centipedegrass by using continuous
data for slope aspect and slope angle might provide detailed information regarding the rate of seeding required according to topographical features. In this study, we used continuous data on slope aspect and slope angle to investigate the influence of these factors on the spread of centipedegrass in the temperate climate of eastern Japan.
Materials and Methods
Study site
This study was conducted at an experimental pasture called the Fujinita site at the NARO Institute of Livestock and Grassland Science, Tochigi Pref. (36° 55′ N, 139°58′ E; 330 m elevation) between 2003 and 2008.
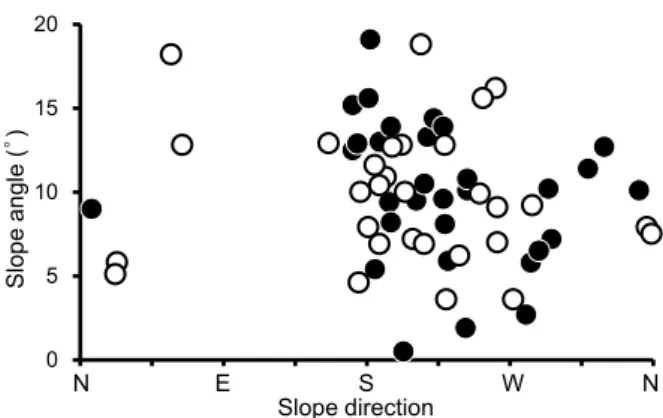
During the study period, the mean monthly air temperature ranged from 0.1 to 24.7°C, and the monthly rainfall ranged from 8 to 543 mm. The annual mean temperature was 11.7–12.5°C, and the annual total rainfall was 1,483–1,909 mm. The annual minimum and maximum air temperatures ranged from -10.1 to -7.0°C and from 32.3 to 36.1°C, respectively. A 3-ha pasture, including sites with various slope aspects (from 7 to 359°, where north, 0°; east, 90°; south, 180°; and west, 270°) and slope angles (0.5 to 19.1°), was used (Figure 1). Before planting in 2003, the pasture was dominated by Pleioblastus chino (Franch. et Savat.) Makino; Z. japonica; Pennisetum alopecuroides (L.)
0 5 10 15 20
0 45 90 135 180 225 270 315 360
Slope direction
Slope angle(゜)
N E S W N
Fig. 1. Distribution of slope aspect and slope angle in the 61 quadrats.
In all, 72 quadrats were planted with centipedegrass in June 2003, but centipedegrass was found in only 61 quadrats in September 2008.○ , seeded; ● , transplanted.
Spreng.; and Digitaria adscendens (H.B.K.) Henr.; this type of vegetation is typically found in abandoned cultivated lands in this region.
Experiments
In this study, to evaluate the rate of spread in centipedegrass, we used two introducing methods with an increased observation point and improved precision.
Centipedegrass was seeded or transplanted within the 3-ha area (each plot, 0.5 ha; 3 replicates) between June 4 and 20, 2003. Seeding rate was 10 kg・ha-1 as reported previously24), and the transplanting rate was one pot per meter square with small seedlings (i.e., 2 to 3 leaf stage; height, 3 cm;
seedling pot: diameter, 1 cm; depth, 3 cm; individuals per pot, 2 to 3; seedlings, purchased). Each pot was transplanted into a hole dug in the ground (diameter, 2 cm; depth, 3 cm) by using portable electric drills. In all, 72 quadrats of 1 m ×1 m were established to represent various slope aspects and slope angles (Figure 1). Slope angle and slope aspect in each quadrat were measured using a clinometer.
Half the quadrats were seeded, and the remaining were transplanted. Coverage of centipedegrass and other plants was measured every May and September from 2003 to 2008. No fertilizer was applied during the experimental period assuming low cost introduction and maintenance in
abandoned cultivated lands. The soil at the site is Andosol.
The pasture was grazed by reproductive Japanese Black cows from spring (late April or early May) to autumn (mid- October) at stocking rates of 291–439 head・day・ha-1.
Data analysis
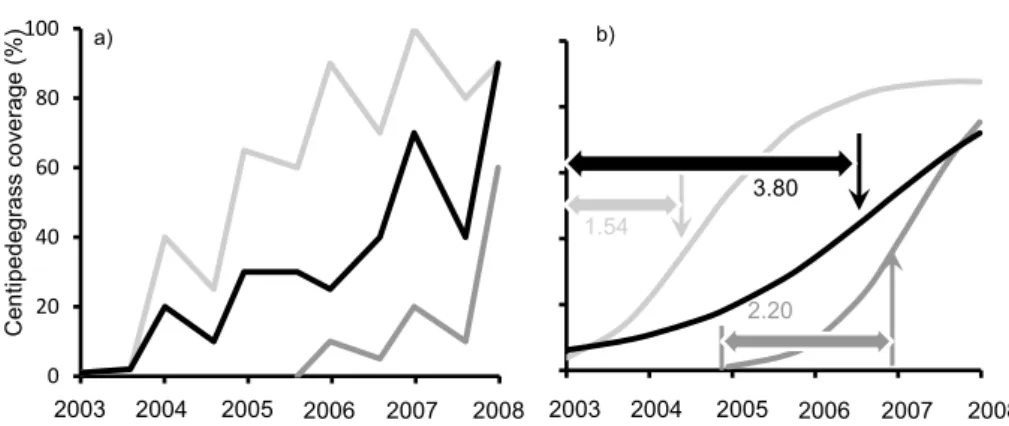
Slope aspect was converted into a numerical value from north = 0 and 1° = 1 for east, with north as 0, east as 90, south as 180 and west as 270 with fractional values for angles between the primary aspects. We used centipedegrass coverage data from 61 quadrats between 2003 and 2008. The rate of spread in centipedegrass in each quadrat was analyzed by calculating the years from appearance to the maximum rate of spread in centipedegrass (YMS) by using a quadratic logistic regression (Figure 2). The changes of coverage in centipedegrass in each quadrat from the appearance of centipedegrass seedlings until October 2008 (Figure 2a) were fitted to the quadratic logistic regression equation25):
y = Y/(1+ae-bt-ct2 )
where y is centipedegrass coverage at time t; Y is the final coverage; and a, b, and c were obtained from the data to estimate the relative rate of spread in centipedegrass (Figure 2b). The year of maximum rate of spread in centipedegrass was calculated by differentiating the
0 1 2 3 4 5
3.80 1.54
2.20
Year 0
20 40 60 80 100
0 1 2 3 4 5
a)
Centipedegrasscoverage (%) b)
2003 2004 2005 2006 2007 2008 2003 2004 2005 2006 2007 2008
Fig. 2. Concept of the index of the rate of spread in centipedegrass (years from centipedegrass appearance to maximum rate of spread in centipedegrass: YMS) for analysis by using a quadratic logistic regression equation.
Lines of different shades represent data from 3 sample quadrats having different slope aspects and slope angles. (a) Time course of measured centipedegrass coverage.
(b) Quadratic logistic regression from fitting actual measured values; the single arrows indicate the time of maximum rate of spread in centipedegrass calculated by differentiating the equation with respect to time; YMS (double-headed arrows) indicates the period of the rate of spread in centipedegrass in each quadrat.
equation with respect to time (dy/dt). YMS was calculated from the time of maximum rate of spread in centipedegrass minus the time of appearance in each quadrat. A logistic regressive equation21) was calculated between YMS of seeding and transplanting.
The relationship between Y MS and slope aspect and slope angle was determined by calculating the regression curves by using the following quadratic surface regression:
YMS=a × SD2 + b × SD + c × SA2 + d × SA + f where a, b, c, d, and f were obtained by fitting this equation to the data to estimate the relative YMS; SD was the slope aspect; and SA was the slope angle. YMS, SD, and SA were standardized when they were regressed using a least- squares method.
The least-squares method of Snedecor and Cochran18) was used for quadratic logistic regression and quadratic surface regression. Significant differences among these regressions were tested using analysis of variance (ANOVA)18). The statistical analyses were conducted using SAS version 9.2 (SAS Institute, Cary, NC, USA). In this research work we used the supercomputer of AFFRIT, MAFF, Japan.
Results
Topographical effects on the growth of centipedegrass Logistic analysis was used to evaluate the dif ference in topog raphical distr ibution between centipedegrass seeding and transplanting. There were no significant differences between seeding and transplanting (χ2= 0.0164, d.f. = 1, P = 0.898). Therefore, we pooled the seeding and transplanting data for the subsequent evaluations to increase the observation point and improve precision.
Changes in centipedegrass coverage over time
In September 2003, centipedegrass seedlings were observed in 57 of the 72 quadrats. In September 2008, centipedegrass was found in 61 of the 72 quadrats, suggesting that centipedegrass had invaded four quadrats from 2003 to 2008. Of the 11 quadrats where centipedegrass perished, 10 were shaded by trees and 1 was dominated by Pennisetum alopecuroides (L.) Spreng. and Trifolium repens L.
The average centipedegrass coverage increased from spring to autumn, but not from autumn to spring.
It decreased from autumn to spring every year after 2004 (Figure 3). In all quadrats, centipedegrass coverage increased with time, and the rate of increase differed across the quadrats. Average centipedegrass coverage in autumn was 1 % in 2003, 30 % in 2005, and 68 % in 2008;
centipedegrass coverage across all the quadrats ranged from 0 to 90% in 2005 and from 3 to 100% in 2008.
Changes in centipedegrass coverage with slope aspect and slope angle
In 2005, the quadrats with higher centipedegrass coverage were located on slopes facing south to west, and those with lower coverage were located on slopes facing north (Figure 4a). Centipedegrass coverage on slopes facing in any aspect was higher in 2008 than in 2005. Slope angle seemed to have a little effect on centipedegrass coverage (Figure 4b). The increase of centipedegrass coverage from 2003 to 2005 and from 2006 to 2008 was evaluated by performing quadratic regression of slope angle and centipedegrass coverage (Table 1). At the locations with a large slope angle, the increase of centipedegrass coverage was small from 2003 to 2005, and it increased from 2006 to 2008. Thus, centipedegrass spread was markedly affected by slope aspect and slightly affected by slope angle.
Coverage (%)
0 20 40 60 80 100
Sep May Sep May Sep May Sep MaySep May Sep 2003 2004 2005 2006 2007 2008 Fig. 3. Coverage of centipedegrass.
Maximum (---), mean (—), and minimum (・・・) coverage.
Whiskers show coefficient of variation, n = 61.
Changes in the rate of spread in centipedegrass as a function of slope aspect and slope angle
The mean value and standard deviation of YMS were 2.55 and 1.03, respectively. The mean values ranged from 0.62 to 4.69 years.
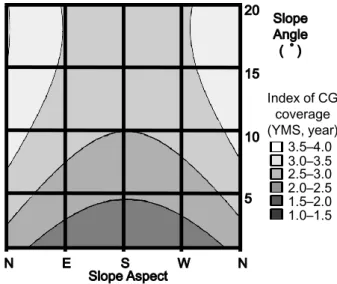
The relationship of YMS to slope aspect and slope angle was evaluated using a quadratic surface regression (Figure 5):
YMS = 0.0000221 × SD2 - 0.00806 × SD - 0.00446 × SA2 + 0.163 × SA + 2.0126 (n = 61, r2 = 0.126, P < 0.05).
The ANOVA for this regression was significant (P < 0.05;
Table 2), but it showed low predictability (r2 = 0.126). The highest YMS was 1.0–1.5 years in the 185° aspect on a flat ground. YMS decreased gradually with changes in aspects and slopes. The YMS of 2.0–2.5 years was noted in the
Table 1. Slope angle and percentage of spread in centipedegrass
Period Slope angle
0° 5° 10° 15° 20°
The coverage of centipedegrass* (%)
2003–2005 23 30 32 28 20
2006–2008 16 32 41 42 34
The percentage of spread in centipedegrass (%)
2003–2005 60 48 44 40 37
2006–2008 40 52 56 60 63
* from quadratic regression of centipedegrass coverage in 2005 and 2008 0
20 40 60 80 100
0 45 90 135180225270315360
N E S W N
0 20 40 60 80 100
0 5 10 15 20
Slope angle(゜) Slope direction
Coverage of centipedegrass(%)
(a) (b)
Fig. 4. Centipedegrass coverage in 2005 and 2008 on the quadrats with different (a) slope aspects and (b) slope angles.
○ , 2005; ● , 2008.
S W N
E N
1.0–1.5 1.5–2.0 2.0–2.5 2.5–3.0 3.0–3.5 3.5–4.0 Index of CG
coverage (YMS, year)
Slope Angle (゜)
5 10 15 20
Slope Aspect
Fig. 5. Distribution of YMS (an index of the rate of spread in centipedegrass) with respect to slope aspect and slope angle.
CG: centipedegrass
quadrats located in the western aspect with 5–10° of slope angle and those located in the eastern and western aspects with around 5° of slope angle. At these locations, this finding suggested that the rate of spread in centipedegrass was about 50–60% of that in the locations with the highest YMS. The lowest YMS was 3.0–3.5 years in the quadrats with a northern aspect and 10–20° of slope angle. This suggested that the rate of spread in centipedegrass at these locations was about 33–42% of that in the locations with the highest YMS.
Discussion
Validity of the regression equation
In this study, continuous data were used to evaluate the influence of slope aspect and slope angle on the rate of spread in centipedegrass in eastern Japan (temperate climate; Figure 5). Yamamoto24)reported that centipedegrass coverage reached 90% by the third year after sowing in a flat agricultural land in eastern Japan.
The YMS values for the southern aspect and relatively flat conditions were 1.0–1.5; thus, on such quadrats, 2.0–3.0 years were required from the first appearance of centipedegrass to reach maximum coverage, because YMS is the half time for centipedegrass growth (Figure 2).
Therefore, the results from our equation are consistent with those reported by Yamamoto24) for flat conditions.
Effects of slope angle and aspect on centipedegrass growth
Plant productivity is affected by slope aspect, because of the higher air and soil temperatures and lower soil water content on the south-facing slopes than on the north-facing slopes in regions with temperate20) and warm climate22). In improved pastures, the productivity of warm-
season grasses such as bahiagrass (Paspalum notatum Flügge) is higher on the south-facing slopes; in contrast, temperate grasses such as orchardgrass (Dactylis glomerata L.), Italian ryegrass (Lolium multiflorum Lam.), and redtop (Agrostis alba L.) grow better on north-facing slopes1,16,23). Centipedegrass is ideal for tropical climates; it is classified as a warm-season grass10). Our finding that centipedegrass coverage showed a greater increase on the south-facing slopes is consistent with this classification.
Although centipedegrass is a warm-season grass, it can tolerate freezing10); hence, winter dieback of some centipedegrass might have slowed the spread of centipedegrass in eastern Japan (annual minimum air temperature ranged from -10.1 to -7.0°C). In this study, centipedegrass coverage decreased from fall to spring (Figure 3). Johnston and Dickens11) showed that 95% of centipedegrass survived at temperatures above -5.6°C, but the survival rate decreased to less than 20% at -10.1°C. At our study site, the monthly mean value of daily minimum temperature ranged from -4.7 to -2.5°C, which should allow more than 95% of centipedegrass to survive, but the minimum daily annual air temperatures were -10.1°C in 2006, which should allow < 20% of centipedegrass to survive. In addition, lower soil temperature on the north- facing slopes22)might have reduced the probability of overwintering and summer growth of centipedegrass.
Thus, the northern aspect and cold climate in eastern Japan decreased the overwintering survival of centipedegrass.
Hirata e t a l .7) evaluated the effect of aspect on centipedegrass spread in southwestern Japan (monthly mean value of daily minimum temperature in winter was around 0°C) and found no difference between the north- and south-facing slopes. Therefore, the influence of slope aspect on the spread of centipedegrass is an important factor in the temperate region with a monthly mean value of Table 2. Analysis of variance of the relationship of years of maximum spread (YMS)
with slope aspect and slope angle
Source of variation S.S. d.f. M.S. F
Regression 8.8 2 4.4 4.4 *
Deviation 58.1 58 1.0
* indicates statistical significance at the 5% level.
S.S.: some of square, d.f.: degree of freedom, M.S.: mean square
daily minimum temperature of around -4.7°C rather than in relatively warm regions.
With an increase in slope angle, the percentage of centipedegrass spread decreased from 2003 to 2005.
Cerdà and García-Fayos3) indicated that a higher slope angle increases the runoff rate of seeds by rainfall. Thus, the higher slope angle might have caused higher runoff rate of seeds, lower seed germination rate, and lower percentage of centipedegrass spread in 2003–2005. In addition, centipedegrass never spread on a higher slope angle in the upper aspect of the gradient, despite spreading in all aspects on a flat land. These factors might have affected the spread of centipedegrass in areas with a higher slope angle.
Botanical composition as another factor for the introduction of centipedegrass
The spread of centipedegrass introduction was affected by not only slope angle and slope aspect but also another factor, as was evident by the lower r2 (0.126, P < 0.05) for regression of YMS. The botanical composition was thought to be another factor that influenced the spread of centipedegrass. Hirata et al.7) also reported that centipedegrass coverage was lower on slopes with an easterly aspect, because these areas were dominated by bench-type tall fescue (Festuca arundinacea) as temperate grass, which is susceptible to both the spread of stoloniferous prostrate species and summer depression, rather than Paspalum notatum Flügge and Z. japonica, which were dominant on the other aspects. Z. japonica, the dominant species at our study site in 2003, was only distributed on slopes with a southern aspect, whereas P.
chino, P. alopecuroides, and D. adscendens were distributed on slopes with the remaining aspects (data not shown).
The quadrats distributed with P. chino were not replaced by centipedegrass, because P. chino is a tall grass and is not degraded by grazing, preventing its replacement by centipedegrass. In this study, centipedegrass could not be introduced in 11 quadrats: 10 quadrats were shaded by trees, and one quadrat was dominated by Pennisetum alopecuroides (L.) Spreng. and Trifolium repens L. These findings suggest that the competitive ability to spread was higher in centipedegrass than in most plant species, but was lower than some plant species that did not degrade during the grazing period and shaded centipedegrass with their tall height. These properties of vegetation and coverage of
centipedegrass were also considered to be affected by cattle grazing. Further studies are needed to clarify the effect of botanical composition and cattle behavior on centipedegrass spread.
Practical implications
Centipedegrass can be introduced in abandoned cultivated lands in eastern Japan in regions with a monthly mean value of daily minimum temperature of around
-4.7°C. It can be introduced from northern Kanto to more warm areas in southwestern Japan, but the possibility of introduction of centipedegrass in colder regions having low temperatures below -4.7°C in winter such as the mountainous areas, is still unclear. The rate of spread in centipedegrass studied using continuous data for slope aspect and slope angle revealed that the location of the highest spread rate was in the southern aspect having a flat ground (location A). The rate of spread in centipedegrass in locations of the western aspect with 5–10° of slope angle and eastern and western aspects with around 5°
of slope angle (location B) were about 50–60% of that in the locations with the highest spread. The locations with the lowest rate of spread in centipedegrass were those in the northern aspect having a 10–20° slope angle (location C); the spread rate in these locations was about 33–42%
of that found in the location with the highest spread. For considering different effective strategies to introduce centipedegrass by changing the seeding rate according to topographical features, the rate of spread in centipedegrass for different slope aspects and slope angles is available.
Yamamoto24) indicated that centipedegrass could be introduced at a seeding rate of 5 kg/ha in a flat ground, such as location A in our study. These results suggest that the seeding rate according to the topographical features should be 5 kg/ha in location A, 10 kg/ha in location B because of the 50–60 % decrease in the rate of spread compared with that at location A, and 15 kg/ha in location C because of the 33–42 % decrease in the rate of spread compared with that at location A. Thus, our regression relating the rate of spread in centipedegrass from continues data will facilitate more economical centipedegrass introduction rather than that from categorical data, because our regression equation is more suitable for abandoned cultivated lands with varying and continuous slope angles and slope aspects.
This study also suggested that the spread of
centipedegrass was affected by not only slope angle and slope aspect, but also vegetation. Plant species that shade centipedegrass throughout the grazing period might reduce the spread of centipedegrass. Thus, for the successful introduction of centipedegrass, care should be taken that it is not planted under trees and in areas that are subjected to intensive cutting or grazing.
Acknowledgments
We are grateful to Dr. Mamoru Nashiki, Dr.
Tetsuya Ikeda, Dr. Yasuko Togamura, Ms. Hiroko Suzuki, and the members of the Grassland Research Support Center of NILGS for their helpful assistance. This work was supported by the research project of “Grassland Dynamics in Japan” and “Integrated Research for Developing Japanese-style Forage Feeding System to Increase Forage Self-Support Ration” sponsored by the Ministry of Agriculture, Forestry and Fisheries of Japan.
References
1) Bennett, O.L., Mathias, E.L. and Henderlong, P.R.
(1972). Effects of north- and south-facing slopes on yield of Kentucky Bluegrass (Poa pratensis L.) with variable rate and time of nitrogen application, Agronomy J., 64, 630–635.
2) Bennie, J., Hill, M.O., Baxter, R. and Huntley, B. (2006).
Influence of slope and aspect on long-term vegetation change in British chalk grasslands, J. Ecol., 94, 355–
368.
3) Cerdà, A. and García-Fayos P. (1997). The influence of slope angle on sediment, water and seed losses on badland landscapes, Geomorphology, 18, 77–90.
4) GAFSA (2005). Manual for renovate and utilize Zoysia-type grassland, Japan grassland agriculture and forage seed association (GAFSA), Tokyo, 86p. (in Japanese.)
5) Hanna, W.W. and Burton, G.W. (1978). Cytology, reproductive behavior, and fertility characteristics of centipedegrass, Crop Sci., 18, 835–837.
6) Hirano, K., Yamamoto, Y. and Kitagawa, M.
(2010). Effect of fertilization on the productivity of centipedegrass (Eremochloa ophiuroides (Munro) Hack.) in the North Kanto region, J. Japan Grass. Sci.,
56 suppl. 17. (in Japanese.)
7) Hirata, M., Nagakura, Y., Yuki, N., Adachi, K., Fujii, R., Koyakumaru, T., Ogura, S., Moritake, H., Watanabe, C. and Fukuyama, K. (2007). Development and establishment of centipede grass (Eremochloa ophiuroides) in south-western Japan, Trop. Grassl., 41, 100–112.
8) Hirata, M., Mizuno, S. and Tobisa, M. (2012). Ability of centipedegrass (Eremochloa ophiuroides (Munro) Hack.) to spread by stolons, Effects of soil, fertilizer, shade and edging, Grassl. Sci., 58, 28–36.
9) Ishida, R. (1990). General remarks on the research works of Japanese lawn grass (Zoysia japonica Steud.) and Zoysia type grasslands in Japan, J. Japan Grassl.
Sci., 36, 210–217. (in Japanese with English abstract.) 10) Islam, M. and Hirata, M. (2005). Centipedegrass
(Eremochloa ophiuroides (Munro) Hack.): growth behavior and multipurpose usages, Grassl. Sci., 51, 183–190.
11) Johnston, W.J. and Dickens, R. (1977). Cold tolerance evaluation of several centipedegrass selections, Agronomy J., 69, 100–103.
12) Kashiwabara, H., Oyamada, M. and Sugimoto, Y. (2008).
The differences of lines of Zoysia japonica Steud and Eremochloa ophiuroides (Munro) Hack on growth and soil preservation in the slope land, J. Jpn. Soc.
Turfgrass Sci., 36, 100–104. (in Japanese with English abstract.)
13) Kochi pref., Tokushima pref. and Ehime pref. (1996).
Manual for renovate Zoysia japonica Steud using transplant seedling. Kochi pref., Kochi, 71p. (in Japanese.)
14) Koyama, N., Tanimoto, Y. and Senda, M. (2004).
Utilization of abandoned cultivated lands for grazing, Bull. Natl. Agric. Res. Cent. West. Reg., 3, 47–55. (in Japanese with English abstract.)
15) National Chamber of Agriculture (1999). Report of survey results of abandoned cultivated land realities and their future utilization, National Chamber of Agriculture, Tokyo, 205p. (in Japanese.)
16) Nikki, I., Ueno, M., Sugimoto, Y. and Nishi, T. (1980).
Vegetational difference among slope aspects –an investigation for Hanatate pasture, Bull. Fac. Agri.
Miyazaki Univ., 27, 375–382. (in Japanese with English abstract.)
17) Senda, M., Tanimoto, Y. and Koyama, N. (2003).
Economical results of grazing on less-utilized arable fields in LFAs, Bull. Natl. Agric. Res. Cent. West. Reg., 2, 41–58. (in Japanese with English abstract.)
18) Snedecor, G.W. and Cochran, W.G. (1980). Statistical methods, Iowa State University Press, USA, 507p.
19) Suganuma, T. (1966). Phytosociological studies on the semi-natural grasslands used for grazing in Japan, I.
Classification of grazing land, Jap. J. Bot., 19, 255–276.
20) Sugimoto, Y., Hirata, M., Ueno, M. and Nikki, I. (1987).
Effect of slope aspect on the vegetational and soil characteristics –an investigation on Mt. Ono in Aso province, Bull. Fac. Agri. Miyazaki Univ., 34, 297–304.
(in Japanese with English abstract.)
21) Tango T., Yamaoka K. and Takagi H. (1996). Logistic regression analysis, Asakura-shoten, Tokyo, 65–92. (in Japanese.)
22) Ueno, M., Sugimoto, Y. and Hirata M. (1985). Effects of slope aspects on the root growth of Bahiagrass, Paspalum notatum Flügge, J. Japan Grass. Sci., 31, 104–109. (in Japanese with English abstract.)
23) White, J.G.H., Meijer, G. and L anger, R.H.M.
(1972). Oversowing grasses on sunny and shady faces, Proceedings of the New Zealand Grassland Association, 34, 139–146.
24) Yamamoto, Y. (2005). Quick construction of a lawn grass type grazed pasture through Eremochloa ophiuroides seeding, Sustainable Livestock Production Human Welfare, 59, 131–134. (in Japanese.)
25) Yonezawa, K. (1988). Analysis of growth patterns of plants with growth curve, In: Biostatistics (Eds Yonezawa, K., Sasaki, Y., Imanishi, S. and Fujii, H.), Asakura-shoten, Tokyo, 178–183. (in Japanese.)
摘 要
北関東程度の冷涼な気候条件の耕作放棄地放牧において,経済的かつ早期にセンチピードグラス草地を造成するた め,斜面方位と斜度がセンチピードグラスの被覆速度に及ぼす影響を評価した。方位と斜度が異なる 61 のコドラー トにセンチピードグラスを 2003 年に導入し,2008 年までその被度を調査した。センチピードグラス被覆速度の指標 として,センチピードグラスの出現から最も早く広がる速度に達するまでの期間(YMS)を求めた。そして,方位 と斜度を独立変数,YMSを従属変数として曲線回帰を行った。その結果,YMSが最も短い地形は南向きの平坦な場 所で,その値は 1.0–1.5 年であった。YMSが最も遅い地形は北向きの 10–20゜の斜面で,その値は 3.0–3.5 年であった。
このことから,東日本の冷涼な気候(月平均最低気温が-4.7℃程度)の気候条件下でセンチピードグラスを種子によ り導入する場合,平坦な南側の地形で播種量を少なくすることが実用的と考えられた。一方,曲線回帰は有意である がr2が低く,その要因としてセンチピードグラス導入には前植生の庇蔭の影響も受けていたことが考えられた。
キーワード:センチピードグラス, 斜度, 方位, 被覆速度, シバ型草地
平野清・北川美弥1・中野美和・西田智子2・池田堅太郎3・山本嘉人
農研機構畜産草地研究所 草地管理研究領域,那須塩原市,329-2793
1 農研機構畜産草地研究所 草地管理研究領域,御代田町,389-0201
2 農業環境技術研究所,つくば市,305-8604
3 農研機構東北農業研究センター,盛岡市,020-0198
方位と斜度が東日本(冷涼地域)におけるセンチピードグラス
(Eremochloa ophiuroides (Munro) Hack.)被覆速度におよぼす影響
緒 言
畜産現場で家畜に飼料を給与する場合,その栄養価は 正しく求められなければならない。特に,飼料の種類を 変更する場合や,飼料の生産地が変更された場合には化 学分析を実施し正確な飼料成分を算出する必要がある。
しかし通常,飼料成分は時間と手間を要する化学分析に より求められるため,多くの場合,代替措置として日 本標準飼料成分表9)の数値が利用されている。しかし,
その値は実際に用いる飼料と成分値が異なる場合も多 く,場合によってはその差は無視できない程度に達する。
近赤外分光分析は迅速かつ安全な非破壊分析法であるた め,TMRセンターや飼料分析センター等の畜産現場に おいて有効な飼料設計の手法として用いられている。一 般的に,近赤外分光分析で飼料成分を推定する場合,検 量線は単味飼料ごとに作成される。しかし仕入れた濃厚
飼料に応じて検量線を選択するのは効率が悪いため,1 種類の検量線,すなわちユニバーサル検量線であらゆる 濃厚飼料の飼料成分を推定できることが望ましい。そこ で本試験では,濃厚飼料としてトウモロコシ穀実,ソル ガム穀実,エンバク穀実,コムギ穀実,ハトムギ穀実,
ソバ穀実,ごま穀実,ダイズ穀実,飼料用籾米,飼料用 玄米,黒もち玄米,食用精米,圧ぺんトウモロコシ,圧 ぺん大麦,大豆粕,ナタネ粕,小麦ふすま,大麦ふす ま,米ぬかおよびビートパルプを対象にし,飼料成分と して乾物率,粗タンパク質(CP)含量,タンパク質画分,
粗脂肪(EE)含量,酸性デタージェント繊維(ADFom)
含量,中性デタージェント繊維(aNDFom)含量および 澱粉含量を推定できるユニバーサル検量線を作成し,そ の推定精度と各飼料種への適合性を検討した。
要 約
近赤外分光分析法により濃厚飼料(トウモロコシ穀実,ソルガム穀実,エンバク穀実,コムギ穀実,ハトムギ穀実,
ソバ穀実,ごま穀実,ダイズ穀実,飼料用籾米,飼料用玄米,黒もち玄米,食用精米,圧ぺんトウモロコシ,圧ぺん大麦,
大豆粕,ナタネ粕,小麦ふすま,大麦ふすま,米ぬか,ビートパルプ)の飼料成分を推定するユニバーサル検量線の 作成を試みた。検量線評価時の決定係数(R2v)値と検量線作成時の標準偏差と検量線評価時の標準誤差の比(RPD)
値の結果は,乾物率(R2v = 0.86;RPD = 2.7),粗タンパク質(CP)含量(R2v = 0.99;RPD = 9.2),溶解性タンパ ク質(CPs)含量(R2v= 0.83;RPD = 2.4),非分解性タンパク質(CPu)含量(R2v = 0.88;RPD = 2.9),結合性 タンパク質(CPb)含量(R2v = 0.78;RPD = 2.0),粗脂肪(EE)含量(R2v = 1.00;RPD = 8.7),酸性デタージェ ント繊維(ADFom)含量(R2v= 0.87;RPD = 2.8),中性デタージェント繊維(aNDFom)含量(R2v = 0.94;RPD
= 4.1)および澱粉含量(R2v = 0.96;RPD = 5.4)であった。これらの結果から,濃厚飼料は近赤外分光分析装置を 用いて,乾物率,CPu,CPs,ADFom含量は準実用的な精度で推定できる可能性がある,aNDFom含量は実用的で高 い精度で推定できる可能性がある,澱粉含量は実用的で非常に高い精度で推定できる可能性がある,CPとEE含量 は化学分析相当で極めて高い精度で推定できる可能性があると判定された。
キーワード:近赤外分光分析法,濃厚飼料
江口研太郎・野中和久
農研機構畜産草地研究所 家畜飼養技術研究領域,那須塩原市,329-2793
2014 年 8 月 20 日受付, 2014 年 11 月 5 日受理
近赤外分光分析による単味飼料を用いた濃厚飼料の飼料成分推定の検討
材料および方法
1. 供試試料
トウモロコシ穀実 10 点,ソルガム穀実 14 点,エンバ ク穀実 2 点,コムギ穀実 2 点,ハトムギ穀実 2 点,ソバ 穀実 3 点,ごま穀実 3 点,ダイズ穀実 7 点,飼料用籾米 5 点,飼料用玄米 6 点,黒もち玄米 2 点,食用精米 6 点,
圧ぺんトウモロコシ 4 点,圧ぺん大麦 4 点,大豆粕 5 点,
ナタネ粕 3 点,小麦ふすま 2 点,大麦ふすま 2 点,米ぬ か 3 点,ビートパルプ 2 点の合計 87 点を供した。これ らの単味飼料を粉砕機(Wander Blender,大阪ケミカル 社,大阪)を用いてφ 1mmの篩を通過する粒度に粉砕し,
化学分析および近赤外分光分析に供した。ただし,澱粉 の定量には同様の方法でφ 0.5mmの粒度に粉砕したサ ンプルを供した。
2. 飼料分析
乾物率は乾燥機(DO-450FA,アズワン,大阪)を用 いて常法7),すなわち 135℃で 2 時間乾燥することに より定量した。CP含量はケルテックシステム(Kjeltec 2400/2460 Auto Sampler System,Tecator社, デ ン マ ー ク)を用いたケルダール法で定量した。CPのルーメ ン内での分解性の把握は生産性向上において重要であ る2)。特に高泌乳牛や子牛のようにCP要求量が高い場 合は,分解性タンパク質(CPd)だけでは要求量を満た すことができないため,CP要求量との差を非分解性タ ンパク質(CPu)で補うことにより牛へのタンパク質供 給を最も効率よく行うことが可能となる8)。これらの事 情に応じて粗飼料6,15)やサイレージ5)のタンパク質画分 に関しては近赤外分光分析法による検量線の作成が報告 されている。本試験では,濃厚飼料を対象にし,タンパ ク質画分としてCPd含量,CPu含量,溶解性タンパク 質(CPs)含量および結合性タンパク質(CPb)含量を 常法7)に従って定量した。EE含量はソックスレー抽出 法7)で,ADFom含量とaNDFom含量はデタージェント
分析法7,11,12)で定量した。澱粉含量は市販のキット(Total
starch assay kit,メガザイム社,アイルランド)を用い て定量した。これらの化学分析値からタンパク質画分以 外の成分は乾物中の各成分含有率として求めた。タンパ ク質画分についてはCP中の成分含有率を求め,近赤外 分光分析用の化学分析値データとして用いた。
3. 近赤外スペクトル
近 赤 外 分 光 分 析 装 置 に はModel 6500 型(FOSS NIRSystems社,USA) を 使 用 し, 本 体 に はSpinning
Sample Module(FOSS NIRSystems社,USA)を装着した。
粉砕試料(粒度φ 1mm)は標準セルに詰め 400–2500nm の範囲について 2nmおきに吸光度を測定し 32 回反復 走査した平均値をその吸光度とした。測定した近赤外 ス ペ ク ト ル は VISIONソ フ ト ウ ェ ア(Ver.3.5,FOSS
NIRSystems社,USA)を用いて二次微分処理(微分条件:
セグメント 20,ギャップ 0)を施し検量線作成に供した。
4. 検量線の作成と評価
検量線作成用にはトウモロコシ穀実 8 点,ソルガム穀 実 12 点,エンバク穀実 1 点,コムギ穀実 1 点,ハトム ギ穀実 1 点,ソバ穀実 2 点,ごま穀実 2 点,ダイズ穀実 5 点,飼料用籾米 4 点,飼料用玄米 5 点,黒もち玄米 1 点,食用精米 5 点,圧ぺんトウモロコシ 3 点,圧ぺん大 麦 3 点,大豆粕 3 点,ナタネ粕 2 点,小麦ふすま 1 点,
大麦ふすま 1 点,米ぬか 2 点,ビートパルプ 1 点,合計 63 点を供した。検量線評価用にはトウモロコシ穀実 2 点,
ソルガム穀実 2 点,エンバク穀実 1 点,コムギ穀実 1 点,
ハトムギ穀実 1 点,ソバ穀実 1 点,ごま穀実 1 点,ダイ ズ穀実 2 点,飼料用籾米 1 点,飼料用玄米 1 点,黒もち 玄米 1 点,食用精米 1 点,圧ぺんトウモロコシ 1 点,圧 ぺん大麦 1 点,大豆粕 2 点,ナタネ粕 1 点,小麦ふすま 1 点,大麦ふすま 1 点,米ぬか 1 点,ビートパルプ 1 点,
合計 25 点を供した。二次微分スペクトルの吸光度と化 学分析値に基づいて,重回帰分析(MLR)法によりソ フトウェアの自動選択で第 4 波長まで使用した複数の検 量線,および部分最小二乗(PLS)回帰分析法により因 子数を 3 ~ 20 として複数の検量線を作成した。そして,
検量線作成時の決定係数(R2c)と標準誤差(SEC),検 量線評価時の決定係数(R2v)と標準誤差(SEP)を求 めた。最適な検量線にはSEPが最も小さいものを採用 した。検量線の推定精度は検量線作成時の標準偏差と検 量線評価時の標準誤差の比(RPD)値(検量線評価群の 標準偏差(SD)÷SEP)13)で評価した。
結果および考察
供試した濃厚飼料の化学分析値は乾物率 87.4–92.5%,
CP含 量 7.3–51.4 %,CPu含 量 19.8–78.6 %,CPs含 量 6.4–64.0 %,CPb含 量 1.4–27.6 %,EE含 量 0.6–53.7 %,
ADFom含量 0.4–30.4%,aNDFom含量 5.0–41.4%および 澱粉含量 0.5–76.5%であった(表 1)。表 2 には検量線作 成用サンプル群と検量線評価用サンプル群の化学分析値 を示した。
1. 乾物率
MLR分 析 で 求 め た 乾 物 率 のR2v値,SEP値 お よ び RPD値 は,0.84,1.18 % お よ び 2.5 で あ っ た( 表 3)。
MLR分析で選択した第一波長の吸収は 1954nmであり,
これは水の結合音(1930–1940nm)に帰属すると考えら れた3)。PLS回帰分析では 400–2500nmの全波長を用い るよりも可視光域を除いた 1100–2500nmの波長域を用 いた方が検量線の精度は高くなった。PLS回帰分析で求
めた乾物率のR2v値,SEP値およびRPD値は,0.86,1.11%
および 2.7 であった(表 4)。PLS回帰分析で作成した 検量線は 2.4 <RPD< 3.0 であるため,準実用的な精度 で推定できる可能性があると判定された(図 1)。なお,
濃厚飼料の乾物率に関しては既報4,14)においても本試験 と同等な精度の検量線が作成されている。
試料名 n DM(%) CP(%) CPu(%) CPs(%) CPb(%) EE(%) ADFom
(%) aNDFom
(%) 澱粉(%)
トウモロコシ穀実 10 89.7±0.6 9.4±0.8 66.6±3.0 19.8±2.1 4.7±1.7 4.3±0.4 3.7±0.3 13.1±1.2 65.7±3.2 ソルガム穀実 14 92.1±1.3 13.4±2.7 69.8±5.1 16.9±2.4 17.5±2.9 3.5±0.6 9.3±4.5 20.9±8.5 62.1±10.4 エンバク穀実 2 91.3±0.7 16.6±2.1 49.3±2.8 32.1±2.0 5.9±1.4 6.4±0.4 2.4±0.4 19.2±3.2 57.5±1.4 コムギ穀実 2 92.2±0.2 14.7±0.4 26.8±3.3 32.7±3.4 2.1±0.2 1.8±0.2 3.8±0.8 26.1±3.9 63.2±2.7 ハトムギ穀実 2 90.0±0.1 13.4±0.1 71.4±5.2 14.4±4.6 26.3±1.8 4.8±0.7 30.1±0.5 41.4±1.6 35.8±2.1 ソバ穀実 3 89.8±0.2 14.6±0.7 36.3±2.6 50.9±4.7 9.6±0.9 2.2±0.2 18.5±1.6 21.8±0.7 55.9±4.6 ごま穀実 3 99.3±0.2 24.7±0.7 23.0±2.8 14.1±0.9 3.6±1.4 53.7±3.9 22.7±1.8 32.8±5.6 1.6±0.2 ダイズ穀実 7 93.3±0.4 43.6±2.3 31.0±3.6 54.6±5.1 3.9±1.5 19.2±0.7 13.5±1.1 18.8±2.8 0.5±0.2 飼料用籾米 5 88.2±0.7 7.8±0.5 66.1±1.5 13.6±2.6 11.0±2.3 2.1±0.2 12.4±1.0 20.9±2.8 61.2±1.4 飼料用玄米 6 87.4±1.0 8.6±0.6 61.4±5.6 15.2±5.4 8.9±0.7 2.5±0.4 2.1±0.5 9.8±4.0 73.6±3.0 黒もち玄米 2 88.6±1.3 9.1±0.0 66.9±2.8 17.9±5.9 9.1±1.9 3.3±0.1 2.1±0.2 16.0±2.6 70.2±1.2 食用精米 6 87.2±1.0 7.3±0.4 63.2±2.9 16.6±4.6 6.8±1.1 0.6±0.1 0.6±0.1 5.0±1.4 76.5±3.0 圧ぺんトウモロコシ 4 89.0±1.3 9.2±0.4 66.0±1.3 10.8±1.9 12.6±3.4 3.9±0.2 4.0±0.5 13.2±2.4 64.8±7.3 圧ぺん大麦 4 90.9±1.4 12.5±0.8 35.1±4.6 13.0±2.1 12.6±2.0 2.5±0.3 6.0±2.4 28.5±4.3 54.1±3.9 大豆粕 5 91.1±2.4 51.4±0.4 33.7±3.0 16.5±3.4 2.5±0.5 2.5±0.6 8.0±1.1 13.4±3.0 1.4±0.6 ナタネ粕 3 90.8±2.8 43.5±6.6 31.6±8.9 38.7±24.1 6.3±0.3 6.2±5.8 24.0±3.3 32.0±5.7 0.9±0.9 小麦ふすま 2 93.3±4.9 19.2±1.7 36.3±1.0 32.9±6.4 3.1±0.3 3.6±2.4 15.3±0.1 48.2±0.4 11.2±0.2 大麦ふすま 2 92.0±1.2 17.2±1.4 35.6±4.9 35.6±2.7 5.0±0.7 4.2±0.4 12.0±3.1 38.1±13.0 16.3±2.4 米ぬか 3 90.4±1.0 17.1±0.6 56.4±0.6 37.0±5.3 5.0±0.6 21.8±1.0 16.5±2.5 32.3±2.6 9.6±1.6 ビートパルプ 2 92.5±0.0 8.5±0.8 46.2±0.9 12.5±2.3 10.6±0.7 0.7±0.0 24.1±0.0 48.6±0.7 0.9±0.5
DM:乾物率(原物中),CP:粗タンパク質(乾物中),CPu:非分解性タンパク質(CP中),CPs:溶解性タンパク質(CP中),
CPb:結合性タンパク質(CP中),EE:粗脂肪(乾物中),ADFom:酸性デタージェント繊維(乾物中),
aNDFom:中性デタージェント繊維(乾物中),澱粉(乾物中).数値は平均値 ± 標準偏差.
表1. 供試した濃厚飼料の飼料成分
分析項目1 検量線作成用 検量線評価用
n 最小値 最大値 平均値 標準偏差 n 最小値 最大値 平均値 標準偏差
DM(%FM) 63 85.6 99.2 90.6 2.7 24 86.9 99.5 91.2 3.0
CP(%DM) 63 7.0 51.6 17.1 13.2 24 6.9 51.8 20.2 15.0
CPu(%CP) 63 24.4 78.6 54.9 16.5 24 19.8 75.0 47.9 17.2
CPs(%CP) 63 6.4 64.0 22.7 13.8 23 6.5 55.9 23.4 13.4
CPb(%CP) 63 1.4 27.6 9.4 5.9 24 2.2 25.0 7.9 5.7
EE(%DM) 63 0.6 56.9 6.7 10.6 24 0.6 49.4 7.1 10.8
ADFom(%DM) 63 0.4 29.8 9.3 7.5 24 0.4 30.4 10.7 8.1
aNDFom(%DM) 63 2.5 48.5 20.0 11.0 24 4.9 49.1 23.1 12.1
澱粉(%DM) 63 0.2 78.8 48.1 28.8 24 0.0 75.4 37.7 29.8
1表 1 参照.
表2. 検量線作成用および検量線評価用に用いた濃厚飼料の飼料成分
2. 粗タンパク質
本試験では,MLR分析で求めたCP含量のR2v値,
SEP値 お よ びRPD値 は,0.98,2.10 % お よ び 7.1 で あった(表 3)。MLR分析で選択した第一波長の吸収は 2194nmであり,これはCP由来の第 1 級アミド(-CONH2) 結合音(2140–2170nm)3)に帰属すると考えられた。一 方,PLS回帰分析で求めたCP含量のR2v値,SEP値お よびRPD値は,0.99,1.63%および 9.2 であった(表 4)。
PLS回帰分析で作成した検量線は 8.1 <RPDであるた め,化学分析相当で極めて高い精度で推定できる可能性 があると判定された(図 1)。
3. タンパク質画分
(1)溶解性タンパク質(CPs)
ダイズ穀実 1 点が検量線から大きく外れるため除いて 試験した。MLR分析で求めたCPs含量のR2v値,SEP 値およびRPD値は,0.34,11.08%および 1.2 であった
(表 3)。粗飼料のCPsのMLR分析では,第一波長と してイネWCSでは 2190nmが選択されており6),これ はCP由来の-CONH2結合音(2140–2170nm)3)に帰属 していると考えられた。同様に,イネ科牧草サイレー ジでは-CONH2第 1 倍音(1600–1620nm)3)に帰属する 1622nmが15),イネ科牧草乾草ではメチレン(-CH2)結
分析項目1 検量線作成用 検量線評価用
RPD8,9 選択波長(nm) SEC2 R2c3 SEP4 R2v5 バイアス6 スロープ7
DM(%FM) 1954, 2186, 1984, 692 0.55 0.96 1.18 0.84 -0.22 1.06 2.5
CP(%DM) 2194, 1736, 1964, 2376 1.56 0.99 2.10 0.98 0.07 0.95 7.1
CPu(%CP) 1996, 434, 2340, 1892 7.60 0.80 9.92 0.71 -4.10 0.97 1.8
CPs(%CP) 2130, 742, 2364, 968 9.33 0.58 11.08 0.34 0.30 0.72 1.2
CPb(%CP) 1908, 1830, 2372, 1340 3.70 0.63 3.78 0.65 -1.66 0.98 1.5
EE(%DM) 1724, 2302, 1042, 490 1.15 0.99 1.25 0.99 -0.26 1.02 8.6
ADFom(%DM) 1002, 1414, 2210, 2340 2.67 0.88 3.69 0.78 -0.25 1.02 2.2
aNDFom(%DM) 1754, 554, 2340, 2194 3.78 0.89 2.97 0.94 0.65 1.06 4.1
澱粉(%DM) 1776, 2196, 1156, 1228 4.35 0.98 5.56 0.96 -0.33 0.99 5.4
1表 1 参照.
2検量線が示した標準誤差.
3検量線作成時の決定係数.
4検量線評価時における標準誤差.
5検量線評価時の決定係数.
6化学分析値と近赤外分光分析推定値を1次式で表した時の切片.
7化学分析値と近赤外分光分析推定値を1次式で表した時の勾配.
8検量線作成時の標準偏差と検量線評価時の標準誤差の比.
9RPD<2.3:精度は非常に低い.2.4<RPD<3.0:準実用的な精度で推定できる可能性あり.3.1<RPD<4.9:実用的で高い精度で推定で
きる可能性あり. 5.0<RPD<6.4:実用的で非常に高い精度で推定できる可能性あり. 6.5<RPD<8.0: 実用的で極めて高い精度で推定 できる可能性あり.8.1<RPD:化学分析相当で極めて高い精度で推定できる可能あり.
表3. 濃厚飼料の飼料成分の重回帰分析結果
分析項目1 検量線作成用 検量線評価用
RPD8,9 因子 SEC2 R2c3 SEP4 R2v5 バイアス6 スロープ7
DM(%FM) 10 0.54 0.97 1.11 0.86 -0.28 1.04 2.7
CP(%DM) 11 0.70 1.00 1.63 0.99 -0.56 0.95 9.2
CPu(%CP) 15 5.33 0.92 5.89 0.88 0.71 0.95 2.9
CPs(%CP) 15 3.13 0.96 5.69 0.83 0.68 1.05 2.4
CPb(%CP) 15 2.10 0.90 2.79 0.78 -0.58 0.88 2.0
EE(%DM) 8 0.56 1.00 1.23 1.00 -0.03 1.00 8.7
ADFom(%DM) 9 2.19 0.93 2.89 0.87 0.11 1.00 2.8
aNDFom(%DM) 10 2.94 0.94 4.46 0.87 1.07 0.93 2.7
澱粉(%DM) 10 3.64 0.99 7.14 0.94 -0.85 0.96 4.2
1–9表 1 および表 3 参照.
表4. 濃厚飼料の飼料成分のPLS回帰分析結果
合 音(2320–2330nm)3)に 帰 属 す る 2332nmが15), ト ウモロコシサイレージではメチル(-CH3)第 1 倍音
(1770–1785nm)3)に帰属する 1796nmが15),また,ア ルファルファでは-CH2第 2 倍音(1200–1210nm)3)に 帰属する 1262nmが15),それぞれ選択されている。本試 験では 2130nmが第一波長に選択されたが,これはイネ WCSの場合と同様にCP由来の-CONH2結合音(2140–
2170nm)3)に帰属していると考えられた。PLS回帰分析 では,二次微分の前に標準正規確率変量(SNV)処理を することで検量線の精度はより高まった。PLS回帰分析
で求めたCPs含量のR2v値,SEP値およびRPD値は,0.83,
5.69%および 2.4 であった(表 3)。PLS回帰分析で作成 した検量線は 2.4 <RPD< 3.0 であるため,準実用的な 精度で推定できる可能性があると判定された(図 1)。
(2)非分解性タンパク質(CPu)
MLR分 析 で 求 め たCPu含 量 のR2v値,SEP値 お よ びRPD値は,0.71,9.92%および 1.8 であった(表 3)。
粗飼料のCPuのMLR分析において,第一波長として イネ科牧草サイレージでは 2170nm,イネ科牧草乾草 では 2162nmが選択されており15),これらはCP由来 図1. 濃厚飼料の近赤外分光分析推定値と化学分析値との相関図
1–4 表1および表3参照 85
90 95 100
85 90 95 100
近赤外分光分析推定値
化学分析値(乾物,%FM) PLSR2v=0.861
SEP=1.112 RPD=2.73
0 10 20 30 40 50 60
0 10 20 30 40 50 60
近赤外分光分析推定値
化学分析値(CP4,%DM) PLSR2v=0.99
SEP=1.63 RPD=9.2
0 10 20 30 40 50 60
0 10 20 30 40 50 60
近赤外分光分析推定値
化学分析値(EE,%DM) PLSR2v=1.00
SEP=1.23 RPD=8.7
0 20 40 60 80
0 20 40 60 80
近赤外分光分析推定値
化学分析値(澱粉,%DM) MLRR2v=0.96
SEP=5.56 RPD=5.4
0 10 20 30 40 50 60
0 10 20 30 40 50 60
近赤外分光分析推定値
化学分析値(aNDFom,%DM) MLRR2v=0.94
SEP=2.97 RPD=4.1 0
5 10 15 20 25 30
0 5 10 15 20 25 30
近赤外分光分析推定値
化学分析値(CPb,%CP) PLSR2v=0.78
SEP=2.79 RPD=2.0
0 20 40 60 80
0 20 40 60 80
近赤外分光分析推定値
化学分析値(CPs,%CP) PLSR2v=0.83
SEP=5.69 RPD=2.4
0 5 10 15 20 25 30
0 5 10 15 20 25 30
近赤外分光分析推定値
化学分析値(ADFom,%DM) PLSR2v=0.87
SEP=2.89 RPD=2.8 0
20 40 60 80
0 20 40 60 80
近赤外分光分析推定値
化学分析値(CPu,%CP) PLSR2v=0.88
SEP=5.89 RPD=2.9
の-CONH2結 合 音(2140–2170nm)3)に 帰 属 し て い る と考えられた。同様に,トウモロコシサイレージでは -CH3第 1 倍音(1710–1730nm)3)に帰属する 1740nmが 選択された。本試験では 1996nmが第一波長に選択さ れ,これはCP由来の第 2 級アミド(-CONH-)結合音
(1990–2010nm)3)に帰属していると考えられた。PLS 回帰分析では全波長を用いるよりも可視光域を除いた 1100–2500nmの波長域を用いた方が検量線の精度は高く なった。PLS回帰分析で求めたCPu含量のR2v値,SEP 値およびRPD値は,0.88,5.89%および 2.9 であった(表 4)。PLS回帰分析で作成した検量線は 2.4 <RPD< 3.0 であるため,準実用的な精度で推定できる可能性がある と判定された(図 1)。
(3)結合性タンパク質(CPb)
MLR分析で求めたCPb含量のR2v値,SEP値および RPD値は,0.65,3.78%および 1.5 であった(表 3)。粗 飼料のCPbのMLR分析において,第一波長としてイ ネWCSでは 1982nmが選択されており6),これはCP 由来の第 1 級アミン(-NH2)結合音(1970–2010nm)3)
に帰属していると考えられた。同様に,イネ科牧草 サ イ レ ー ジ で は-CONH2結 合 音(2140–2170nm)3)に 帰属する 2118nmが15),トウモロコシサイレージでは -CONH2第 1 倍音(1510–1530nm)3)に帰属する 1516nm が15),イネ科牧草乾草とアルファルファではそれぞれ -CH2第 2 倍 音(1200–1210nm)3)に 帰 属 す る 1218nm,
1236nmが選択されている15)。本試験では 1908nmが第 一波長に選択され,これはCP由来の-CONH-第 2 倍 音(1910–1930nm)3)に 帰 属 し て い る と 考 え ら れ た。
PLS回帰分析は全波長を用いるよりも可視光域を除いた 1100–2500nmの波長域を用いた方が検量線の精度は高く なった。PLS回帰分析で求めたCPb含量のR2v値,SEP 値およびRPD値は,0.78,2.79%および 2.0 であった(表 4)。RPD< 2.3 であるためCPb含量は実用的な分析精 度で推定することは困難であると判定された(図 1)。
4. 粗脂肪
MLR分析で求めたEE含量のR2v値,SEP値および RPD値 は,0.99,1.25 % お よ び 8.6 で あ っ た( 表 3)。
MLR分析では第一波長に 1724nmを選択しており,こ れはEE由来の-CH2の第 1 倍音(1735–1750nm)3)に 帰属すると考えられた。一方,PLS回帰分析で求めた EE含量のR2v値,SEP値およびRPD値は,1.00,1.23%
および 8.7 であった(表 4)。MLR分析およびPLS回帰 分析で作成した検量線はともに 8.1 <RPDであるため,
化学分析相当で極めて高い精度で推定できる可能性があ
ると判定された(図 1)。
5. ADFom
MLR分析で求めたADFom含量のR2v値,SEP値およ びRPD値は,0.78,3.69%および 2.2 であった(表 3)。
甘利ら1)は牧草を用いたADFのMLR分析では第一波 長に 2281nmを選択しており,セルロースの吸収に由来 することを明らかにした。本試験では 1004nmが第一波 長に選択され,これは既報1)と同様にセルロースの吸収 を由来としており,-CH3の結合音(1010–1020nm)3)に 帰属していると考えられた。一方,PLS回帰分析で求め たADFom含量のR2v値,SEP値およびRPD値は,0.87,
2.89%および 2.8 であった(表 4)。PLS回帰分析で作成 した検量線は 2.4 <RPD< 3.0 であるため,準実用的な 精度で推定できる可能性があると判定された(図 1)。
6.aNDFom
MLR分析で求めたaNDFom含量のR2v値,SEP値お よびRPD値は,0.96,2.97%および 4.1 であった(表 3)。MLR分析では第一波長に 1754nmを選択してお り,これはセルロース由来のメチン(-CH)の第 1 倍 音(1755–1775nm)3)に帰属すると考えられた。一方,
PLS回帰分析で求めたaNDF含量のR2v値,SEP値およ びRPD値は,0.87,4.46%および 2.7 であった(表 4)。
MLR分析で作成した検量線は 3.1 <RPD< 4.9 である ため,実用的で高い精度で推定できる可能性があると判 定された(図 1)。
7. 澱粉
MLR分 析 で 求 め た 澱 粉 含 量 のR2v値,SEP値 お よ びRPD値は,0.96,5.56%および 5.4 であった(表 3)。
MLR分析では第一波長に 1776nmを選択しており,こ れは澱粉由来の-CHの第 1 倍音(1755–1775nm)3)に帰 属すると考えられた。一方,PLS回帰分析で求めた澱粉 含量のR2v値,SEP値およびRPD値は,0.94,7.14%お よび 4.2 であった(表 4)。MLR分析で作成した検量線 は 5.0 <RPD< 6.4 であるため,実用的で非常に高い精 度で推定できる可能性があると判定された(図 1)。
8. 今後の課題
本試験ではいずれの飼料成分においても成分レンジが 広かったのでR2v値とRPD値は高い値を示したが,各 飼料種のSEP値は日本標準飼料成分表9)で示されてい るSD値と比較して高いため,必ずしも作成した検量線 が高い精度を持つとはいい難い。今後,複数の試料数を