IEICE TRANS. INF. & SYST., VOL.E102–D, NO.9 SEPTEMBER 2019
1683
LETTER
Special Section on Log Data Usage Technology and Office Information SystemsA Cross-Platform Study on Emerging Malicious Programs Targeting IoT Devices
Tao BAN†a),Nonmember, Ryoichi ISAWA†,Member, Shin-Ying HUANG††,Nonmember, Katsunari YOSHIOKA†,†††,andDaisuke INOUE†,Members
SUMMARY Along with the proliferation of IoT (Internet of Things) devices, cyberattacks towards them are on the rise. In this paper, aim- ing at efficient precaution and mitigation of emerging IoT cyberthreats, we present a multimodal study on applying machine learning methods to char- acterize malicious programs which target multiple IoT platforms. Experi- ments show that opcode sequences obtained from static analysis and API sequences obtained by dynamic analysis provide sufficient discriminant in- formation such that IoT malware can be classified with near optimal accu- racy. Automated and accelerated identification and mitigation of new IoT cyberthreats can be enabled based on the findings reported in this study.
key words: IoT security, IoT malware, malware analysis, malware classi- fication
1. Introduction
Aiming at infecting IoT devices across different CPU archi- tectures, IoT malware is usually compiled on and launched against multiple platforms. This poses new challenges to the mitigation and prevention of these emerging cyberthreats. In this paper, we present a new approach to capture, analyze, and classify malicious programs across multiple IoT plat- forms.
To collect the most recent IoT malware targeting differ- ent IoT devices, we deploy the IoTPOT[1]in our environ- ment. IoTPOT constitutes virtualized cross-platform Linux systems deliberately set up with vulnerabilities that invites penetration. It records all information related to the penetra- tion by collecting the malicious programs, command traces, and Internet communications during the attack. Then, based on these evidences, we perform the following multilateral analysis of the malicious programs across three major CPU architectures, namely, ARM, MIPS, and MIPSEL.
In the first step, we use an entropy-based method to identify obfuscated malware samples from non-packed ones. Then, static and dynamic analyses are employed for profiling the behavioral characteristics of the samples: For static analysis, IDA Pro (a Linux-hosted multiprocessor dis- assembler) is applied to the samples to attain their assembly
Manuscript received November 12, 2018.
Manuscript revised April 8, 2019.
Manuscript publicized June 21, 2019.
†The authors are with the National Institute of Information and Communications Technology, Koganei-shi, 184–8795 Japan.
††The author is with the Institute for Information Industry, Taipei, Taiwan.
†††The author is with Yokohama National University, Yokohama- shi, 240–8501 Japan.
a) E-mail: [email protected]
DOI: 10.1587/transinf.2018OFL0007
Table 1 IoT malware dataset overview.
ISA Sample size Bashlight Mirai Tsunami
ARM 729 619 94 16
MIPS 980 657 310 13
MIPSEL 868 648 210 10
code and store it in the form of opcode sequences. For dy- namic analysis, Application Programming Interface (API) call sequences are collected with thestracecommand at run- time in virtualized environments.
To yield numerical vectors that could serve as inputs to the analytical tools, the sequences in log files are coded asn- grams—a contiguous sequence ofnitems from the instruc- tion sequence[2]. Then, vectorized representations of the malware programs are examined byt-distributed Stochastic Neighbor Embedding (t-SNE)[3], which provides a visual hint on the interpretability of different analysis methods. Fi- nally, pattern classification is applied to the vector represen- tation of the malicious programs for quantitative evaluation.
1.1 Data
We use the same dataset introduced in[4]for the analysis. It consists of 9,085 IoT malware samples collected from July 8, 2017 to January 20, 2018 using IoTPOT. To label them, the SHA 256 hash values of malware samples are submit- ted to VirusTotal, where they are checked against more than 60 different virus scanners. Then, the label of a sample is determined by majority voting. We confined the analysis to the three major malware types in the dataset, i.e., Bash- lite, Mirai, and Tsunami, which consist of 2,577 samples.
Table 1 shows the distribution of malware among different Instruction Set Architectures (ISA) and malware categories.
A sample is excluded from the analysis if its API/opcode sequence is shorter than 10, indicating highly possibility of a cracked file. This makes the dataset slightly smaller than that in[4].
2. Analysis
2.1 Preprocessing
Packing is among the most popular obfuscation techniques to impede virus scanners from effectively detecting mal- ware. To confirm whether a malware program is packed or not, we employ entropy analysis proposed by Lyda et al.[5]
Copyright c2019 The Institute of Electronics, Information and Communication Engineers
1684
IEICE TRANS. INF. & SYST., VOL.E102–D, NO.9 SEPTEMBER 2019
to the collected corpus. The analysis is based on the fact that the entropy of a binary program, measured upon the distribution of bytes, tends to be significantly raised by the crypto-encoding process during packing. To measure the entropy of a binary program, it is first divided into succes- sive blocks of fixed size with the entropy of a blockskcal- culated as
H(sk)=− 255
i=0
p(i) log2(p(i)), (1) where p(i) is the probability of byte valueiappeared insk. Given predefined threshold valuesθaveandθmax, a binary is determined to be packed if its averaged entropy score,Have, and the maximum score among all blocks,Hmax, satisfy
Have> θave∧Hmax> θmax. (2)
In the experiment, we set θave = 6.0 and θmax = 6.796618, based on our previous experience on Windows malware analysis. Entropy analysis reveals that only a small portion of the IoT malware samples (less than 3%) appear to be packed. Packed samples are excluded from the analysis due to the lack of static analysis tools against them.
2.2 Feature Engineering
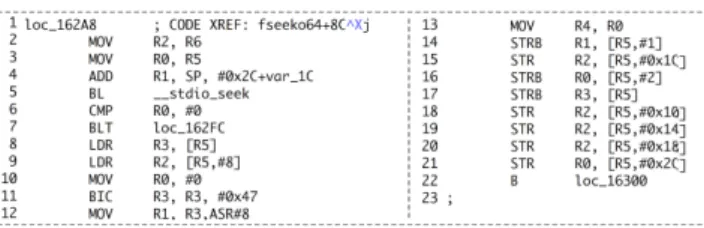
For the non-packed samples, feature engineering is pur- sued in the following steps. First, IDA Pro, a Linux-hosted multi-processor disassembler, is applied to the samples to attain their assembly code. In the snapshot of ARM as- sembly code shown in Fig. 1, each line contains an opcode (MOV, ADD, BL, etc.) and the operands they act on. In the second step, we extract the sequence of opcode which carries the most essential information of malware behavior.
For the snapshot in Fig. 1, we obtain an opcode sequence like {MOV MOV ADD BL CMP BLT ...}. Finally, follow- ing the n-gram convention, we code each of the log files as a list ofn-grams. The 3-gram representation of the op- code sequence ion Fig. 1 is{[MOV MOV ADD], [MOV ADD BL], [ADD BL CMP], [BL CMP BLT] ...}. Following the same procedure, we also generate API features for each malicious program from the API-call trace logged by the stracecommand during its execution in a virtualized sand- box. Compared with the Vector Space Model approach adopted in[4], then-gram representation preserves the order information in the sequence and thus may lead to superior generalization performance.
Fig. 1 Assembly code output by IDA Pro on ARM.
In then-gram representation, each sample is coded as a list ofn-grams, which tends to reside in very high dimen- sional features space. Quite often, the extraordinary high dimension of the data prevents the adoption of common al- gorithms for the analysis. Moreover, the Euclidean distance in such a high-dimensional space is likely to suffer from de- teriorated representability in certain situations. To circum- vent this problem, we propose to use the Jaccard distance[6]
to measure the dissimilarity between the list of sequences.
More specifically, Jaccard distance, which measures dissim- ilarity between two finite item sets Xi andXj, can be ob- tained by dividing the difference of the sizes of the union and the intersection of two sets by the size of the union,
dJ(Xi,Xj)= |Xi∪Xj| − |Xi∩Xj|
|Xi∪Xj| . (3)
With this distance function defined upon then-gram repre- sentation of the opcode/API traces, the distance-based anal- ysis described in the following sections are applied.
2.3 Visualization
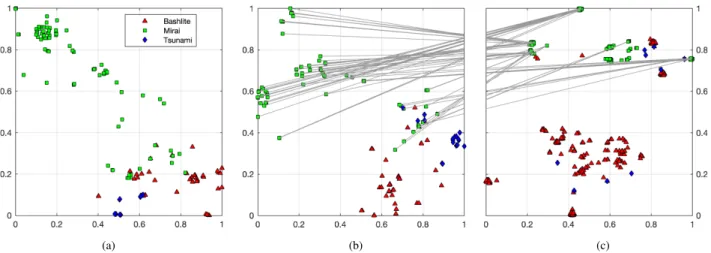
To visualize the sample distribution of a particular ISA, the N×Ndistance matrix, whereN is the number of malware samples under analysis, is mapped to 2-D points using t- SNE[3].t-SNE implements the mapping in such a way that similar samples are modeled by nearby points and dissimi- lar samples are modeled by distant points with high proba- bility. Figure 2 (a) shows the layout of malware samples on MIPS using opcode feature. Samples from different mal- ware classes are shown with different markers. Samples from the same category forms clusters because inter-class distances are closer than intra-class distances. The separa- bility of samples from different categories in this 2D space suggests that then-gram features carries essential informa- tion for classifying the malware samples.
Figures 2 (b) and (c) shows the layout of malware sam- ples on ARM using opcode features and API features, re- spectively. A gray line between Figs. 2 (b) and (c) connects two points that correspond to the same Mirai sample. This comparison reveals that in the API feature space, the classes interlace with each other more than in the opcode feature space, which may lead to degenerated performance in clas- sification.
2.4 Classification
Using the same features, we build classifiers that can pre- dict the classes of new malware samples. Two classifiers, namely, SVM[7]andkNearest Neighbor (kNN)[8]are cho- sen for their good generality and generalization ability. The results using opcode features and API features are reported in Table 2, where the micro averages over 10 runs are shown.
For each run, we use 70% of data for training and the rest of the data for testing.
As can be seen from the table, with the Jaccard dis- tance, both SVM andkNN give nearly optimal results on all
LETTER
1685
Fig. 2 2-d visualization usingt-SNE. (a) Opcode features on MIPS; (b) Opcode features on ARM;
(c) API features on ARM.
Table 2 IoT malware classification result (micro-average).
ISA Feature Classi- Accura- Precision Recall FPR AUC G-mean F1-mea-
Set fier cy(%) (%) (%) (%) (%) sure(%)
ARM API SVM 98.90 98.92 98.90 5.68 0.9661 96.53 98.85
kNN 99.31 99.36 99.31 0.90 0.9920 99.17 99.27
Opcode SVM 100.00 100.00 100.00 0.00 1.0000 100.00 100.00
kNN 99.58 99.59 99.58 1.14 0.9922 99.18 99.52
MIPS API SVM 99.46 99.54 99.46 0.38 0.9954 99.53 99.47
kNN 99.55 99.51 99.55 0.35 0.9960 99.54 99.50
Opcode SVM 99.73 99.76 99.73 0.21 0.9976 99.76 99.74
kNN 99.66 99.66 99.66 0.50 0.9958 99.56 99.63
MIPSEL API SVM 99.69 99.69 99.69 0.57 0.9956 99.55 99.69
kNN 99.77 99.81 99.77 0.35 0.9971 99.71 99.78
Opcode SVM 99.46 99.47 99.46 0.98 0.9924 99.24 99.46
kNN 99.73 99.73 99.73 0.51 0.9961 99.61 99.72
the examined ISAs with static and dynamic features. This indicates Jaccard distance has a strong potential to measure behavioural similarity between the instruction sequences.
Opcode features outperforms API features on ARM and MIPS, while API features win on MIPS with a small margin.
In particular, on ARM, SVM yields a perfect classification result using opcode features.
3. Conclusion
The experiment results reveal that IoT malware is yet not armed with complicated obfuscating techniques at the cur- rent stage. First, the result of entropy analysis shows that less than 3% of the malware programs use common obfus- cation techniques like packing. Second, near optimal clas- sification rates using opcode and API features indicate that both static analysis and dynamic analysis carry determinis- tic discriminant information about malware category. This further implies that no sophisticated behavior-obfuscation techniques such as reordering API call sequences, injecting bogus API calls, or alternation between semantically equiv- alent API calls are implemented by the malware. For the sake of the ease to perform statistic analysis than dynamic analysis, it might be rational to say that statistic analysis is preferable than dynamic analysis for recent IoT malware.
References
[1] Y.M.P. Pa, S. Suzuki, K. Yoshioka, T. Matsumoto, T. Kasama, and C.
Rossow, “IoTPOT: Analysing the rise of IoT compromises,” WOOT 15, USENIX Association, 2015.
[2] A.Z. Broder, S.C. Glassman, M.S. Manasse, and G. Zweig, “Syntac- tic clustering of the Web,” Computer Networks and ISDN Systems, vol.29, no.8-13, pp.1157–1166, 1997.
[3] L. van der Maaten and G.E. Hinton, “Visualizing high-dimensional data usingt-SNE,” J. Machine Learning Research, vol.9, pp.2579–
2605, 2008.
[4] T. Ban, R. Isawa, K. Yoshioka, and D. Inoue, “A cross-platform study on IoT malware,” 2018 Eleventh International Conference on Mobile Computing and Ubiquitous Networking, 2018.
[5] R. Lyda and J. Hamrock, “Using entropy analysis to find encrypted and packed malware,” IEEE Security Privacy, vol.5, no.2, pp.40–45, 2007.
[6] P.N. Tan, M. Steinbach, and V. Kumar, Introduction to Data Mining, First Edition, Addison-Wesley Longman Publishing Co., Inc., Boston, MA, USA, 2005.
[7] C.-C. Chang and C.-J. Lin, “LIBSVM: A library for support vector machines,” ACM Trans. Intelligent Systems and Technology, vol.2, no.3, Article No.27, 2011.
[8] S.K. Pal and P. Mitra, Pattern Recognition Algorithms for Data Min- ing: Scalability, Knowledge Discovery, and Soft Granular Computing, Chapman and Hall/CRC, New York, 2004.