Left and right cardiac performance in children with small heart syndrome
– Analysis with cardiac MRI –
Kosuke Nishi, Satoshi Marutani, Nori Takada, Kazushi Ueshima, Keisuke Sugimoto, Noboru Inamura
Department of Pediatrics, Kindai University Faculty of Medicine, Osaka, Japan Abstract
Background: It has been reported that children who have orthostatic dysregulation (OD) symptoms are more likely to have a small heart.
A low cardiac output of the left ventricle (LV) is thought to be the cause of the symptoms. Because the right ventricle (RV) has not been evaluated in past reports, we examined the cardiac activity of both ventricles by cardiac MRI (CMR)
Method: We performed CMR in 23 children with small heart syndrome. Next, we divided the subjects into two groups based on the severity of the symptoms of OD The subjects were divided into two groups according to the severity of the OD symptoms (severe group [S-group] and mild group [M-group]) according to the guidelines, and the CMR cardiac parameters were compared.
Results: Both ventricular volumes
were smaller than normal, but the ejection fractions were within normal range. In the comparison of the severity of the OD symptoms, the LV end-diastolic volume, cardiac index, RV stroke volume, and ejection fraction were signifi- cantly smaller in the S group. In a simple logistic regression analysis using the severity of the OD symptoms, the LV end-diastolic volume, cardiac index, and RV ejection fraction were statistically significant variables.
Conclusions: We could evaluate the RV performance in small heart syndrome using CMR.
We found that the RV ejection fraction might contribute to the severity of the OD symptoms.
Key words : Small heart syndrome, Children, MRI, Cardiac performance, Orthostatic dysregulation
Introduction
Small heart syndrome was first reported by Master as neurocirculatory asthenia in young adults 1. This syndrome is characterized by a small heart shadow on the chest X-ray, and is associated with symptoms such as general malaise, fatigue, palpitations, and dyspnea on effort. These symptoms are in common with the symptoms of orthostatic dysregulation (OD) in pediatric patients, and a previous study reported that children with OD were more likely to have small hearts 2. In a study on pa- tients with small heart syndrome, it was reported that a low cardiac output might be the cause of
the symptoms because the patients with severe symptoms have a smaller left ventricular diastolic diameter and lower cardiac index (CI) than the mild and the healthy subjects 3. However, in previous studies, the authors evaluated the cardiac performance in only the left ventricle with echocardiography.
With normal hemodynamics, the left ventricular stroke volume must be equal to the right ventricular stroke volume. We believed that it was essential to evaluate the right ventricular cardiac performance to elucidate the pathophysiology of small heart syndrome, which has been thought to be caused by the severity of the OD symptoms.
Received July 31, 2020; Accepted October 14, 2020 DOI:10.15100/00021269
We often use echocardiography to evaluate the cardiac performance. However, the evaluation of the ventricular volume with echocardiography is presumed on the assumption that the left ventricle has an ellipsoid shape 4. Further, it is difficult to display the same cross section repeatedly in a two-dimensional echocardiogram. For the above reasons, the evaluation of the ventricular volume with echocardiography is considered to be inaccurate 5. Therefore, CMR has been thought to be the one of the most reliable method to evaluate cardiac performance and structural property in children. Further, CMR can also measure the blood volume that passes any vessels. Because of these points, CMR is used as a modality along with cardiac catheterization in the field of congenital heart disease. The objective of this study was to elucidate the pathophysiology of small heart syndrome by evaluating the cardiac performance of both ventricles with CMR.
Methods Subjects
We performed CMR in 23 children with small heart syndrome and set the inclusion criteria for children, as those a) under 18, b) diagnosed with OD, c) with a cardiothoracic ratio (CTR) of ≦42%
on the chest X-ray, and d) without any clinical history of cardiovascular disease. Moreover, it does not matter even if they were treated for OD. We diagnosed the children who were suspected of having OD and who were diagnosed with no anemia, cardiovascular disease, epilepsy, or endocrine disease, as having OD along with the guidelines 6. We performed a new orthostatic test once to determine the subtype:
ⅰ) instantaneous orthostatic hypotension (INOH:
recovery time for median blood pressure (BP) after standing up ≧ 25sec, or that of ≧ 20sec with a ≧ 60 % decrease in median BP at the initial drop), ⅱ) postural orthostatic tachycardia syndrome (POTS:
increases in heart rate (HR) without decreasing blood pressure during standing of ≧ 35bpm or HR
≧ 115bpm), ⅲ) vasovagal syncope (VVS: sudden onset of fainting/near-fainting associated with vasodepression during standing with or without bradycardia), and ⅳ) delayed orthostatic hypoten- sion (systolic arterial pressure reduction of ≥15%
during the later stage of (child type) standing (3–4 min or later after standing) 6. Next, we divided the subjects into two groups based on the severity of the symptoms of OD (severe group [S-group]
lines. The guidelines define “Severe” as a medical condition that interferes with daily life. On the other hand, “Mild” is a medical condition that does not interfere with daily life. We evaluated the median blood pressure and heart rate which were measured three times during the de novo orthostatic testing. The body surface area (BSA) was calculated by the Dubois formula. The obesity index was calculated by Weight -for-Height Charts 7. MRI technique
We performed CMR with a 1.5T magnetic resonance scanner (Philips, Achieva dStream, the Netherlands). After obtaining sagittal, coronal, and axial localizers, SSFP (steady state free precession sequence) cine images were acquired in the vertical and horizontal long axis planes for planning the subsequent stack of at least 12 contiguous slices in the short axis plane covering both ventricles.
The short axis images were obtained from the base to the apex of the heart, with the most basal slice positioned across the plane of the atrioventricular valves. Next, all patients underwent phase-contrast flow quantification, performed with a perpendicular section to the ascending aorta and main pulmonary artery. All images were acquired during end-expiratory breath holds.
MRI analysis
All images were analyzed on a work- station using dedicated software for the cardiac analysis (Phillips, IntelliSpace Portal, Relaease v10.1.1.21740; Phillips, the Netherlands). The end-diastolic and the end-systolic phases were identified, and then the endocardial contours were traced manually by a single observer. The papillary muscles were included in the ventricular volume.
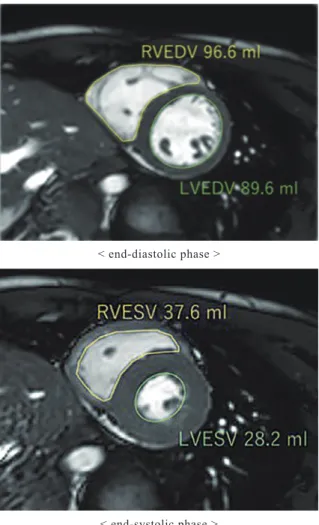
During the end-diastolic and end-systolic phases, we measured the end-diastolic volume (EDV) and end-systolic volume (ESV) of both ventricles by the Simpson method (Figure 1). The ejection fraction (EF) was defined as the EDV-ESV/EDV.
Next, we measured the blood volume through the inferior vena cava (IVC), superior vena cava (SVC), ascending aorta, and main pulmonary artery by phase-contrast flow quantification. The blood volume passing through the ascending aorta and main pulmonary artery was defined as the stroke volume of the left ventricular (LVSV) and right ventricular stroke volume (RVSV). The cardiac output (CO) of each ventricle was calculated as the LVSV×HR. Finally, the blood volume through
both stroke volumes were indexed by dividing by the BSA, and we calculated the IVCi, SVCi, and EDVi, ESVi, SVi of both ventricles and LV-CI.
< end-diastolic phase >
< end-systolic phase >
Statistical analysis
The statistical analyses were performed with EZR software (R version 3.2.2) 8. A probability value of p<0.05 was considered statistically significant. Because we did not evaluate normal subjects, we predicted normal cardiac parameters in each patient using the Buechel’s regression model9) (Table 1). Finally, to investigate relationship between measured values and severity of symptom, we compared cardiac parameters between S and M-group, and performed a simple logistic regression analysis. This study protocol conformed to the ethical guidelines of the 1975 Declaration of Helsinki as reflected in a priori approval by the Ethics Committee of Kindai University Hospital (30-021).
Results
The demographic data of the 23 subjects are shown in Table 2. There were 15 females, which were more than the males. Regarding the physique of the subjects, nineteen were normal, two were obese (Obesity index≧15%), and two were thin (Obesity index≦-15%) 7. The BP of all subjects was within normal range 10. On the other hand, regarding the HR, ranged from 51 to 94, with three subjects under 60. In the subtypes with OD, eleven subjects had POTS, which was most common, and eleven did not fit any subtype. Regarding the severity of the symptoms, the number of patients in the S-group was greater than that in the M-group (S-group 15 vs M-group 8). Eight subjects were under treatment of OD. In POTS percentage of female was higher than male (64% vs 36%), but there was no statistically significant difference between the genders for any items.
The cardiac parameters analyzed with CMR are shown in Table 3. The %Normal of the LV-EDVi was 78.2 ± 16.7 %, the %Normal of the LV-ESVi was 71.9 ± 21.5 %, the %Normal of the LV-CI was 78.9 ± 13.9%, so the left ventricular parameters in the present patients were smaller than the predicted normal values. The %Normal of the RV-EDVi was 78.3 ± 15.6% and the %Normal of the RV-ESVi was 78.1 ± 17.6%, so the right ventricular volumes were smaller than the predicted normal volumes, similar to the left ventricle. For both ventricular EFs, the %Normal of the LV-EF was 106.2 ± 9.7% and the %Normal of the RV-EF was 100.7 ± 7.6%, so both ventricular EFs were within the normal range.
The comparison data of the patient pro- files between the two groups are shown in Table 4.
There were no significant differences among any of the items.
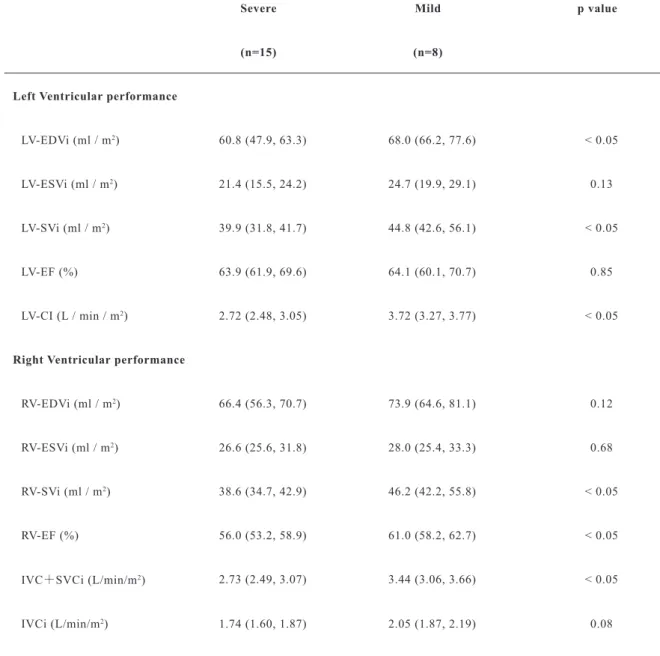
The cardiac parameters between the two groups are shown in Table 5. For the left ventricular performance, the EDVi, SVi, and CI were significantly smaller in the S group. For the right ventricular performance, the SVi, EF, and IVCi+SVCi were significantly smaller in the S group.
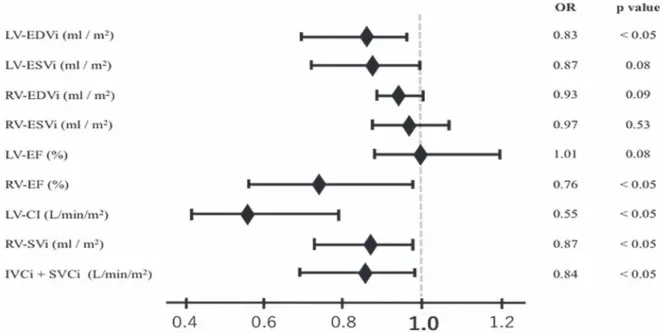
In the simple logistic regression analysis with the severity of the OD symptoms as the objective variable, the LV-EDVi, RV-EF, LV-CI, RV-SVi, and IVCi+SVCi were statistically significant variables (Figure 2).
Figure 1 The images of the measurement of the EDV/ESV
Table 2 Patient profiles Case Sex Age
(year) BMI
(kg / m2) Obesity index(%) BP
(mmHg) HR (bpm) CTR
(%) Subtype of OD Severity of OD in current study Medication
1 M 11 17.9 6.1 100 / 49 82 37 POTS Severe midodrine hydrochloride
2 F 14 23.6 17.1 116 / 68 71 35 ― Severe
3 F 16 18.1 -9.9 105 / 61 68 36 ― Severe
4 M 14 17.9 -7.2 113 / 58 83 39 ― Severe midodrine hydrochloride
5 F 13 22.3 14.1 107 / 52 56 40 POTS Severe
6 F 13 18.6 -5.6 109 / 67 94 36 POTS Severe
7 F 18 17.4 -13.5 110 / 56 60 38 POTS Severe midodrine hydrochloride
8 F 16 19.0 -5.6 107 / 52 66 38 POTS Severe midodrine hydrochloride
9 F 12 21.3 10.5 98 / 48 82 39 ― Severe
10 F 9 15.0 -9.7 88 / 45 58 39 POTS, INOH Severe midodrine hydrochloride
11 F 15 19.8 0.6 99 / 48 73 33 ― Severe
12 F 15 20.5 2.0 98 / 63 66 38 ― Severe midodrine hydrochloride
propranolol hydrochloride
13 F 15 27.9 38.8 102 / 62 87 39 POTS Severe midodrine hydrochloride
propranolol hydrochloride
14 M 14 19.4 -0.5 95 / 60 61 36 POTS Severe
15 M 16 17.5 -13.5 92 / 50 60 38 POTS Severe midodrine hydrochloride
16 F 13 16.7 -17.8 107 / 60 70 38 POTS Mild
17 F 14 18.4 -8.2 103 / 53 60 33 ― Mild
18 M 9 17.2 9.3 105 / 55 68 39 ― Mild
19 M 10 16.7 2.0 103 / 51 64 38 ― Mild
20 F 14 15.5 -22.9 112 / 65 78 37 ― Mild
21 M 14 17.7 -9.7 114 / 49 51 40 INOH Mild
22 F 13 20.5 2.0 106 / 61 75 38 ― Mild
23 M 14 18.4 -7.2 118/53 76 33 POTS, NMS Mild
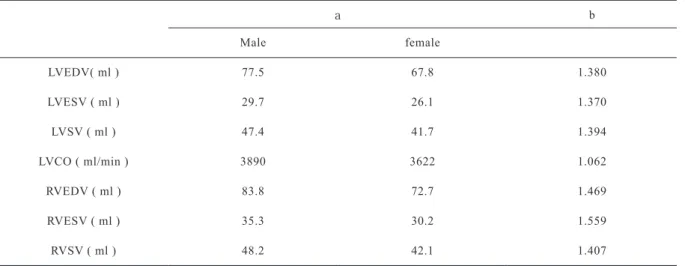
Table 1 Buechel’s regression model
a b
Male female
LVEDV( ml ) 77.5 67.8 1.380
LVESV ( ml ) 29.7 26.1 1.370
LVSV ( ml ) 47.4 41.7 1.394
LVCO ( ml/min ) 3890 3622 1.062
RVEDV ( ml ) 83.8 72.7 1.469
RVESV ( ml ) 35.3 30.2 1.559
RVSV ( ml ) 48.2 42.1 1.407
normal value = a * BSA b
Table 3 Cardiac parameters on CMR and the %Normal(Buechel’s regression model)
current study %Normal
Left Ventricular performance
LV-EDVi (ml / m2) 62.9 ± 14.1 78.2 ± 16.7
LV-ESVi (ml / m2) 22.1 ± 6.9 71.9 ± 21.5
LV-SVi (ml / m2) 41.8 ±10.4 84.4 ± 21.2
LV-EF (%) 65.3 ± 5.9 106.2 ± 9.7
LV-CI (L / min / m2) 3.02 ± 0.55 78.9 ± 13.9
Right Ventricular performance
RV-EDVi (ml / m2) 69.5 ± 14.6 78.3 ± 15.6
RV-ESVi (ml / m2) 29.7 ± 7.9 78.1 ± 17.6
RV-SVi (ml / m2) 43.0 ± 9.6 85.9 ± 20.5
RV-EF (%) 57.4 ± 4.6 100.7 ± 7.6
The data are expressed as the mean±SD.
LV-EDVi: Left ventricular end-diastolic volume index; LV-ESVi: Left ventricular end-systolic volume index
LV-SVi: Left ventricular stroke volume index; LV-EF: Left ventricular ejection fraction; LV-CI: Left ventricular cardiac index RV-EDVi: Right ventricular end-diastolic volume index; RV-ESVi: Right ventricular end-systolic volume index
RV-SVi: Right ventricular stroke volume index; RV-EF: Right ventricular ejection fraction
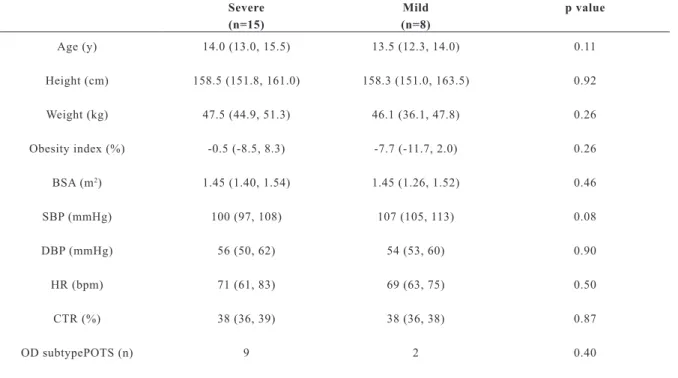
Table 4 Comparison of the patient profiles between the Severe and Mild groups
Severe Mild p value
(n=15) (n=8)
Age (y) 14.0 (13.0, 15.5) 13.5 (12.3, 14.0) 0.11
Height (cm) 158.5 (151.8, 161.0) 158.3 (151.0, 163.5) 0.92
Weight (kg) 47.5 (44.9, 51.3) 46.1 (36.1, 47.8) 0.26
Obesity index (%) -0.5 (-8.5, 8.3) -7.7 (-11.7, 2.0) 0.26
BSA (m2) 1.45 (1.40, 1.54) 1.45 (1.26, 1.52) 0.46
SBP (mmHg) 100 (97, 108) 107 (105, 113) 0.08
DBP (mmHg) 56 (50, 62) 54 (53, 60) 0.90
HR (bpm) 71 (61, 83) 69 (63, 75) 0.50
CTR (%) 38 (36, 39) 38 (36, 38) 0.87
OD subtypePOTS (n) 9 2 0.40
The data are expressed as the median, IQR.
BSA: Body surface area; HR: Heart rate; SBP: Systolic blood pressure; DBP: Diastolic blood pressure CTR: Cardiothoracic ratio; OD: Orthostatic Dysregulation; POTS: postural tachycardia syndrome
Table 5 Comparison of the cardiac parameters between the Severe and Mild groups
Severe Mild p value
(n=15) (n=8)
Left Ventricular performance
LV-EDVi (ml / m2) 60.8 (47.9, 63.3) 68.0 (66.2, 77.6) < 0.05
LV-ESVi (ml / m2) 21.4 (15.5, 24.2) 24.7 (19.9, 29.1) 0.13
LV-SVi (ml / m2) 39.9 (31.8, 41.7) 44.8 (42.6, 56.1) < 0.05
LV-EF (%) 63.9 (61.9, 69.6) 64.1 (60.1, 70.7) 0.85
LV-CI (L / min / m2) 2.72 (2.48, 3.05) 3.72 (3.27, 3.77) < 0.05
Right Ventricular performance
RV-EDVi (ml / m2) 66.4 (56.3, 70.7) 73.9 (64.6, 81.1) 0.12
RV-ESVi (ml / m2) 26.6 (25.6, 31.8) 28.0 (25.4, 33.3) 0.68
RV-SVi (ml / m2) 38.6 (34.7, 42.9) 46.2 (42.2, 55.8) < 0.05
RV-EF (%) 56.0 (53.2, 58.9) 61.0 (58.2, 62.7) < 0.05
IVC+SVCi (L/min/m2) 2.73 (2.49, 3.07) 3.44 (3.06, 3.66) < 0.05
IVCi (L/min/m2) 1.74 (1.60, 1.87) 2.05 (1.87, 2.19) 0.08
The data are expressed as the median, IQR.
LV-EDVi: Left ventricular end-diastolic volume index; LV-ESVi: Left ventricular end-systolic volume index
LV-SVi: Left ventricular stroke volume index; LV-EF: Left ventricular ejection fraction; LV-CI: Left ventricular cardiac index RV-EDVi: Right ventricular end-diastolic volume index; RV-ESVi: Right ventricular end-systolic volume index
RV-SVi: Right ventricular stroke volume index; RV-EF: Right ventricular ejection fraction;
IVCi: Inferior vena cava index; SVCi: Superior vena cava index
Discussion
In the present study, we showed that both ventricular volumes of small heart syndrome patients were smaller than that in the normal control. It was also found that the right ventricular performance might contribute to the severity of the OD symptoms.
Compared with other studies investigating small heart syndrome, this study is unique from the perspective of using CMR. Previous studies that examined the cardiac performance in children with small heart syndrome were only studies us- ing echocardiography. Furthermore, it is difficult to evaluate the right ventricle performance with echocardiography. Therefore, we used CMR, which is known to be useful for evaluating both ventric- ular cardiac performances more accurately and for examining both ventricular cardiac performances in children with small heart syndrome. Buechel et al. examined the normal value of both ven- tricular cardiac performances in healthy children without any cardiovascular disease 9. In the pres- ent study, because we could not evaluate the nor- mal subjects as a control, we estimated the cardiac parameters using the Buechel’s regression model.
Our results were the same as those in the previous studies using echocardiography regarding a lower LV-EDVi, LV-ESVi, LV-SVi, and CI. Also, regard- ing the performance of the right ventricle, to the best of our knowledge, it has never been previous- ly examined in small heart syndrome by indicating small RV-EDVi, RV-ESVi and RV-SVi as well as
Figure 2 Simple logistic regression model of the severity of the OD symptoms
the parameters in the left ventricle. It was revealed that the left and right ventricles of the small heart syndrome patients maintain their cardiac perfor- mance in about 70-80% of normal hearts. From the above results, small heart is a hemodynamic state that easily causes OD symptoms due to a decreased venous return during standing.
In the comparison of the severity of the OD symptoms, the LV-EDVi, LV-SVi, and LV-CI were lower in the S group. On the other hand, in the right ventricle, the EDVi and ESVi did not differ between the 2 groups, but the RV-EF and RV-SVi were lower in the S group (Table 5). Next, a sim- ple logistic regression analysis with the severity of the OD symptoms showed that a low RV-EF might contribute to the severity (Figure 2). It is known that according to the Frank-Starling law, a reduc- tion in the preload to the ventricle decreases the EF
11. As the current study showed, the subjects with severe symptoms tended to have a smaller left ven- tricular volume and cardiac output, and a low car- diac output causes a low venous return. It is con- sidered that the contractility of the right ventricle decreased due to the chronic low venous return and especially in severe patients with the lower venous return, the RV-EF might decrease more. As the rea- son why the left ventricle with severe patients can adapts to the small circulating blood volume while the right ventricle cannot, the difference of myo- cardial characteristics between LV and RV may be involved.
In the subjects in this study, the OD sub- type included more POTS. The venous return was low because of the low cardiac output, and the car- diac performance of the RV was decreased in the small heart syndrome children. When the venous return decreases when standing up, it is difficult for the RV cardiac output to increase by increasing the RV-EF. So, small heart syndrome children try to increase the cardiac output by excessively increas- ing their heart rate, and therefore we assumed that POTS was the result of the excessive compensato- ry response.
We could evaluate the right ventricular performance in small heart syndrome using CMR in the present study. Thereby, we found that a low RV-EF might contribute to the severity of the OD symptoms and pathology of POTS. Vasopressors are often used to relieve the OD symptoms. This therapy may be reasonable in OD children with a normal RV-EF, but may be unreasonable in the small heart syndrome children with a low RV-EF because this medicine increases the afterload to the left ventricle with a low cardiac output. From the results of the present study, we must consider a therapy that will improve the RV-EF.
Limitations
This study was performed by a single cen- ter and a single analyst. Therefore, the intra-ob- servers error cannot be clarified. However, since the software used in this study identifies the end-di- astolic and end-systolic stages, the intra-observers error and inter-observers error are minimized.
Next, the population in this study was small and we could not examine each subtype.
Further, we could not evaluate the cardiac per- formance in normal children with CMR from an ethical point of view. Therefore, we calculated the predictive parameters as normal by using the re- gression model previously reported. In the previ- ous report, they did not distinguish the gender and reported the normal parameters corrected by the BSA. On the other hand, there were more females and thin subjects in the current study. We did not use normal parameters divided by the gender. In that regard, our evaluation method was the same as Buechel’s. Therefore, we could not observe any differences according to the gender. There was no denying that the conclusion may have been slightly differed if we had compared the results according to the gender, however, no significant gender dif-
Disclosures
This study was funded by Sukoyaka Grant for Maternal and Child Health.
References
1. Master CAM (1944) Neurocirculatory asthenia due to small heart. Med Clin N Am; 28: 577-588.
2. Abe T (1990) The small heart syndrome. Asian Med J;
33: 295-302.
3. Miwa K, Fujita M (2011) Is small heart syndrome a
“heart” disease or low output syndrome? Int J Cardiol;
146(1): 95-96.
4. Fukuda S (2014) The measurement of ventricular volume and function. J Med Ultrasonics;41 (2): 143-154.
5. Teichholz LE, Kreulen T, Herman MV (1976) Problems in echocardiographic volume determinations:
echocardiographic-angiographic correlations in the presence of absence of asynergy. Am J Cardiol ;37(1): 7-11.
6. Tanaka H, et al (2015) Japanese clinical guidelines for juvenile orthostatic dysregulation second revised version (Japanese). In: Japanese society of psychosomatic pediatrics;
26-72.
7. Ito Y, Fujieda K (2003) Obesity. Jpn J Pediatr; 66(11):
1913-1919
8. Kanda Y, et al (2013) Investigation of the freely available east-to-use software ‘EZR’ for medical statistics. Bone Marrow Ttansplantation; 45: 452-458.
9. Buechel EV, Kaiser T, Jackson C, Schmitz A, Kellenberger CJ (2009) Normal right and left ventricular volumes and myocardial mass in children measured by steady state free precession cardiovascular magnetic resonance. J Cardiovasc Magn Reson; 11:19.
10. JCS 2018 Guideline on the clinical examinations for decision making of diagnosis and drug therapy in pediatric patients with congenital heart and cardiovascular disorder 2019; 32-34
11. Patterson SW, Piper H, Starling EH (1912) The regulation of the heart beat. J Physiol; 48: 465-513