Characteristic diffusion tensor tractography
in multiple system atrophy with predominant cerebellar ataxia and cortical cerebellar atrophy
Yusuke Fukui, Nozomi Hishikawa, Kota Sato, Yumiko Nakano, Ryuta Morihara, Yasuyuki Ohta, Toru Yamashita, and Koji Abe*
Department of Neurology, Graduate School of Medicine, Dentistry and Pharmaceutical Sciences, Okayama University, 2-5-1 Shikatacho, Kitaku, Okayama 700-8558, Japan
*Corresponding author: Prof. Koji Abe
Department of Neurology, Okayama University Graduate School of Medicine, Dentistry and Pharmacy, 2-5-1 Shikata-cho, Okayama 700-8558, Japan.
Tel.: +81-86-235-7365; Fax: +81-86-235-7368; E-mail: [email protected]
Word count: 3616
Short running title: Differentiation of MSA-C from CCA by tractography.
Keywords: cerebellar ataxia, cortical cerebellar atrophy, diffusion tensor imaging, multiple system atrophy, olivopontocerebellar atrophy, tractography.
Conflict of interest: The authors declare no financial or other conflict of interest.
Abstract
Objective To determine whether diffusion tensor imaging (DTI) tractography analysis is a
potential method for differentiating cerebellar ataxia patients with multiple system atrophy with
predominant cerebellar ataxia (MSA-C) and cortical cerebellar atrophy (CCA).
Methods Forty-one MSA-C patients (62.7 ± 8.1 years old, mean ± SD) and age- and
gender-matched 15 CCA patients (63.0 ± 8.6 years old) were examined. Tractography was
performed using the DTI track module provided in the MedINRIA version 1.9.4, and regions of
interest were drawn manually to reconstruct an efferent fiber tract and two afferent fiber tracts via
the cerebellum.
Results Compared with CCA, MSA-C patients showed significant declines of fractional
anisotropy (FA) values of afferent 1 and 2 (p<0.01 respectively) and a significant increase of the
radial diffusivity (RD) value in afferent 1 (p<0.05). Receiver-operator characteristic curve analysis
showed 85.7% sensitivity and 75.0% specificity of FA values in afferent 1(cutoff value: 0.476).
Linear regressions showed strong correlations between FA value and disease duration in CCA
patients (efferent 1, r=-0.466; afferent 2, r=-0.543; both p<0.05), and between the FA value and
the ratio of the standardized scale for the assessment and rating of ataxia (SARA)/disease duration
in MSA-C patients (afferent 1, r=-0.407; p<0.01).
Conclusion The present DTI tractography newly showed that the FA values of two afferent fiber
tracts showed significant declines in MSA-C patients, and afferent 1 showed good diagnostic
sensitivity and specificity. When combining the FA values of efferent 1 with disease duration, the
present DTI tractography analysis could be useful for differentiating MSA-C and CCA patients.
Introduction
Multiple system atrophy (MSA) is a sporadic and progressive neurodegenerative
disease that clinically manifests cerebellar ataxia, parkinsonism, autonomic failure, and pyramidal
signs in some combinations (1). Multiple system atrophy with predominant cerebellar ataxia
(MSA-C) is the most common subtype of sporadic cerebellar ataxia in Japan (2). The pathological
features of MSA-C are characterized by the accumulation of α-synuclein in glial cells (3), and
degeneration of the afferent pathway (i.e. olivo-cerebellar tract and ponto-cerebellar tract) is
remarkable (4). On the other hand, cortical cerebellar atrophy (CCA) does not belong to MSA, but
is another dominant type of sporadic cerebellar ataxia (5, 6), pathologically characterized by
extensive Purkinje cell loss of the vermis, neuronal loss in the flocculonodular lobe, and
degeneration of the efferent pathway (2, 7, 8).
Diffusion tensor imaging (DTI) is a neuroimaging technique that quantifies the
anisotropy of water diffusion in normal and abnormal brain tissues, and provides evidence of a
damaged white matter tract (9, 10). When DTI is combined with tractography, which estimates
fiber tracts, individual fiber tracts in the living human brain can be visualized in three dimensions
(11). Thus DTI and tractography can detect microstructural abnormalities through alterations in
fractional anisotropy (FA), mean diffusivity (MD) and radial diffusivity (RD) (9, 12). However,
there are only a few reports on DTI and tractography imaging for cerebellar ataxia (9, 13, 14).
In the present study, therefore, we examined DTI and tractography, focusing on the
efferent and afferent pathways in patients with cerebellar ataxia as a potential method for
differentiating MSA-C and CCA.
Patients and Methods Participants
For the present study, we investigated sporadic spinocerebellar ataxia (SCA) in the
outpatient clinic of Okayama University Hospital from November 2009 to March 2014. Among all
outpatients, 41 multiple system atrophy with predominant cerebellar ataxia (MSA-C) patients (21
male and 20 female) and 15 cortical cerebellar atrophy (CCA) patients (7 male and 8 female) were
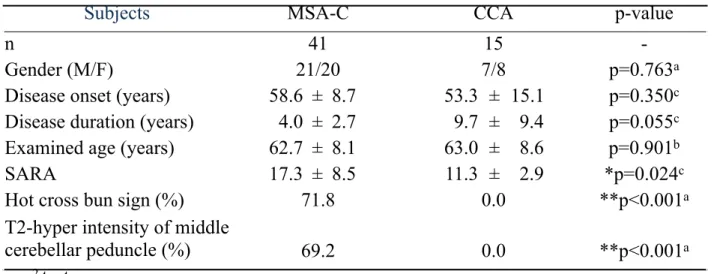
examined for the present analysis. There was no significant difference between the two groups in
terms of disease onset age (MSA-C, 58.6 ± 8.7 years old, mean ± SD; CCA, 53.3 ± 15.1 years old),
disease duration (MSA-C, 4.0 ± 2.7 years; CCA, 9.7 ± 9.4 years), and examined ages (MSA-C,
62.7 ± 8.1 years old; CCA, 63.0 ± 8.6 years old) (Table 1). All patients were assessed by the
standardized scale for the assessment and rating of ataxia (SARA). SARA was higher in MSA-C
patients (17.3 ± 8.5, * p<0.05) than in CCA patients (11.3 ± 2.9).
In MSA-C patients, a hot cross bun sign was evident in the pons in 71.8% of patients and
T2-hyperintensity of the middle cerebellar peduncle in 69.2% of patients, both of which were not
positive in CCA patients (Table 1). The clinical diagnoses of MSA-C were based on the second
consensus statement on the diagnosis of MSA (15). Then, in this study, we enrolled the MSA-C
patients who stared to recognize the disease by cerebellar symptoms, and fulfilled criteria for
probable MSA-C. The CCA diagnoses were based on diagnostic criteria according to Klockgether
(6) are progressive ataxia, age at onset > 20years, no /(sub)acute disease onset, no established
symptomatic cause, and no possible or probable MSA according to the Gilman criteria (15). In the
present study, all CCA patients showed adult onset slowly-progressive cerebellar ataxia without a
family history. All patients were Japanese. The clinical information of patients with MSA-C and
CCA is summarized in Table 1.
Ethical permission for this study was provided by the Ethics Committee on
Epidemiological Studies of the Okayama University Graduate School of Medicine, Dentistry and
Pharmaceutical Sciences (approval #304), and written informed consent was obtained from all
participants prior to enrollment in this study.
MR imaging
Magnetic resonance imaging (MRI) was performed with a 1.5 T MR scanner (Archieva,
Philips, The Netherlands) using an 8-channel receive head coil. According to a previous report
(16), an axial single-shot spin-echo echoplanar imaging sequence was used for DTI. The imaging
parameters were as follows: repetition time/echo time, 8960/71 ms; matrix size, 112 × 112; field of
view, 224 mm; section thickness, 2.5 mm; intersection gap, 0 mm; section number, 60; b value,
1000 s/mm2; motion-probing gradients, 15; flip angle, 90º; number of repetitions for averaging, 2;
total acquisition time, 304 s. In addition to DTI, T1-and T2-weighted images were also obtained to
exclude other neurological disorders.
DTI processing and fiber tracking
Tractography was performed on a stand-alone MacOSX workstation using the DTI
track module provided in the software MedINRIA version 1.9.4 (17). Diffusion tensor was first
estimated (background removal threshold, 600; high smoothing), and regions of interest (ROI)
were then drawn manually to reconstruct an efferent fiber tract and two afferent fiber tracts via the
cerebellum. Because the afferent fiber tracts of MSA-C patients and the efferent fiber tract of CCA
patients are mainly impaired, the ROIs of cerebello-rubro tract (efferent 1) were placed over a red
nucleus and superior cerebellar peduncle bilaterally (Fig. 1A, red). The ROIs of olivo-cerebellar
tract (afferent 1) were placed on the inferior olivary nucleus and cerebellar cortex bilaterally (Fig.
1A, blue), and ponto-cerebellar tract (afferent 2) were placed on the pontine nucleus and middle
cerebellar peduncle bilaterally (Fig. 1A, green). The fiber tracking started with defining ROIs on
the high resolution T2-weighted images. The fiber tracking parameters were as follows: FA
threshold, 300; smoothness, 20; minimum length, 10; sampling, 1. All placements of ROIs were
performed by another rater who was blinded to clinical information. We obtained several
quantitative parameters through these fiber tracking and calculations: mean fractional anisotropy
(FA) values, mean diffusivity (MD) values, and mean radial diffusivity (RD) values.
Statistical analysis
Continuous demographic and clinical data are presented as mean ± S.D. in the text and
table. Statistical analyses were performed using statistical software (SPSS 22.0.0.0; IBM, Armonk,
New York, USA). After having checked for normality, we performed Mann-Whitney tests to
compare FA, MD, and RD values between MSA-C and CCA patients. P-values < 0.05 were
considered to be significantly different. Receiver-operator characteristic (ROC) curves were
computed for both FA and RD values. Cutoff levels were selected from the ROC curves as the
values with optimum sensitivity and specificity for this study. In order to examine the influence of
disease-duration, SARA, SARA/disease-duration, FA, MD, and RD values on each fiber, we
performed Spearman’s rank correlation coefficient tests among MSA-C patients and CCA patients.
The FA values of each fiber were assessed as a function of disease-duration (M) and
SARA/disease-duration using linear regression analysis was calculated.
Results
All patients were examined with MRI. The demographic and clinical features of
MSA-C and CCA patients are shown in Table 1. Fig. 1 demonstrates an efferent fiber tract (red)
and two afferent fiber tracts (blue and green) via the cerebellum in sagittal (Fig. 1B), coronal (Fig.
1C), and axial (Fig. 1D) sections.
Imaging findings
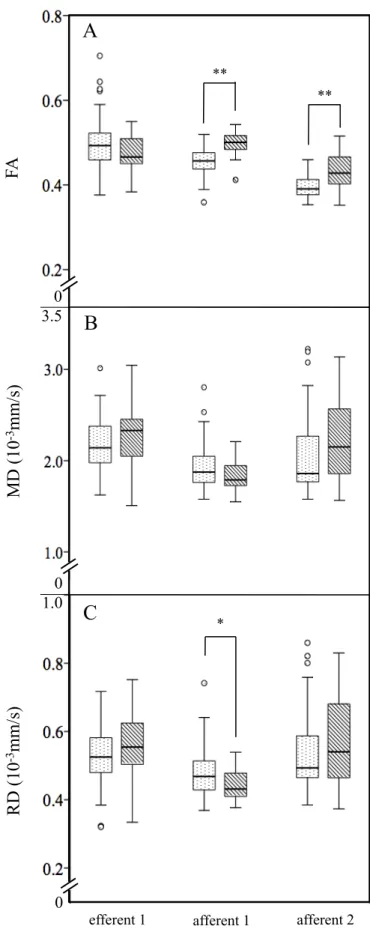
Fig. 2 shows a comparison of mean fractional anisotropy (FA), mean diffusivity (MD),
and mean radial diffusivity (RD) values of an efferent fiber tract and two afferent fiber tracts in
MSA-C and CCA patients. The FA values of efferent 1 showed no significant difference between
MSA-C (0.50 ± 0.07) and CCA patients (0.47 ± 0.04). In contrast, the FA values of afferent 1 and
afferent 2 were significantly reduced in MSA-C than CCA patients (afferent 1: MSA-C vs CCA,
0.45 ± 0.03 vs 0.50 ± 0.03; afferent 2: 0.40 ± 0.03 vs 0.43 ± 0.04, ** p<0.01 respectively) (Fig.
2A). On the other hand, the MD values (10-3 mm/s) of these three tracts were not significantly
different between MSA-C (efferent 1: 2.19 ± 0.32, afferent 1: 1.94 ± 0.28, afferent 2: 2.08 ± 0.45)
and CCA (2.27 ± 0.36, 1.82 ± 0.18, 2.22 ± 0.43) patients (Fig. 2B). The RD values (10-3 mm/s) of
efferent 1 and afferent 2 were not significantly different between MSA-C (efferent 1: 0.51 ± 0.13,
afferent 2: 0.53 ± 0.15) and CCA (efferent 1: 0.56 ± 0.10, afferent 2: 0.57 ± 0.13) patients.
However, the RD value of afferent 1 was significantly higher in MSA-C patients (0.47 ± 0.11, *
p<0.05) than in CCA patients (0.41 ± 0.12) (Fig. 2C).
ROC curve analysis
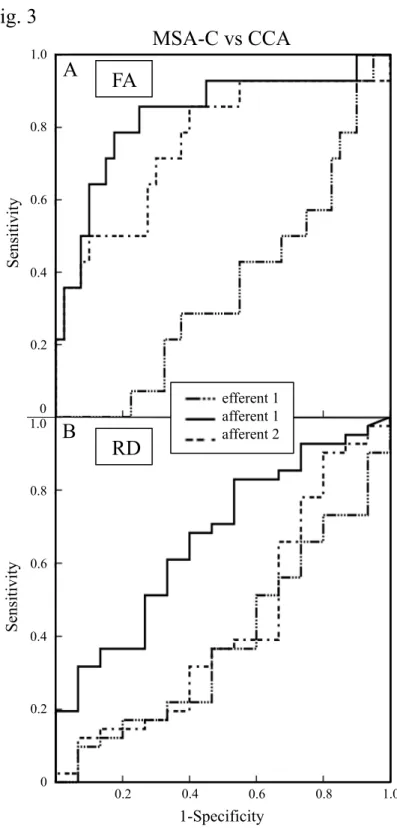
To evaluate the diagnostic sensitivity and specificity of FA and RD values that were
significantly different (Fig. 2A and C), ROC curves were computed for MSA-C vs CCA patients
(Fig. 3). Evaluation of the FA values indicated that the sensitivity and specificity to discriminate
MSA-C patients from CCA patients was 85.7% and 75.0%, respectively with a cutoff value of
0.476 for afferent 1 (area under the curve (AUC): 0.834). In the same manner (cutoff: 0.396), the
sensitivity and specificity of afferent 2 was 85.7% and 60.0%, respectively (AUC: 0.757). The
cutoff value of efferent 1 was not set (Fig. 3A) due to a lack of difference in FA between MSA-C
and CCA patients (Fig. 2A). Evaluation of the RD values revealed that the sensitivity and
specificity of afferent 1 was 82.9 and 46.7 %, respectively (cutoff: 0.421, AUC: 0.671). The cutoff
values of efferent 1 and afferent 2 were not set (Fig. 3B) due to a lack of difference in RD between
MSA-C and CCA patients (Fig. 2C).
Correlation and Regression Analyses
To evaluate the disease-duration and SARA/disease-duration effects on DTI
characteristics, the data of MSA-C and CCA patients were plotted to create a scatter diagram, and
regression lines were calculated. The linear regressions of efferent 1 between the FA values and
disease-duration revealed a strong correlation in CCA patients (diamonds and dotted line: r=-0.466,
* p<0.05) but not in MSA-C patients (open circles and solid line: r=-0.194, p=0.231) (Fig. 4A). In
contrast, a significant correlation of the linear regressions of afferent 1 was also observed between
the FA values and SARA/disease-duration in MSA-C patients (open circles and solid line:
r=-0.407, ** p<0.01), but not in CCA patients (diamonds and dotted line: r=0.140, p=0.634) (Fig.
4B). The FA values of afferent 2 were strongly correlated with disease-duration in CCA patients
(diamonds and dotted line: r=-0.543, * p<0.05) but not in MSA-C patients (open circles and solid
line: r=0.020, p=0.903) (Fig. 4C).
Discussion
In the present study, an efferent fiber tract and two afferent fiber tracts were
successfully reconstructed as DTI track images via the cerebellum (Fig. 1). Compared to CCA
patients, the FA values of afferent 1 and 2 showed a significant reduction in MSA-C patients (Fig.
2). ROC curve analysis showed that the FA values of afferent 1 especially discriminated MSA-C
from CCA patients (Fig. 3A, solid line). Although there was no difference in the FA value of
efferent 1 (Fig. 2), the FA values of efferent 1 and afferent 2 were strongly correlated with disease
duration in CCA patients (Fig. 4A and 4C, dotted lines). Moreover, those of afferent 1 showed a
significant correlation with the ratio SARA/duration in MSA-C patients (Fig. 4B, solid line).
In MSA-C patients, a hot cross bun sign is frequently found in the pons as a cruciform
hyperintensity on transverse T2-weighted images. The sign is mainly due to selective losses of
myelinated transverse pontocerebellar fibers and neurons in the pontine raphe with preservation of
the pontine tegmentum and corticospinal tracts (4, 18). On the other hand, CCA may be
characterized by extensive Purkinje cell loss in the vermis and neuronal loss in the flocculonodular
lobe (2, 7, 8, 19). However, autopsy reports showed that the cerebellar hemisphere could also be
involved in CCA (19, 20), suggesting the pathological lesion of CCA both in the efferent and
afferent fiber tracts, but predominantly with the efferent fiber (Fig. 4A, C). In spite of distinct
neuropathological features (21), cerebellar symptoms of MSA-C and CCA are quite similar,
making differential diagnosis difficult, especially at an early stage.
Many DTI and tractography studies have been performed to develop accurate
diagnostic biomarkers for neurological disorders (10, 11, 22), where decreasing FA value was
mainly reported at the legions of neuronal/ axonal loss and myelin degeneration with a
concomitant increase of the MD value. An isolated decrease of the FA value was observed at the
legions where α-synuclein accumulated (3, 9, 23, 24). In the present study, two afferent fiber tracts
of MSA-C patients showed such an isolated decrease of the FA value (Fig. 2A and 2B). In
addition, the FA values of afferent 2 had already decreased at an early stage of MSA-C (Fig. 4C,
solid line), suggesting that α-synuclein-positive glial cytoplasmic inclusions (GCI) were present in
the pons before evident neuronal loss. The present tractography study (Fig. 1-4) may detect such
insidious pathological processes.
The present study has a limitation, because we could not get the information on their
genetic testing to establish “sporadic adult onset ataxia of unknown etiology”. However we
checked their family history thoroughly to carry out precise diagnosis (5, 25). Second,
deterministic tractography cannot resolve the crossing of projections, such as efferent 1 where
fibers originating in the dentate nucleus cross inside pons to reach the opposite red nucleus.
However we thought that it is high certainty that automatically selecting the fiber via the 2 ROIs.
In that case, bilateral tracking was performed automatically. Third, in this study, the member of
our patients was too small to apply corrections for multiple comparisons.
In conclusion, the present study demonstrated different features of efferent and afferent
fiber tracts when comparing MSA-C and CCA patients. In particular, the FA values of two
afferent fiber tracts showed a significant decline (Fig. 2A), and afferent 1 showed good diagnostic
sensitivity, specificity, and area under the curve (AUC) (Fig. 3A). Furthermore, the FA values of
each fiber tract suggest that this diffusion tensor tractography analysis could be useful for
differentiating CCA from MSA-C patients (Fig. 4).
Acknowledgments
This work was partly supported by Grants-in-Aid for Scientific Research (B) 25293202,
(C) 15K09316 and Challenging Research 15K15527 and Young Research 15K21181, and by
Grants-in-Aid from the Research Committees (Mizusawa H, Nakashima K, Nishizawa M, Sasaki
H, and Aoki M) from the Ministry of Health, Labour and Welfare of Japan.
References
1. Gilman S, Low PA, Quinn N, Albanese A, Ben-Shlomo Y, Fowler CJ, et al. Consensus statement on the diagnosis of multiple system atrophy. J Neurol Sci. 1999;163(1):94-8.
2. Tsuji S, Onodera O, Goto J, Nishizawa M, Study Group on Ataxic D. Sporadic ataxias in Japan--a population-based epidemiological study. Cerebellum. 2008;7(2):189-97.
3. Wakabayashi K, Takahashi H. Cellular pathology in multiple system atrophy.
Neuropathology. 2006;26(4):338-45.
4. Schrag A, Kingsley D, Phatouros C, Mathias CJ, Lees AJ, Daniel SE, et al. Clinical usefulness of magnetic resonance imaging in multiple system atrophy. J Neurol Neurosurg Psychiatry. 1998;65(1):65-71.
5. Abele M, Burk K, Schols L, Schwartz S, Besenthal I, Dichgans J, et al. The aetiology of sporadic adult-onset ataxia. Brain. 2002;125(Pt 5):961-8.
6. Klockgether T. Sporadic adult-onset ataxia of unknown etiology. Handb Clin Neurol.
2012;103:253-62.
7. Kanazawa I, Kwak S, Sasaki H, Mizusawa H, Muramoto O, Yoshizawa K, et al.
Studies on neurotransmitter markers and neuronal cell density in the cerebellar system in olivopontocerebellar atrophy and cortical cerebellar atrophy. J Neurol Sci.
1985;71(2-3):193-208.
8. Baloh RW, Yee RD, Honrubia V. Late cortical cerebellar atrophy. Clinical and oculographic features. Brain. 1986;109 ( Pt 1):159-80.
9. Tha KK, Terae S, Yabe I, Miyamoto T, Soma H, Zaitsu Y, et al. Microstructural white matter abnormalities of multiple system atrophy: in vivo topographic illustration by using diffusion-tensor MR imaging. Radiology. 2010;255(2):563-9.
10. Foerster BR, Carlos RC, Dwamena BA, Callaghan BC, Petrou M, Edden RA, et al.
Multimodal MRI as a diagnostic biomarker for amyotrophic lateral sclerosis. Ann Clin Transl Neurol. 2014;1(2):107-14.
11. Marek M, Paus S, Allert N, Madler B, Klockgether T, Urbach H, et al. Ataxia and tremor due to lesions involving cerebellar projection pathways: a DTI tractographic study in six patients. J Neurol. 2015;262(1):54-8.
12. Nagesh V, Tsien CI, Chenevert TL, Ross BD, Lawrence TS, Junick L, et al.
Radiation-induced changes in normal-appearing white matter in patients with cerebral tumors: a diffusion tensor imaging study. Int J Radiat Oncol Biol Phys.
2008;70(4):1002-10.
13. Ito M, Watanabe H, Kawai Y, Atsuta N, Tanaka F, Naganawa S, et al. Usefulness of combined fractional anisotropy and apparent diffusion coefficient values for detection of involvement in multiple system atrophy. J Neurol Neurosurg Psychiatry.
2007;78(7):722-8.
14. Prakash N, Hageman N, Hua X, Toga AW, Perlman SL, Salamon N. Patterns of fractional anisotropy changes in white matter of cerebellar peduncles distinguish spinocerebellar ataxia-1 from multiple system atrophy and other ataxia syndromes.
Neuroimage. 2009;47 Suppl 2:T72-81.
15. Gilman S, Wenning GK, Low PA, Brooks DJ, Mathias CJ, Trojanowski JQ, et al.
Second consensus statement on the diagnosis of multiple system atrophy. Neurology.
2008;71(9):670-6.
16. Fujiwara S, Sasaki M, Kanbara Y, Inoue T, Hirooka R, Ogawa A. Feasibility of 1.6-mm isotropic voxel diffusion tensor tractography in depicting limbic fibers. Neuroradiology.
2008;50(2):131-6.
17. N Toussaint, J C Souplet, P Fillard. MedINRIA: Medical Image Navigation and Research Tool by INRIA. MICCAI'07 Workshop on Interaction in medical image
analysis and visualization, 2007. Brisbane, Australia,.
18. Shrivastava A. The hot cross bun sign. Radiology. 2007;245(2):606-7.
19. Ota S, Tsuchiya K, Anno M, Niizato K, Akiyama H. Distribution of cerebello-olivary degeneration in idiopathic late cortical cerebellar atrophy: clinicopathological study of four autopsy cases. Neuropathology. 2008;28(1):43-50.
20. Tsuchiya K, Ozawa E, Saito F, Irie H, Mizutani T. Neuropathology of late cortical cerebellar atrophy in Japan: distribution of cerebellar change on an autopsy case and review of Japanese cases. Eur Neurol. 1994;34(5):253-62.
21. Mascalchi M. Spinocerebellar ataxias. Neurol Sci. 2008;29 Suppl 3:311-3.
22. Hesseltine SM, Law M, Babb J, Rad M, Lopez S, Ge Y, et al. Diffusion tensor imaging in multiple sclerosis: assessment of regional differences in the axial plane within normal-appearing cervical spinal cord. AJNR Am J Neuroradiol. 2006;27(6):1189-93.
23. Wenning GK, Tison F, Ben Shlomo Y, Daniel SE, Quinn NP. Multiple system atrophy:
a review of 203 pathologically proven cases. Mov Disord. 1997;12(2):133-47.
24. Nilsson C, Markenroth Bloch K, Brockstedt S, Latt J, Widner H, Larsson EM.
Tracking the neurodegeneration of parkinsonian disorders--a pilot study.
Neuroradiology. 2007;49(2):111-9.
25. Schols L, Szymanski S, Peters S, Przuntek H, Epplen JT, Hardt C, et al. Genetic background of apparently idiopathic sporadic cerebellar ataxia. Hum Genet.
2000;107(2):132-7.
Figure legends
Fig. 1 ROIs of cerebello-rubro tract were placed over the red nucleus and superior cerebellar
peduncle bilaterally (red: efferent 1), of olivo-cerbellar tract were placed on the inferior olivary
nucleus and cerebellar cortex bilaterally (blue: afferent 1), and of ponto-cerbellar tract were placed
on the pontine nucleus and middle cerebellar peduncle bilaterally (green: afferent 2) (A).
Tractography of the patient was reconstructed by an efferent fiber tract (red) and two afferent fiber
tracts (blue and green) via the cerebellum in sagittal (B), coronal (C), and axial (D) sections.
Fig. 2 Comparison of FA values (A), MD values (10-3 mm/s) (B), and RD values (10-3 mm/s) (C)
of an efferent fiber tract and two afferent fibers tracts in MSA-C (dotted boxes) and CCA
(diagonal striped boxes) patients. Note the significant declines of FA values of afferent 1 and 2 in
MSA-C patients (** p<0.01 respectively), and the significant increase of the RD value of afferent
1 in MSA-C patients (* p<0.05).
Fig. 3 ROC curve analysis of the FA values shows 85.7% sensitivity and 75.0% specificity to
discriminate MSA-C from CCA patients with a cutoff value of 0.476 of afferent 1 (area under the
curves (AUC): 0.834) (A), in contrast to the lower sensitivity and specificity of afferent 1, 82.9
and 46.7%, respectively (cutoff: 0.421, AUC: 0.671) (B).
Fig. 4 Scatter diagram and individual regression lines of MSA-C (open circles and solid lines)
and CCA (diamonds and dotted lines) patients between the FA value and disease duration (month,
M) (A, C) or the ratio SARA/disease duration (B). Note the strong correlations between the FA
value and disease duration in CCA patients in efferent 1 (A) and afferent 2 (C), and between the
FA value and the ratio SARA/disease duration in MSA-C patients in afferent 1 (B).
Subjects MSA-C CCA p-value
n 41 15 -
Gender (M/F) 21/20 7/8 p=0.763
aDisease onset (years) 58.6 ± 8.7 53.3 ± 15.1 p=0.350
cDisease duration (years) 4.0 ± 2.7 9.7 ± 9.4 p=0.055
cExamined age (years) 62.7 ± 8.1 63.0 ± 8.6 p=0.901
bSARA 17.3 ± 8.5 11.3 ± 2.9 *p=0.024
cHot cross bun sign (%) 71.8 0.0 **p<0.001
aT2-hyper intensity of middle
cerebellar peduncle (%) 69.2 0.0 **p<0.001
aa: χ
2test b: t test
c: Mann-Whitney test
Table 1
Demographic and clinical features of imaging study patientsFig. 1
efferent 1
afferent 2 afferent 1
efferent 1
afferent 2
afferent 1 efferent 1
afferent 2
afferent 1 ROI
ROI ROI
A
D C
B
Fig. 2
A
**
**
FA
MD (10-3mm/s)
0
3.5
B
MD (10-3mm/s)
-3 (10RDmm/s) *
C
0 1.0
*
0
efferent 1 afferent 1 afferent 2
Fig. 3
0
0
FA
1-Specificity
RD
0 1.0
Sensitivity
0.2 0.4 0.6 0.8 1.0
Sensitivity
0.2 0.4 0.6 0.8
0 0.2 0.4 0.6 0.8 1.0
A
B
MSA-C vs CCA
efferent 1 afferent 1 afferent 2
0 0
r=-0.194 p=0.231
r=-0.466
*p<0.05
r=0.140 p=0.634
r=-0.407
**p<0.01 r=0.020
p=0.903
r=-0.543
*p<0.05
afferent 2 afferent 1 C
B Fig. 4
efferent 1 A
FA
duration (M) SARA/duration duration (M)