L
ipoprotein(a), or Lp(a), is a low-density lipopro- tein (LDL)-like particle. Apolipoprotein B is cova- lently linked to apolipoprotein(a) by a single disulfide bond [1]. Circulating concentrations of Lp(a) varywidely across individuals and ethnic subgroups, medi- ated in large part by genetic variations at the LPA gene locus [2]. A meta-analysis of 126,634 participants in 36 prospective studies found that Lp(a) was an indepen- dent risk factor for coronary heart disease and stroke [3]. Mendelian randomization studies have linked
CopyrightⒸ 2018 by Okayama University Medical School.
http ://escholarship.lib.okayama-u.ac.jp/amo/
Original Article
High Baseline Lipoprotein(a) Level as a Risk Factor for Coronary Artery Calcification Progression: Sub-analysis of a Prospective Multicenter Trial
Jun Idaa, Kazuhiko Kotanib, Toru Miyoshia*, Kazufumi Nakamuraa*, Kunihisa Kohnoa, Hirohiko Asonumac, Satoru Sakuragid, Masayuki Doie,
Takashi Mikia, Yasushi Koyamaf, and Hiroshi Itoa
aDepartment of Cardiovascular Medicine, Okayama University Graduate School of Medicine,
Dentistry and Pharmaceutical Sciences, Okayama 700-8558, Japan, bDepartment of Clinical Laboratory Medicine, Department of Community and Family Medicine, Jichi Medical University, Shimotsuke, Tochigi 329-0498, Japan,
cDepartment of Cardiology, Kasaoka Diichi Hospital, Kasaoka, Okayama 714-0043, Japan,
dDepartment of Cardiology, Iwakuni Clinical Center, Iwakuni, Yamaguchi 740-8510, Japan,
eDepartment of Cardiology, Kgawa Prefectural Central Hospital, Takamatsu 760-8557, Japan,
fDepartment of Cardiology, Sakurabashi Watanabe Hospital, Osaka 530-0001, Japan
Lipoprotein(a), or Lp(a), is a low-density lipoprotein-like particle largely independent of known risk factors for, and predictive of, cardiovascular disease (CVD). We investigated the association between baseline Lp(a) levels and the progression of coronary artery calcification (CAC) in patients with hypercholesterolemia under- going statin therapy. This study was a sub-analysis of a multicenter prospective study that evaluated the annual progression of CAC under intensive and standard pitavastatin treatment with or without eicosapentaenoic acid in patients with an Agatston score of 1 to 999, and hypercholesterolemia treated with statins. We classified the patients into 3 groups according to CAC progression. A total of 147 patients (mean age, 67 years; men, 54%) were analyzed. The proportion of patients with Lp(a) >30 mg/dL significantly increased as CAC progressed (non-progression; 5.4%, 0<CAC progression ≦100; 7.7%, and CAC progression >100; 23.6%). Logistic regression analysis showed that Lp(a) >30 mg/dL was an independent predictor of the annual change in Agatston score >100 (OR: 5.51; 95% CI: 1.28-23.68; p=0.02), even after adjusting for age, sex, hyperten- sion, diabetes mellitus, current smoking, body mass index, and lipid-lowering medications. Baseline Lp(a)
>30 mg/dL was a predictor of CAC progression in this population of patients with hypercholesterolemia undergoing statin therapy.
Key words: lipoprotein(a), coronary artery calcification, statins, hypercholesterolemia
Received September 15, 2017 ; accepted October 30, 2017.
*Corresponding author. Phone : +81-86-235-7351; Fax : +81-86-235-7353 E-mail : [email protected] (T. Miyoshi) or
[email protected] (K. Nakamura) Conflict of Interest Disclosures: No potential conflict of interest relevant to this article was reported.
genetic variations at the LPA locus to both circulating Lp(a) concentrations and the risk for cardiovascular disease (CVD), supporting a causal role of Lp(a) in CVD pathogenesis [4,5]. Generic methods to modu- late circulating Lp(a) concentrations in daily practice remain to be determined, and the further accumulation of evidence based on the monitoring of patients with high Lp(a) levels (even when undergoing treatment with lipid-lowering drugs such as statins) is crucial [2,6].
Among the methods available for the assessment of CVD risk, coronary artery calcification (CAC), which is determined by computed tomography (CT), is an excellent marker for the clinical measurement of the burden of CVD risk [7]. Detrano et al. reported that the adjusted risk for a coronary event increased by a factor of 9.67 among participants with CAC scores >300 com- pared to participants with no coronary calcification [8].
After serial assessments, the progression of CAC scores has been proposed as a useful predictor of cardiac out- come [9-11].
We recently reported the results of a prospective multicenter study (Effect of pitavastatin and EPA on coronary artery calcification detected by computed tomography: PEACH study) that examined the effects of intensive and standard pitavastatin treatment with or without eicosapentaenoic acid (EPA) on the annual progression of CAC [12]. In that study, we found that the overall CAC progression rate over 1 year was 40%
and that the CAC progression in each patient group was not affected by the allocated treatments. A determina- tion of the factors involved in CAC progression is of interest.
Cross-sectional studies have reported an association between Lp(a) and CAC [13,14]. Data from a large Asian cohort of 14,583 participants suggested a robust association between higher Lp(a) level and CAC in both men and women, regardless of LDL cholesterol level and other CVD risk factors [14]. However, that study was limited by the nature of cross-sectional studies with regard to causality. Longitudinal studies (including short-term studies) are required to confirm the progres- sion of CAC using baseline Lp(a) levels. In the present study, we analyzed the association between baseline Lp(a) levels and the annual progression of CAC in patients with hypercholesterolemia who were undergo- ing statin therapy.
Methods
Ethical considerations. The principal study was a prospective, open-label, multicenter trial conducted between May 2010 and August 2011. That study was approved by the Ethics Committee of Okayama University Graduate School of Medicine, Dentistry, and Pharmaceutical Sciences (Certificate No. 1652) and other hospitals involved. All participants provided written informed consent before enrolling. The study was conducted in accord with the principles contained within the Declaration of Helsinki. The study is regis- tered at the UMIN Clinical Trials Registry (UMIN000003171; Effect of pitavastatin and EPA on coronary artery calcification detected by computed tomography: PEACH study).
Study design. The current study was a pre-speci- fied sub-analysis of the PEACH study [12]. Eligible patients were adults (>20 years old) with an Agatston score of 1 to 999, with hypercholesterolemia (LDL cho- lesterol ≥140 mg/dL at screening or taking a statin), and no history of CVD. The exclusion criteria were a history of coronary revascularization, including percu- taneous coronary intervention and coronary artery bypass surgery; Agatston score of 0 or >1,000; familial hypercholesterolemia; use of cyclosporine; and use of lipid-lowering agents excluding statins. Patients were enrolled after an evaluation for eligibility at each insti- tution, including baseline multi-detector row computed tomography (MDCT) image acquisition. The partici- pants were randomly allocated into 3 groups: the pitavastatin 2 mg/day, pitavastatin 4 mg/day, or pitavastatin 2 mg/day combined with EPA 1,800 mg/
day groups. After taking pitavastatin 2 mg/day for 2 months to check for tolerance, the allocated treatment was started.
Baseline blood test data were obtained just before the allocated treatment was started. MDCT and blood tests were performed again at the 1-year follow-up. Figure 1 is a flow diagram of the study design. In the principal study, we enrolled 217 patients at 27 centers in Japan.
Among them, 157 patients were included in the pri- mary analysis. Ten patients were excluded because their stored blood samples were not available for the mea- surement of Lp(a). A final total of 147 patients were included in this post-hoc analysis. The primary outcome of the sub-study was the association between the patients’ baseline Lp(a) level and their annual CAC pro-
gression (Agatston score).
MDCT imaging and CAC analysis. MDCT imaging was performed as described [15]. All recruit- ing sites had previous cardiac CT experience and were equipped with 64-slice or higher advanced CT technol- ogy. ECG triggering was performed at 80% of the RR interval. MDCT images were documented in a digital imaging and communications in medicine (DICOM) format, which was sent to the core laboratory at L&L Co. (Osaka, Japan) for blinded analysis. The local sites generated the total Agatston score, which was used as the inclusion criterion of this study. A calcium thresh- old ≥130 Hounsfield units was used. As described by Agatston, the calcium score was determined by multi- plying the area of each calcified lesion by a weighing factor corresponding to the peak pixel intensity for each lesion [16].
The image analysis was performed by a trained radiologist and trained cardiologist (Y.K.) who were blind to the patients’ data. Disagreements in data anal- ysis between the 2 observers were resolved by consen- sus. We divided the participants into three groups according to the severity of CAC progression over 1 year: no progression, 0<CAC progression≤100, and CAC progression >100. CAC progression was defined as any CAC increase over the year.
Risk factors and laboratory analyses. Data on demographics, smoking status, and medication were collected for each participant. Current smoking was defined as a history of cigarette smoking during the past year. Diabetes was confirmed according to the criteria of the American Diabetes Association [17] or based on a history of diabetes mellitus treatment. Hypertension was defined as having a seated blood pressure of
≥140/90 mmHg or undergoing treatment with antihy- pertensive medication. Body mass index (BMI) was calculated as body weight (kg) divided by squared height (m).
All laboratory values were determined at an inde- pendent central study laboratory (SRL, Tokyo, Japan).
Standard enzymatic methods were used to measure total cholesterol, high-density lipoprotein (HDL) cho- lesterol, LDL cholesterol, and triglycerides. High- sensitivity C-reactive protein levels were determined using an assay (Roche-Hitachi; Hitachi, Tokyo, Japan).
Residual serum was separated and stored at −80°C, and the serum concentration of Lp(a) was measured using an enzyme-linked immunosorbent assay (Shino-Test, Tokyo, Japan) [18].
Statistical analysis. Continuous variables are mean (standard deviation) or median (25th percentile, 75th percentile), as appropriate. Categorical variables
217 Patients provided consent and were randomly allocated to a group
72 PIT2 72 PIT4 73 PIT2+EPA
66 PIT4 Included in safety analysis (principle study) 9 Excluded
No or poor MDCT image at follow-up
19 Excluded following statin tolerance check for 2 months
6 Consent withdrawn
7 Agatston score = 0 and 3 Agatston score >1000 by
evaluation at core laboratory 3 Statin intolerance
20 Excluded No or poor MDCT image at follow-up
12 Excluded No or poor MDCT image at follow-up 64 PIT2 Included in safety
analysis (principle study) 68 PIT2+EPA Included in safety
analysis (principle study)
55 Included in efficacy analysis (principle study)
5 Excluded
No stored blood sample 4 Excluded
No stored blood sample 1 Excluded
No stored blood sample 50 Included in
sub-analysis
46 Included in efficacy
analysis (principle study) 56 Included in efficacy analysis (principle study)
42 Included in
sub-analysis 55 Included in
sub-analysis 147 included in this sub-analysis
Fig. 1 Flow diagram of patient enrollment. PIT2, pitavastatin 2mg/day; PIT4, pitavastatin 4mg/day; EPA, eicosapentaenoic acid 1,800mg/day; MDCT, multi- detector row computed tomog- raphy.
are frequency and proportion (%). The Kruskal-Wallis test was used to compare continuous variables among the groups. The chi-square test was used to compare categorical variables. Pearson’s correlation coefficients were used to assess relationships between Lp(a) and other parameters. Data that were not normally distrib- uted, as determined by the Kolmogorov-Smirnov test, were logarithmically transformed before linear regres- sion analysis. Logistic analysis was performed to deter- mine the odds ratio (OR) with 95% confidence intervals (95%CI) for the progression of CAC associated with baseline Lp(a) level (>30 mg/dL and ≤30 mg/dL). The following variables were entered into the logistic model:
age, sex, hypertension, diabetes mellitus, current smoking, BMI, and lipid-lowering medications (pitavastatin 2 mg/day, pitavastatin 4 mg/day, or pitavastatin 2 mg/day combined with EPA 1,800 mg/
day). A p-value <0.05 was considered significant.
Statistical analyses were performed using SPSS 27.0 for Windows (IBM, Armonk, NY, USA).
Results
Baseline characteristics. Table 1 summarizes the baseline characteristics of participants. The mean age was 67 years, and 54% were men. The proportions of patients with hypertension and diabetes mellitus were 81% and 27%, respectively. The median baseline Lp(a)
level was 10.2 mg/dL, and 9.5% of participants (n=14) had an Lp(a) level >30 mg/dL.
Association between metabolic parameters and baseline Lp(a) levels. A bivariate correlation analysis with baseline Lp(a) and other metabolic parameters showed that age was positively correlated with the base- line Lp(a) level, and the triglycerides level was nega- tively correlated with the baseline Lp(a) level (Table 2).
There was no correlation between the baseline Lp(a) level and CAC scores.
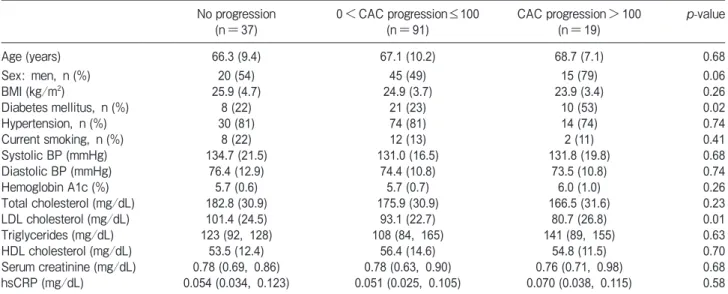
Comparison of variables according to CAC progres- sion. At the 1-year follow-up, 110 patients (75%) showed CAC progression. When we compared baseline parameters among the groups with no CAC progres- sion, 0<CAC progression≤100, and CAC progression
>100, it was revealed that the proportion of patients with diabetes mellitus was significantly increased and the LDL cholesterol levels were significantly decreased as the severity of CAC progression increased (Table 3).
The Lp(a) levels in patients with no progression, 0<CAC progression≤100, and CAC progression >100 were 11.6 (6.8, 17.2), 8.6 (5.0, 20.3), and 13.1 (4.1, 40.4), respectively, and did not differ significantly among the groups (p=0.23; Kruskal-Wallis test) (Fig.2A). The proportion of patients with Lp(a)
>30 mg/dL in patients with CAC progression was sig- nificantly greater than those of the other groups (no progression; 5.4%, 0<CAC progression≤100; 7.7%, and CAC progression >100; 26.3%, p=0.03) (Fig.2B).
Association between baseline Lp(a) and CAC pro- gression. The logistic analysis showed that the odds
Table 1 Patient characteristics
n=147
Age (years) 67 (10)
Sex: men, n (%) 80 (54)
BMI (kg/m2) 25.0 (4.0)
Hypertension, n (%) 118 (81)
Diabetes mellitus, n (%) 39 (27)
Current smoking, n (%) 22 (15)
Lp(a) (mg/dL) 10.2 (5.0, 21.3)
Hemoglobin A1c (%) 5.7 (0.7)
Triglycerides (mg/dL) 117 (89, 165)
LDL cholesterol (mg/dL) 93.6 (24.3)
HDL cholesterol (mg/dL) 55.5 (13.7)
Serum creatinine (mg/dL) 0.77 (0.68, 0.90)
hsCRP (mg/L) 0.054 (0.031, 0.106)
Agatston score 96 (25, 244)
Data are mean (std. dev.), number (%), or median (25th, 75th percentiles), as appropriate. Lp(a), lipoprotein a; LDL, low-density lipoprotein; HDL, high-density lipoprotein; hsCRP, high-sensitivity C-reactive protein.
Table 2 Correlation between baseline Lp(a)* and other parame- ters
r p-value
Age 0.281 0.001
BMI -0.106 0.208
Fasting blood glucose -0.178 0.033
Hemoglobin A1c -0.06 0.530
Total cholesterol -0.021 0.804
Triglycerides* -0.218 0.008
HDL cholesterol 0.06 0.492
LDL cholesterol -0.009 0.915
Serum creatinine -0.089 0.287
hsCRP* 0.015 0.853
Agatston score* 0.124 0.136
*Lp(a), triglycerides, hsCRP, and Agatston score were log-trans- formed.
p = 0.253
A
Lp(a) level (mg/dL)
100 90 80 70 60 50 40 30 20 10 0
No progression 0<CAC progression
≤100
CAC progression
>100 0
10 20 30 40 50
CAC
p = 0.03
B
Proportion of patients with Lp(a) >30 mg/dL (%)
No progression 0<CAC progression
≤100
CAC progression
>100
Table 3 Comparison of variables among patients with CAC progression over a 1-year period No progression
(n=37) 0<CAC progression≤100
(n=91) CAC progression>100
(n=19) p-value
Age (years) 66.3 (9.4) 67.1 (10.2) 68.7 (7.1) 0.68
Sex: men, n (%) 20 (54) 45 (49) 15 (79) 0.06
BMI (kg/m2) 25.9 (4.7) 24.9 (3.7) 23.9 (3.4) 0.26
Diabetes mellitus, n (%) 8 (22) 21 (23) 10 (53) 0.02
Hypertension, n (%) 30 (81) 74 (81) 14 (74) 0.74
Current smoking, n (%) 8 (22) 12 (13) 2 (11) 0.41
Systolic BP (mmHg) 134.7 (21.5) 131.0 (16.5) 131.8 (19.8) 0.68
Diastolic BP (mmHg) 76.4 (12.9) 74.4 (10.8) 73.5 (10.8) 0.74
Hemoglobin A1c (%) 5.7 (0.6) 5.7 (0.7) 6.0 (1.0) 0.26
Total cholesterol (mg/dL) 182.8 (30.9) 175.9 (30.9) 166.5 (31.6) 0.23
LDL cholesterol (mg/dL) 101.4 (24.5) 93.1 (22.7) 80.7 (26.8) 0.01
Triglycerides (mg/dL) 123 (92, 128) 108 (84, 165) 141 (89, 155) 0.63
HDL cholesterol (mg/dL) 53.5 (12.4) 56.4 (14.6) 54.8 (11.5) 0.70
Serum creatinine (mg/dL) 0.78 (0.69, 0.86) 0.78 (0.63, 0.90) 0.76 (0.71, 0.98) 0.68
hsCRP (mg/dL) 0.054 (0.034, 0.123) 0.051 (0.025, 0.105) 0.070 (0.038, 0.115) 0.58
Data are mean (std. dev.), number (%), or median (25th, 75th percentiles), as appropriate.
Table 4 Odds ratios (95% confidence intervals) for coronary artery calcification progression >100 according to baseline Lp(a) levels
Model 1 Model 2 Model 3 Model 4
Lp(a) ≤30mg/dL Reference Reference Reference Reference
Lp(a) >30mg/dL 4.72 (1.39-16.08), p=0.01 6.84 (1.90-32.16), p<0.01 5.59 (1.31-23.81), p=0.01 5.51 (1.28-23.68), p=0.02 Model 1, no adjustment: Model 2, adjusted for age and sex: Model 3, Model 2+hypertension, diabetes mellitus, current smoking, and BMI: Model 4, Model 3+lipid-lowering medications.
Fig. 2 Comparison of lipoprotein (Lp(a)) levels (A) and the proportion of patients with high Lp(a) (B) among the groups classified by coronary artery calcification (CAC) progres- sion severity over 1 year.
ratio of natural log-transformed Lp(a) for the annual progression of CAC >100 was not significant (OR: 1.49, 95%CI: 0.88-2.53, p=0.13). When the risk for annual CAC progression >100 according to baseline Lp(a) level higher or lower than 30 mg/dL was calculated (Table 4), the patients with an Lp(a) level >30 mg/dL showed a significantly increased risk for CAC progression com- pared to the patients with an Lp(a) level ≤30 mg/dL in the crude model (OR: 4.72, 95%CI: 1.39-16.08;
Model 1) and after adjusting for all confounding vari- ables (OR: 5.51, 95%CI: 1.28-23.68; Model 4).
Discussion
This study is the first to report an association between the baseline Lp(a) level and CAC progression over a 1-year follow-up in patients with hypercholester- olemia and undergoing statin therapy. Patients with CAC progression >100 over the 1-year follow-up showed a greater proportion of high baseline Lp(a) compared to those who had no progression or CAC progression <100 with LDL cholesterol lower than 100 mg/dL with statin therapy. The logistic analysis revealed that a baseline Lp(a) level >30 mg/dL pre- sented a 6.84-fold increased risk for CAC progression
>100 compared to the Lp(a) levels ≤30 mg/dL.
Our present findings are considered complementary to a recent sub-analysis of the JUPITER (Justification for the use of statin in prevention: An intervention trial evaluating rosuvastatin) trial, which reported that higher Lp(a) concentrations were associated with an increased risk for CVD events under statin therapy [19].
That sub-analysis reported that rosuvastatin reduced the incidence of CVD with no interaction which baseline Lp(a) levels. In the present study, the LDL cholesterol levels in the patients with CAC progression >100 were lower than those in the patients with CAC progression
≤100. Taken together, our findings suggest that the Lp(a) level may be a significant risk factor for CVD events in people with a low LDL cholesterol level undergoing statin therapy. This suggestion also has important clinical implications with regard to assess- ments (for instance, using CAC) used to identify patients with a high Lp(a) level. This is because generic methods for modulating circulating Lp(a) concentra- tions in daily practice remain to be determined, and careful monitoring of patients with a high Lp(a) level is needed.
In terms of a clinical cutoff point for Lp(a), the 2016 Canadian Cardiovascular Society Guidelines for the Management of Dyslipidemia consider Lp(a) >30 mg/dL to be a risk factor, and those guidelines suggest mea- suring Lp(a) to inform decision-making, particularly in patients at intermediate risk and those with a family history of premature CAD, and in younger patients [20]. A large meta-analysis showed an inflection for risk of myocardial infarction at Lp(a) >30 mg/dL [3]. Data from the Multi-Ethnic Study of Atherosclerosis (MESA) reported that cutoff values of Lp(a) for identifying the risk of CVD events differ among races, from 30 mg/dL to 50 mg/dL [21]. Tsimikas reported that Lp(a) levels are skewed leftward, and most individuals (approx.
70%) have values in the normal range of <30 mg/dL [22].
In the present study, the median Lp(a) value was 10.2 mg/dL, and the proportion of patients with Lp(a)
>30 mg/dL and >40 mg/dL were 9.5% and 3.4%, respectively. Considering these results, we used Lp(a)
>30 mg/dL as the cutoff value for the high Lp(a) level, and we observed that high Lp(a) was a significant risk factor for CAC progression. However, the appropriate cutoff value for Asian populations should be deter- mined by further studies.
The mechanisms underlying the association between elevated Lp(a) and the development of CAC remain unclear. Elevated Lp(a) may lead to atherosclerosis when particles become trapped within the arterial intima, and may also serve as a carrier of oxidized phospholipids by apolipoprotein B 100, which may propagate atherosclerosis via inflammatory pathways [23]. In addition, it was reported that Lp(a) and oxi- dized phospholipids mediate macrophage apoptosis in endoplasmic reticulum-stressed macrophages by signal- ing through the CD36/Toll-like receptor 2 pathway [24].
We thus speculate that Lp(a) may contribute to CAC through the development of atherosclerosis via multiple pathways.
In this study, the patients with baseline Lp(a)
>30 mg/dL showed a significantly increased risk for CAC progression with low LDL cholesterol and under- going statin therapy. CAC incidence and progression is considered an excellent surrogate marker for the pre- diction of CVD risk [7]. A cross-sectional study of an Asian population reported that Lp(a) levels were posi- tively associated with CAC score [14]. However, that was a cross-sectional study and it therefore could not
show a causal relationship between Lp(a) and CAC pro- gression. Recent data from a health checkup program suggest that people with a baseline Lp(a) level ≥50 mg/
dL have a 1.33-fold increased risk for CAC progression compared to those with an Lp(a) level <50 mg/dL [25].
The present study is the first longitudinal study to eval- uate the association between baseline Lp(a) and CAC progression in patients with hypercholesterolemia undergoing statin therapy.
This study has several limitations. First, as the study was of people with hypercholesterolemia undergoing statin therapy, the results cannot be applied to the gen- eral population. Second, although the Agatston score as a marker for quantifying CAC is an excellent surrogate marker for the prediction of CVD, we analyzed only CAC progression as the endpoint, not actual CVD events. We thus cannot conclude that there is an asso- ciation between high Lp(a) and CVD events. Third, the duration of follow-up was 1 year, and a longer fol- low-up period might reveal a difference in the impact of Lp(a) on the progression of CAC. In addition, data on coronary CT angiography were not available in this study. Fourth, changes in plaque volumes and mor- phology could not be evaluated. Finally, the relation- ship between the change in Lp(a) and the change in CAC remains unclear. Prospective studies for evaluat- ing the effect of lowering Lp(a) on the progression of CAC are warranted to address this issue.
In, conclusion, high Lp(a) played a role in CAC progression in this population of patients with hyper- cholesterolemia undergoing statin therapy. Our find- ings suggest that measuring Lp(a) levels will help in the risk assessment for CVD events as well as treatment options.
Acknowledgments. We thank Takefumi Oka, MD, Tadahisa Uesugi, MD, Makoto Nakahama, MD, Ysuke Kawai, MD, Mitsuru Munemasa, MD, Natsuki Takahashi, MD, Naoki Mukohara, MD, Seiji Habara, MD, Yusuke Katayama, MD, Ritsuko Terasaka, MD, Atsushi Mima, MD, Hitoshi Matsubara, MD, Shingo Hosogi, MD, Masayuki Doi, MD, Masayuki Ueeda, MD, Norio Urabe, MD, Kazufumi Takeuchi, MD, Yasuharu Namba, MD, Tetsuya Sato, MD, Nobuyuki Yamada, MD, Masahito Taniguchi, MD, Yutaka Kajikawa, MD, Kouki Watanabe, MD, Kenichi Hisamatsu, MD, Hiroo Kobayashi, MD, and Kiyoaki Maekawa, MD, who were the PEACH investigators. We thank Kaoru Akazawa, Miyuki Fujiwara, and Masayo Ohmori for their technical assistance. This study was funded by the Japan Heart Foundation (No. 12090021).
References
1. Tsimikas S and Hall JL: Lipoprotein(a) as a potential causal genetic
risk factor of cardiovascular disease: a rationale for increased efforts to understand its pathophysiology and develop targeted ther- apies. J Am Coll Cardiol (2012) 60: 716-721.
2. Schmidt K, Noureen A, Kronenberg F and Utermann G: Structure, function, and genetics of lipoprotein(a). J Lipid Res (2016) 57:
1339-1359.
3. Erqou S, Kaptoge S, Perry PL, Di Angelantonio E, Thompson A, White IR, Marcovina SM, Collins R, Thompson SG and Danesh J:
Lipoprotein(a) concentration and the risk of coronary heart disease, stroke, and nonvascular mortality. JAMA (2009) 302:412-423.
4. Clarke R, Peden JF, Hopewell JC, Kyriakou T, Goel A, Heath SC, Parish S, Barlera S, Franzosi MG, Rust S, Bennett D, Silveira A, Malarstig A, Green FR, Lathrop M, Gigante B, Leander K, de Faire U, Seedorf U, Hamsten A, Collins R, Watkins H and Farrall M: Genetic variants associated with Lp(a) lipoprotein level and coronary disease. N Engl J Med (2009) 361:2518-2528.
5. Kamstrup PR, Tybjaerg-Hansen A, Steffensen R and Nordestgaard BG: Genetically elevated lipoprotein(a) and increased risk of myo- cardial infarction. JAMA (2009) 301: 2331-2339.
6. Kotani K, Serban MC, Penson P, Lippi G and Banach M:
Evidence-based assessment of lipoprotein(a) as a risk biomarker for cardiovascular diseases - Some answers and still many ques- tions. Crit Rev Clin Lab Sci (2016) 53:370-378.
7. Osawa K, Nakanishi R and Budoff M: Coronary Artery Calcifica- tion. Global heart (2016) 11: 287-293.
8. Detrano R, Guerci AD, Carr JJ, Bild DE, Burke G, Folsom AR, Liu K, Shea S, Szklo M, Bluemke DA, OʼLeary DH, Tracy R, Watson K, Wong ND and Kronmal RA: Coronary calcium as a predictor of coronary events in four racial or ethnic groups. N Engl J Med (2008) 358: 1336-1345.
9. Raggi P, Callister TQ and Shaw LJ: Progression of coronary artery calcium and risk of first myocardial infarction in patients receiving cholesterol-lowering therapy. Arterioscler Thromb Vasc Biol (2004) 24: 1272-1277.
10. McEvoy JW, Blaha MJ, Defilippis AP, Budoff MJ, Nasir K, Blumenthal RS and Jones SR: Coronary artery calcium progres- sion: an important clinical measurement? A review of published reports. J Am Coll Cardiol (2010) 56: 1613-1622.
11. Budoff MJ, Hokanson JE, Nasir K, Shaw LJ, Kinney GL, Chow D, Demoss D, Nuguri V, Nabavi V, Ratakonda R, Berman DS and Raggi P: Progression of coronary artery calcium predicts all-cause mortality. JACC Cardiovascular imaging (2010) 3:1229-1236.
12. Miyoshi T, Kohno K, Asonuma H, Sakuragi S, Nakahama M, Kawai Y, Uesugi T, Oka T, Munemasa M, Takahashi N, Mukohara N, Habara S, Koyama Y, Nakamura K and Ito H: Effect of Intensive and Standard Pitavastatin Treatment With or Without Eicosapentaenoic Acid on Progression of Coronary Artery Calcification Over 12 Months- Prospective Multicenter Study. Circ J (2018) 82:532-540.
13. Qasim AN, Martin SS, Mehta NN, Wolfe ML, Park J, Schwartz S, Schutta M, Iqbal N and Reilly MP: Lipoprotein(a) is strongly asso- ciated with coronary artery calcification in type-2 diabetic women.
Int J Cardiol (2011) 150: 17-21.
14. Sung KC, Wild SH and Byrne CD: Lipoprotein(a), metabolic syn- drome and coronary calcium score in a large occupational cohort.
Nutrition, metabolism, and cardiovascular diseases: Nutr Metab Cardiovasc Dis (2013) 23:1239-1246.
15. Sugiyama H, Miyoshi T, Osawa K, Miki T, Koide Y, Nakamura K, Morita H and Ito H: Serum cystatin C levels are associated with coronary artery calcification in women without chronic kidney dis- ease. J Cardiol (2017) 70: 559-564.
16. Agatston AS, Janowitz WR, Hildner FJ, Zusmer NR, Viamonte M, Jr. and Detrano R: Quantification of coronary artery calcium using ultrafast computed tomography. J Am Coll Cardiol (1990) 15: 827- 17. Standards of medical care in diabetes--2008. Diabetes Care (2008) 832.
31 Suppl 1: S12-54.
18. Kotani K, Yamada S, Yamada T, Kario K and Taniguchi N: Oxidized lipoprotein(a) and cardio-ankle vascular index (CAVI) in hyperten- sive subjects. Heart vessels (2013) 28: 461-466.
19. Khera AV, Everett BM, Caulfield MP, Hantash FM, Wohlgemuth J, Ridker PM and Mora S: Lipoprotein(a) concentrations, rosuvasta- tin therapy, and residual vascular risk: an analysis from the JUPITER Trial (Justification for the Use of Statins in Prevention:
an Intervention Trial Evaluating Rosuvastatin). Circulation (2014) 129: 635-642.
20. Anderson TJ, Gregoire J, Pearson GJ, Barry AR, Couture P, Dawes M, Francis GA, Genest J, Jr., Grover S, Gupta M, Hegele RA, Lau DC, Leiter LA, Lonn E, Mancini GB, McPherson R, Ngui D, Poirier P, Sievenpiper JL, Stone JA, Thanassoulis G and Ward R: 2016 Canadian Cardiovascular Society Guidelines for the Management of Dyslipidemia for the Prevention of Cardiovascular Disease in the Adult. Can J Cardiol (2016) 32: 1263-1282.
21. Guan W, Cao J, Steffen BT, Post WS, Stein JH, Tattersall MC,
Kaufman JD, McConnell JP, Hoefner DM, Warnick R and Tsai MY: Race is a key variable in assigning lipoprotein(a) cutoff values for coronary heart disease risk assessment: the Multi-Ethnic Study of Atherosclerosis. Arterioscler Thromb Vasc Biol (2015) 35: 996- 1001.
22. Tsimikas S: A Test in Context: Lipoprotein(a): Diagnosis, Prog- nosis, Controversies, and Emerging Therapies. J Am Coll Cardiol (2017) 69: 692-711.
23. Nielsen LB, Gronholdt ML, Schroeder TV, Stender S and Nordestgaard BG: In vivo transfer of lipoprotein(a) into human ath- erosclerotic carotid arterial intima. Arterioscler Thromb Vasc Biol (1997) 17: 905-911.
24. Seimon TA, Nadolski MJ, Liao X, Magallon J, Nguyen M, Feric NT, Koschinsky ML, Harkewicz R, Witztum JL, Tsimikas S, Golenbock D, Moore KJ and Tabas I: Atherogenic lipids and lipo- proteins trigger CD36-TLR2-dependent apoptosis in macrophages undergoing endoplasmic reticulum stress. Cell Metab (2010) 12:
467-482.
25. Cho JH, Lee da Y, Lee ES, Kim J, Park SE, Park CY, Lee WY, Oh KW, Park SW and Rhee EJ: Increased risk of coronary artery calcification progression in subjects with high baseline Lp(a) lev- els: The Kangbuk Samsung Health Study. Int J Cardio (2016) 222:
233-237.