Spatial and temporal variation in the distribution of juvenile southern bluefin tuna Thunnus maccoyii: implication for precise estimation of recruitment abundance indices
Ko FUJIOKA,1* Ryo KAWABE,2 Alistair J. HOBDAY,3 Yoshimi TAKAO,4 Kazushi MIYASHITA,5 Osamu SAKAI6 AND Tomoyuki ITOH6
1Graduate School of Science and Technology, Nagasaki University, Taira-machi 1551-7, Nagasaki 851-2213, Japan
2Institute for East China Sea Research, Nagasaki University, Taira-machi, Nagasaki 851-2213, Japan
3CSIRO Wealth from Oceans National Research Flagship and Marine and Atmospheric Research, GPO Box 1538, Hobart Tasmania 7001, Australia
4National Research Institute of Fisheries Engineering, Fisheries Research Agency, Hasaki, Kamisu 314-0408, Japan
5Field Science Center for Northern Biosphere, Hokkaido University, Minato, Hakodate 041-8611, Japan
6National Research Institute of Far Seas Fisheries, Fisheries Research Agency, Shimizu, Shizuoka 424-8633, Japan
*Corresponding author: Tel: 81-95-850-7311. Fax: 81-95-840-1881. Email:
ABSTRACT: Acoustic tags were used to examine the spatial and temporal distribution of
southern bluefin tuna (SBT) in southern Western Australia, which is in a region where fishery-independent acoustic surveys of the recruitment abundance index of SBT have been historically undertaken. We investigated patterns of SBT distribution within and inshore of the acoustic survey area during three summer seasons. Annual differences in distribution patterns were characterized by two distinctive migration pathways. An inshore-migrating pathway was observed in two seasons (2004/05 and 2006/07), with a relatively high proportion of tagged SBT (84.5%, 65.0%) migrating inshore of the acoustic survey area.
The other pathway was concentrated along the shelf (2005/06 season), with an estimated 63.3% of tagged SBT moving within the survey area. These variable migration patterns may bias the interannual fluctuations in abundance indices. Current survey methods can be modified to include both inshore and the continental shelf. This contribution shows that the accuracy of acoustic surveys can be improved by including ecological patterns.
KEY WORDS: acoustic telemetry, migratory pathway, movement patterns, recruitment abundance index, residence time.
INTRODUCTION
Southern bluefin tuna Thunnus maccoyii (SBT) spawn in the northeast Indian Ocean from August to May [1]. Young-of-the-year migrate down the shelf of the western coast of Australia and are found as age-1 SBT in southern Western Australia. A fishery-independent survey, which has become a necessity in many regions [2] for assessing the stock abundance of commercially important fish, has been applied to determine the relative abundance of 1-year old SBT and is referred to as an acoustic recruitment-monitoring survey (ARS). The survey is a line transect survey using a consistent protocol by means of omni-scanning sonar since the 1995/96 season under the Japan-Australia Southern Bluefin Tuna Recruitment Monitoring Program (Itoh T and Tsuji S, unpubl. data, 2004). The ARS has been conducted in a specified area between Albany and Esperance, in the southern Western Australia, where the width of continental shelf becomes narrow, because it was assumed that most 1-year old SBT (and 2-year old) pass through and along the southern western coast of Australia during the summer [3]. The observed biomass is then used to determine the recruitment indices of age-1 SBT (Itoh T and Tsuji S, unpubl. data, 2002).
A common assumption is that the movement pattern of SBT pass through the ARS area does not change over time when the recruitment survey is conducted, so that changes in the recruitment index can be interpreted as a variation in the characteristics of the same fish group, rather than changes brought by movement of different populations through the ARS area. Such assumptions may be flawed. The reliability of these survey indices may depend on the changes caused by spatial and temporal distribution of SBT. A recent study suggests an interannual difference in the spatial and temporal distribution [4]. Thus, there is need to examine what causes declines in indices relative to the spatial and temporal distribution (especially the timing of the departure from the ARS area, migratory pathways, and
residence times in and out of the ARS area) of summer-resident 1-year SBT in coastal waters of southern Western Australia [3].
The study of finer localized migration patterns, such as those in coastal waters (and around small seamounts) or over the continental shelf, requires techniques capable of a much finer (about one kilometer) spatial resolution. Recent advances in acoustic tagging technology have made available low-cost, submersible receivers that can automatically detect and identify passing fish, such as cod and tuna [4-7]. The use of acoustic tracking systems has provided valuable insight into migration pathways [6], residence time on small and large seamounts [8,9] and habitat usage [10].
Some applications using acoustic tracking data have examined migration patterns of individual animals [4,6,11]. These studies typically look for individuals that pass a specific point or through a line of receivers to define migration metrics. These data are then used to calculate the rate of progression through the area and also to examine swimming speed based on movement past known points. Similar SBT cross-shelf distribution and habitat utilization in southern Western Australia are described in previous papers [3,4]. However, these studies did not explicitly address movement patterns and differences in residence time.
Here, we determined the annual fluctuation of distribution and movement patterns of age-1 SBT out of and within the ARS area using behavioral data obtained during the summer migration of juvenile SBT in 2004/05, 2005/06 and 2006/07 seasons. The main objective of our study was to identify annual fluctuations in fish distribution and aggregation as a function of temporal variation in a specific habitat, and to discuss the design of ARS in relation to the summer migration of juvenile SBT population over the three seasons.
MATERIALS AND METHODS Acoustic receivers
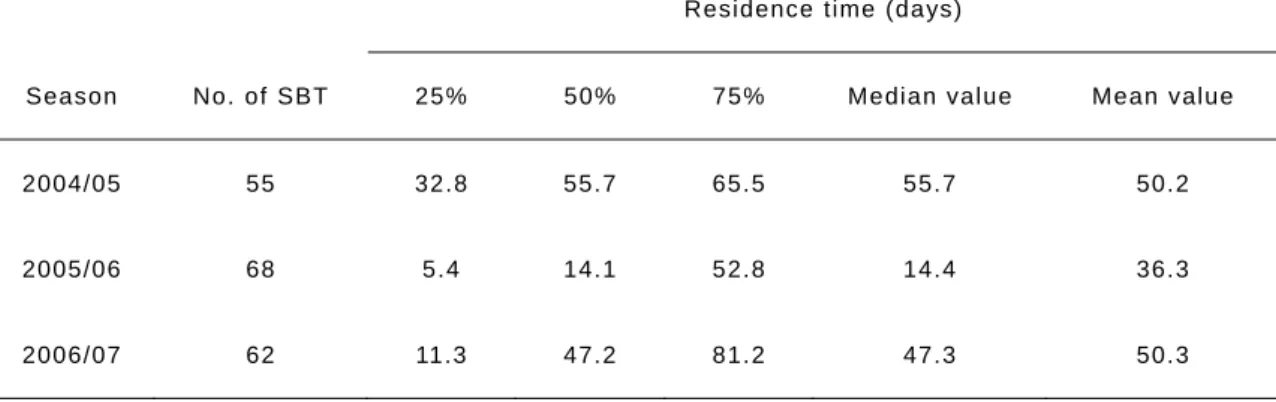
Seventy VR2 acoustic receivers (Vemco Ltd, Halifax, Canada) were deployed inshore of and within the ARS area in southern Western Australia (Fig. 1a, b). Each receiver was fastened to a vertical wire cable on a mooring anchor (125 kg section of railway track).
Listening stations with a receiver consisted of time-scheduled electronic releaser, 50 meters of release rope in a PVC canister, and four/five floats. When deployed, the receivers were set to at depth of 20-25 m, just below the subsurface floats in waters up to 150 m deep [3].
Listening stations were deployed in three cross-shelf lines running from the coast to the edge of the continental shelf at each location (Fig. 1a, western line from Bald Island (Line1:
20 stations); middle line from Point Henry (Line2: 20 stations); eastern line from West Island (Line3: 21 stations)). In addition, three listening stations were deployed at each of three coastal topographic features (Lumps) located between Line1 and Line2 in depths of 40-60 m. Some topographic lumps occur in this coastal area, and are known to attract pelagic fishes of several species, including juvenile SBT [12].
During the summer season in 2004/05, listening stations were deployed between December 3-5, 2004 and retrieved in between March 15-17 (106 days), 2005. In the 2005/06 season, listening stations were deployed between December 1-3, 2005 and retrieved between May 9-11, 2006 (161 days). In the 2006/07 season, listening stations were deployed between December 1-3, 2006 (Lines 1-2 and lumps) and January 14 (Line3) and retrieved May 29-31, 2007 (181 days). All receivers thus continuously monitored the passage of any tagged individuals over at least a 3-month period spanning December-March.
Acoustic transmitters
The transmitters used to tag SBT were V8, V9 and V16 coded pingers (Vemco Ltd). Each pinger transmits a unique pinging sequence at a frequency of 69 kHz, which is repeated after a random delay of between 20 and 60 seconds. Battery life is rated at 365 (V8/V9) and 700 (V16) days. Receivers were separated by approximately 1500 m. This spacing decision was based on a desire to cover the width of the shelf; a tag detection range of up to 450 m (V8) and 800 m (V16) were expected based on detection experiments (Hobday et al. unpubl.
data, 2005).
The same protocol used for the capture and selection of SBT for conventional tagging was followed for the acoustic tagging [3,4]. Briefly, fish were caught by polling or trolling at the stern of the vessel (F/V Quadrant) and immediately placed in a tagging cradle. Caudal fork length (FL) was measured to the nearest centimeter. For acoustic transmitters, a 1-1.5 cm horizontal incision was made about 0.5-1 cm off the midline and anterior to the vent by about 2-3 cm. The body wall was penetrated until the membranes of the peritoneum were observed. The membrane was then torn by a gloved finger, and a space in the visceral cavity (where the transmitter would be inserted) was carefully wedged out to help ensure no damage occurred to internal organs. The incisions were closed with one (or two) sutures.
The entire implantation procedure generally took less than 2 minutes. Fish were also tagged with conventional plastic dart tags placed between the pterygiophores adjacent to the insertion of second dorsal fin. All fish were tagged by a single experienced operator.
For the 2004/05 season, a total of 79 fish (FL: 41-64 cm (mean ± SD: 51.8 ± 6.2)) were tagged in the area between Line1 and Line2. For the 2005/06 season, a total of 81 fish (FL:
43-73 cm (mean ± SD: 49.4 ± 6.4)) were also tagged in the area between Line1 and Line2.
For the 2006/07 season, a total of 84 fish (FL: 44-93 cm (mean ± SD: 57.3 ± 5.8)) were
tagged in a wider region to the west of Line 2 than in previous years. The release locations on the continental shelf (west-east range) each season were 117.950oE-119.509oE (mean:
118.847oE), 117.961oE-119.265oE (mean: 118.840oE) and 115.288oE-118.979oE (mean:
118.082oE), respectively. Details of the tagging date and the number of tagged fish, FL (cm), and tagging location are given in Table 1.
Analyses
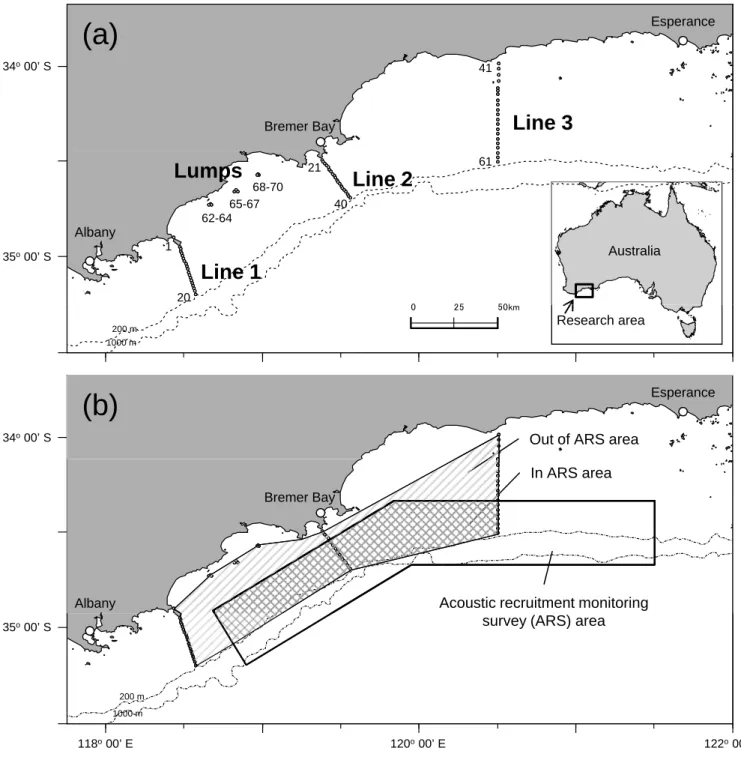
The site fidelity of tagged fish among seasons was determined by examining the time series of acoustic detections using data from each listening stations. Two areas are relevant for estimating movement patterns relative to the detection coverage of the acoustic receiver array: (i) an area within the ARS area and (ii) an area out of the ARS area (Fig.1b). The area within the ARS area was 4215.5 km2 (54% of total detection area) and out of the ARS area was 3613.8 km2 (46%). To compare the spatial usage and migratory direction of tagged SBT between the regions in and out of the ARS area, SBT occupancy in each area was determined using acoustic detection data. We calculated the proportion of time spent in and out of the ARS area based on movement time (days) between two receivers that detected the fish. In other words, the time ratio indicated the time completing movements in and out of the ARS area. Time, distance and speed (rate of movement) were calculated for each movement recorded between pairs of receivers [6]. Time was calculated as the period between the last detection at one receiver and the first detection at next receiver. Distance was measured between the positions of the two relevant receivers.
Residence times for SBT were based on survival analyses conducted with the Kaplan-Meier method. The residence time was defined as the duration in which a tagged fish stayed within detection range of all receivers [13]. We used the
Breslow-Gehan-Wilcoxon test to determine differences in the data, since the hazard function of the dataset were not parallel, which is a requirement of the log-rank test [14].
The statistical analysis was performed using the statistical software package StatView 5.0 (SAS Institute, Inc., Cary, NC, USA), and a p value less than 0.05 indicated statistical significance.
RESULTS
Detections and movement
A total of 60 (86%), 58 (83%) and 62 (89%) receivers were retrieved each year, and provided sufficient spatial coverage to determine SBT movement between receivers. The total number of tagged SBT detected at the receivers was 55 (70%) in 2004/05, 68 (84%) in 2005/06 and 62 (73%) in 2006/07. There was no significant difference between the types of tagged and detected fish (U-test, p < 0.05).
The total number of migrating SBT movements between receivers were 2744, 416 and 662, respectively. The proportion of migration movements associated with between receivers at Lumps were 93% in 2004/05, 21% in 2005/06 and 68% in 2006/07, conversely, 7%, 79% and 32% occurred between cross-shelf lines.
Spatial movements in ARS area
Tagged SBT in 2004/05 and 2006/07 migrated mostly around the Lumps (very little shelf-migration) while in 2005/06 large number of fish movements were not only between Lumps and the cross-shelf lines, but also between cross-shelf lines (Table 3). The estimated proportion of time spent out of the ARS area (84.5% and 65.0%) during 2004/05 and 2006/07 season was greater than that within the ARS area (15.5% and 35.0%). On the other hand, unlike the 2004/05 and 2006/07 seasons, tagged SBT during 2005/06 spent more time in the ARS area (63.3%) than out of ARS area (36.7%) (Fig. 2).
Residence patterns
While the tagged SBT were detected at cross-shelf lines and Lumps receivers in all three research seasons, a change of spatial distribution patterns and residence time for all of
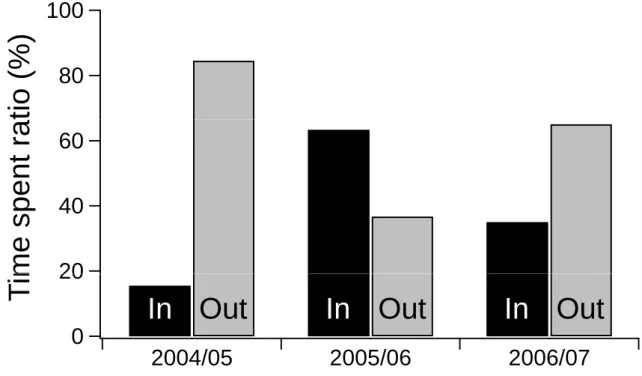
tagged fish was found between years. In the 2004/05 season, tagged SBT were present mostly at the Lumps every day during the research period and 91.3% of all detections (n = 27,855) were recorded by the receivers deployed at the Lumps, although a small number were recorded at the cross-shelf lines (Fig. 3a). In 2005/06 season, tagged SBT were widely distributed across the cross-shelf lines, and there were few fish detected at the Lumps. The total number of detections was 5,214, of which 93% occurred at cross-shelf lines (Fig. 3b).
In the 2006/07 season 88% of all detections (n = 18,514) occurred at the Lumps, and 12%
occurred at the cross-shelf lines (Fig. 3c). Residence patterns in this region indicate two migration pathway: 1) inshore-migration during both the 2004/05 and 2006/07 seasons where site fidelity appeared high, and 2) shelf-migration during the 2005/06 season where site fidelity was relatively low.
The number of tagged fish remaining in the research area declines over time in each season (Figs. 4). Some tagged fish were never detected, although half of the detected fish remained in the research area for the next 55.7 days following tagging and then moved out of the area in the 2004/05 season. In contrast, in the 2005/06 season, half of the detected fish moved out of the area within 14.1 days following tagging; however, 18% of the tagged fish remained for over 100 days after tagging. The residence time in the 2004/05 season was significantly different compared to the 2005/06 season (Breslow-Gehan-Wilcoxon test, P <
0.01) indicating that a difference among inshore- and shelf-migration run seasons. There were also significant differences between the 2006/07 season (inshore-migrating) and 2005/06 season (shelf-migrating) (Breslow-Gehan-Wilcoxon test, P < 0.05). In 2006/07 season, half of the detected fish remained in the area for 47.2 days following tagging, which was longer than the shelf-migrating season in 2005/06. For both inshore-migrating seasons (2004/05 and 2006/07), there was no significant differences between their residence time
curves (Breslow-Gehan-Wilcoxon test, P > 0.05). Residence time (days) at 25%, 50% and 75% within each season are shown Table 2. The median values in inshore-migration seasons (55.7 days in 2004/05, 47.3 days in 2006/07) were clearly longer than the shelf-migration season (14.4 days in 2005/06). In addition, the release month (December and January) did not influence the residence times of the fish (Breslow-Gehan-Wilcoxon test, P > 0.05).
DISCUSSION
The spatial and temporal distribution patterns of juvenile SBT in southern Western Australia could be characterized as two distinctive migration pathways. The majority of age-1 SBT showed a strong association with coastal topographic features (Lumps) in 2004/05 and 2006/07. These inshore-migrating SBT mostly moved between the cross-shelf lines and Lumps, and among the Lumps. Conversely, in 2005/06, shelf-migration of SBT occurred at higher rates not only between cross-shelf lines and Lumps, but also between cross-shelf lines. Moreover, residence times in the survey region were characterized by two temporal patterns related to these spatial migration pathways. The proportion of inshore-migrating SBT that were detected declined progressively with time in the early months of each summer (Dec-Feb), in contrast, shelf-migrating SBT remained on the shelf over a longer period (Dec-Apr) then decreased sharply until about 50% remained in the area.
Thereafter, SBT left the survey area at much slower rate. Therefore, it is evident that there are major interannual spatial (i.e. migration pathways), and temporal (i.e. residence times) variation in juvenile SBT residence. These spatial and temporal differences may contribute to the observed interannual fluctuations in the recruitment abundance indices, given that ARS are conducted in the same survey area every year.
To monitor annual recruitment index of age-1 SBT, ARS has been conducted for several summer seasons (1996/97-2004/05). For instance, in 2004/05 season, the sonar transect survey in the ARS area was conducted between January 14 and February 17, 2005 (Itoh et al.
unpubl. data, 2005). When information from the ARS is combined with the spatial and temporal variation observed from acoustic tagging, it is apparent that most of the tagged fish is moving into coastal waters, and hence 84.5% migrated out of the ARS area. They would thus be ‘hidden’ from the acoustic survey vessel. The recruitment indices calculated
by acoustic data of 2004/05 season were at the lowest level since the 1999/2000 season (Itoh T, unpubl. data, 2005). While it should be noted that there are some issues regarding the reliability of the acoustically recruitment indices based on the detection of SBT schools estimated by sonar specialists (Itoh T and Tsuji S, unpubl. data, 2004), our results based on tagged fish indicates that the majority of 2004/05 SBT migrated mainly inshore (i.e. out of ARS area). Therefore, our results suggest that more fish schools would have been detected if the acoustic survey had included more inshore regions. In 2006/07, the majority of the SBT (65%) also migrated to inshore areas, which is out of the ARS acoustic survey region, in contrast to 2005/06, where only a small proportion (36.7%) of SBT migrated out of the survey region. Thus, an important factor contributing to variation in the abundance indices could be variation in the proportion of the age-1 SBT population migrating within and out of the ARS area. The indices could change on an annual basis as a result of changes in the horizontal distribution of SBT and even with the same total biomass.
The two different patterns of migration observed in this study could be caused by the water masses of different oceanographic features [4]. Fujioka et al. [4] showed that the 2004/05 and 2006/07 seasons were a lack of nutrient-rich sub-Antarctic water on the shelf, in contrast the 2005/06 season, the sub-Antarctic water mass intruded from the continental slope into the subsurface layers, and had higher surface chlorophyll-a concentrations.
Therefore, during such season tagged fish may respond to temporally varying sub-Antarctic water influx, which produces upwelling that in turn would lead to increased abundance of their teleost prey such as sardine and anchovy [15,16].
While large Japanese research vessels (36 m, 315 ton) conducting acoustic surveys has used high performance omni-scan sonar to detect SBT schools in the ARS area, it would be too dangerous for such large vessels to conduct acoustic surveys in the inshore region, as
these coastal waters include unsurveyed topographic features. An alternative method to estimate SBT recruitment indices, proposed by Itoh et al. (unpubl. data, 2005), is based on a troll survey. This involves detection of SBT via troll-capture along a repeated cross-shelf survey line (“piston line”) from Bremer Bay (center of the ARS area) to the shelf break, approximately following Line 2 of the acoustic receivers (see Fig. 1a). These piston line surveys have been conducted since the 2004/05 season (same effort all seasons: 9 round trips off Bremer Bay during January-February). The results of the three summer seasons (2004/05, 2005/06, 2006/07) show an increasing trend in the trolling-based recruitment index (1.20, 2.82, 4.72 (N_school/100km)) over the three seasons (Itoh T, unpubl. data, 2007).However, this trend was different from the tag-based results, which showed the same distribution patterns over the first and third seasons. High proportions of migrating SBT around topographic features in 2004/05 (first) and 2006/07 (third) seasons may result in lower troll catches and lower indices than during the shelf-migration season in 2005/06.
There was no significant difference in the residence times between the inshore-migration seasons. Therefore, these indices could be interpreted to mean that the abundance of age-1 SBT population in 2006/07 substantively increased in levels compared with 2004/05. It is not clear whether the true fish abundance in 2006/07 was higher than in 2005/06, as residence times were significantly different during both seasons. This hypothesis could be verified by conducting studies over several years regarding fisheries data, such as catch trends by purse seine for SBT of ages 2-4 and by longline for SBT over age-3.
This study showed that one of the reasons interannual fluctuations of abundance estimates could be caused by variation in temporal and spatial distribution patterns. It is important to note that the recruitment abundance indices may be underestimated during inshore-migration seasons. In order to minimize the interannual bias, we propose that a
trolling-based recruitment survey should also be carried out at coastal topographic features, and catch information from both across the shelf and the topographic features be combined into an abundance index.
The abundance estimates may also be affected by the peak time of migration through the survey area. In order to correct for variation in the timing of peak population migration across the piston line survey area, the underlying mechanism for the temporal and spatial movement patterns displayed by migratory SBT, perhaps related to oceanographic conditions must be further investigated.
ACKNOWLEDGEMENTS
The assistance and cooperation of Geoff Campbell and the crew of F/V Quadrant and St.
Gerard were greatly appreciated. G. N. Nishihara, Institute for East China Sea Research, Nagasaki University, provided comments that substantially improved the manuscript. The research was supported by Fisheries Research Agency, JAMARC, CSIRO Marine and Atmospheric Research and the Australian Fisheries Management Agency as part of the Japan Australia SBT Recruitment Monitoring Program, and by the Japan Society for the Promotion of Science (16255010), and was part of Japan-Australia Cooperative Research Projects “Marine Science” by the Japan Science and Technology Agency (JST).
REFERENCES
1. Farley JH, Davis TLO (1998) Reproductive dynamics of southern bluefin tuna, Thunnus maccoyii. Fish Bull 96: 223-236
2. Simon PRG, Eric A, Henrik M, Henrik J, Iain MG, Helen MF, Beth ES, Gayle JH, Jonathan S (2006) Variation in the abundance of sandeels Ammodytes marinus off southeast Scotland: an evaluation of area-closure fisheries management and stock abundance assessment methods. ICES J Mar Sci 63: 1530-1550
3. Hobday AJ, Kawabe R, Takao Y, Miyashita K, Itoh T (2009) Correction factors derived from acoustic tag data for a juvenile southern bluefin tuna abundance index in southern Western Australia. In: Nielsen JL, Arrizabalaga H, Fragoso N, Hobday AJ, Lutcavage M, Sibert J. (eds) Methods and Technology in Fish Biology and Fisheries: Tagging and Tracking of Marine Animals with Electronic Devices. Springer, London, pp 405-422 4. Fujioka K, Hobday AJ, Kawabe R, Miyashita K, Honda K, Itoh T, Takao Y (in press)
Interannual variation in summer habitat utilization by juvenile southern bluefin tuna (Thunnus maccoyii) in southern Western Australia. Fish Oceanogr
5. Klimley AP, Holloway CF (1999) School fidelity and homing synchronicity of Yellowfin tuna, Thunnus albacares. Mar Biol 133: 307-317
6. Comeau LA, Campana SE, Castonguay M (2002) Automated monitoring of a large-scale cod (Gadus morhua) migration in the open sea. Can J Fish Aquat Sci 59:
1845-1850
7. Heupel MR, Semmens JM, Hobday AJ (2006) Automated acoustic tracking of aquatic animals: scales, design and deployment of listening station arrays. Mar Freshw Res 57:
1-13
8. Willis J, Hobday AJ (2007) Influence of upwelling on movement of southern bluefin
tuna (Thunnus maccoyii) in the Great Australian Bight. Mar Freshw Res 58:699-708 9. Klimley AP, Jorgensen SJ, Muhlia-Melo A, Beavers SC (2003) The occurrence of
yellowfin tuna (Thunnus albacares) at Espiritu Santo Seamount in the Gulf of California. Fish Bull 101: 684-692
10. Lowe CG, Topping DT, Cartamil DP, Papastamatiou YP (2003) Movement patterns, home range, and habitat utilization of adult kelp bass Paralabrax clathratus in a temperate no-take marine reserve. Mar Ecol Prog Ser 256: 205-216
11. Stark KE, Jackson GD, Lyle JM (2005) Tracking arrow squid movements with an automated acoustic telemetry system. Mar Ecol Prog Ser 299: 167-177
12. Hobday AJ, Campbell G (2009) Topographic preferences and habitat partitioning by pelagic fishes off southern Western Australia. Fish Res 95: 332-340
13. Ohta I, Kakuma S (2005) Periodic behavior and residence time of yellowfin and bigeye tuna associated with fish aggregating devices around Okinawa Islands, as identified with automated receivers. Mar Biol 146: 581-594
14. Harrington DP, Fleming TR (1982) A class of rank test procedures for censored survival data. Biometrika 69: 553-566
15. Young JW, Bradford RW, Lamb TD, Lyne VD (1996) Biomass of zooplankton and micronekton in the southern bluefin tuna fishing grounds off eastern Tasmania, Australia. Mar Ecol Prog Ser 138:1-14
16. Ward TM, Mcleay LJ, Dimmlich WF, Rogers PJ, Mcclatchie S, Matthews R, Manpf J, Ruth PDV (2006) Pelagic ecology of a northern boundary current system: effects of upwelling on the production and distribution of sardine (Sardinops sagax), anchovy (Engraulis australis) and southern bluefin tuna (Thunnus maccoyii) in the GAB. Fish Oceanogr 15:191-207
LIST OF FIGURE TITLES
Figure 1. Research area in southern Western Australia. (a) Locations of acoustic receivers are represented by white circles (Line 1-3: n = 20-21 receivers per line, Lumps: n = 3 receivers on each lump). Receivers were aligned as a ‘curtain’ on the shelf. (b) The area in the black line shows the acoustic recruitment-monitoring survey area (ARS area), the recruitment survey for juvenile southern bluefin tuna by omni-scanning sonar carried out since 1995/96, in the ARS area (dark diagonal area) and out of ARS area (light diagonal area).
Figure 2. Proportion of time spent in and out of the acoustic recruitment-monitoring survey area (ARS area), calculated each movement time of tagged fish between pairs of receivers.
Figure 3. Time series of acoustic detections (represented by dots) for all tagged southern bluefin tuna by VR2 receivers from December 3-5 to March 15-19 in 2004/05 (a), and from December 1-3 to May 9-11 in 2005/06 (b) and from December 1-3 to May 29-31 in 2006/07 (c). VR2 receiver ’s locations and numbers (No.1-20 (Line 1), No. 21-40 (Line 2), No. 41-61 (Line 3) and No.62-70 (Lumps)) are illustrated on Fig.1a.
Figure 4. Kaplan-Meier curves for survival analysis of tagged fish in the survey area during three seasons. The residence time relationship between inshore-migrating seasons (2004/05; open symbols, 2006/07; triangles) and shelf-migrating season (2005/06; closed symbols) were significantly different (Breslow-Gehan-Wilcoxon test, P < 0.05), however no difference was detected among the inshore-migrating seasons (Breslow-Gehan-Wilcoxon test, P > 0.05).
LIST OF TABLES
Table 1 Details of tagged southern bluefin tuna Thunnus maccoyii, for the three seasons (2004/05, 2005/06, 2006/07). Tagging date and the number of tagged fish, FL (fork length), and tagging location recorded for each group tagged.
Season Tagging date
No. of FL cm Mean tagging location tagged fish (Mean ± SD) Latitude Longitude 2004/05 7-Dec-2004 22 56.0 ± 6.0 -34.58 118.99
3-Jan-2005 1 45.0 -35.20 117.95
4-Jan-2005 7 46.6 ± 5.6 -35.18 118.04
5-Jan-2005 15 53.4 ± 6.6 -34.76 118.70 6-Jan-2005 10 50.0 ± 5.2 -34.66 118.83
7-Jan-2005 6 54.2 ± 5.4 -34.65 118.82
8-Jan-2005 13 47.8 ± 2.0 -34.92 119.08
9-Jan-2005 5 48.6 ± 1.3 -34.49 119.42
2005/06 4-Dec-2005 1 45.0 -34.54 119.26
5-Dec-2005 1 45.0 -34.68 118.75
7-Dec-2005 1 67.0 -34.69 118.76
8-Dec-2005 5 44.4 ± 1.1 -35.19 118.00
6-Jan-2006 21 46.0 ± 1.0 -34.85 119.04
7-Jan-2006 2 45.5 ± 0.7 -34.93 118.72
8-Jan-2006 13 46.0 ± 1.2 -34.74 118.83 9-Jan-2006 7 62.3 ± 10.8 -34.63 118.88 10-Jan-2006 30 51.2 ± 3.7 -34.65 118.84 2006/07 4-Dec-2006 17 57.6 ± 2.7 -34.57 118.97 5-Dec-2006 15 58.1 ± 4.2 -34.57 118.97
7-Dec-2006 2 62.0 ± 8.5 -34.66 118.84
8-Dec-2006 1 49.0 -35.17 117.94
Season Tagging date
No. of FL cm Mean tagging location tagged fish (Mean ± SD) Latitude Longitude 9-Dec-2006 18 53.1 ± 3.4 -35.11 116.60
10-Dec-2006 1 54.0 -34.52 115.29
8-Jan-2007 7 57.9 ± 1.8 -34.94 116.08
9-Jan-2007 7 58.6 ± 15.7 -35.20 117.97
11-Jan-2007 1 63.0 -34.57 118.97
12-Jan-2007 15 59.9 ± 2.3 -34.57 118.98
Table 2 Summary of the Kaplan-Meier estimate for survival analysis in three seasons (2004-2007). The residence time (days) are given at 25%, 50%, 75%, respectively.
Residence time (days)
Season No. of SBT 25% 50% 75% Median value Mean value
2004/05 55 32.8 55.7 65.5 55.7 50.2
2005/06 68 5.4 14.1 52.8 14.4 36.3
2006/07 62 11.3 47.2 81.2 47.3 50.3
Table 3 The number of movements of tagged juvenile SBT Thunnus maccoyii recorded between acoustic receivers and the time spent in and out of the acoustic
recruitment-monitoring survey (ARS) area.
2004/05 2005/06 2006/07
Migration route No. of Time (days) No. of Time (days) No. of Time (days) migrations in area out of area migrations in area out of area migrations in area out of area
Line1-Lumps 40 4.4 210.0 30 0.0 139.7 28 0.3 149.2
Line2-Lumps 23 37.6 126.1 14 25.8 48.7 26 72.9 143.7
Line3-Lumps 5 49.3 30.6 2 103.7 12.4 6 83.4 111.0
Line1-Line2 11 101.5 42.3 21 140.4 105.4 8 193.6 77.2
Line2-Line3 8 30.9 38.1 28 529.4 74.7 18 140.9 26.2
Line1-Line3 2 12.7 4.7 2 103.7 12.4 2 17.7 1.9
Between Lumps 88 0.0 287.3 13 0.0 75.1 15 0.0 31.1
Along lines 104 57.7 189.5 158 262.4 189.3 93 94.9 462.6
Between adjacent receivers along lines 79 1.3 51.6 118 94.6 49.5 88 56.6 43.5
Between adjacent receivers in Lumps 2384 0.0 634.8 30 0.0 22.8 378 0.0 179.2
Total 2744 295.3 1615.0 416 1260.0 730.0 662 660.3 1225.6
(a)
34o00’ S
Line 3
Bremer Bay
Esperance
41
0 25 50k
35o00’ S
Line 1
Line 2 Lumps
Albany
20
21
1
40
61
62-64 65-67
68-70
Australia
0 25 50km
(b)
34o00’ S
200 m 1000 m
Esperance
Out of ARS area Research area
Bremer Bay
Acoustic recruitment monitoring Albany
In ARS area
118o00’ E 120o00’ E 122o00’ E
35o00’ S
200 m 1000 m
survey (ARS) area
Figure 1 Fujioka et al.
100 80
tio (%)
60 40
m e spent ra 20
20 0
2004/05 2005/06 2006/07
Ti m
Out
In Out In In Out
Figure 2 Fujioka et al.
(a)
2004/05, n = 27,855 7060 50
LumpsLin
50 40 30 20 10
ne3Line2Line1
2005/06, n = 5,214
(b)
70 60 50 0
LumpsLine1
c ation
40 30 20 10
e3Line2Line1
R eceiver lo c
(c)
2006/07, n = 18,51470 60 50 0
LumpsLine3
R
40 30 20 10 0
3Line2Line1
Figure 3 Fujioka et al.
12/1 1/1 2/1 3/1 4/1 5/1 6/1
0
Date
aremaining in area
100
80
60
2004/05 2005/06 2006/07
ative percentage r 60
40
20
Cumula
Days since fish tagged 0
0 40 80 120 160