九州大学学術情報リポジトリ
Kyushu University Institutional Repository
Computational analysis of interfractional
anisotropic shape variations of the rectum in prostate cancer radiation therapy
モハンマド, ハエカル
http://hdl.handle.net/2324/1959083
出版情報:九州大学, 2018, 博士(保健学), 課程博士 バージョン:
権利関係:© 2018 Associazione Italiana di Fisica Medica. Published by Elsevier Ltd. All rights reserved.
Doctoral Thesis
Computational Analysis of Interfractional Anisotropic Shape Variations of the Rectum in Prostate Cancer Radiation Therapy
Division of Medical Quantum Science, Department of Health Sciences Graduate School of Medical Sciences, Kyushu University
Student ID: 3MD15510N Mohammad Haekal
June 6, 2018
Contents lists available atScienceDirect
Physica Medica
journal homepage:www.elsevier.com/locate/ejmp
Original paper
Computational analysis of interfractional anisotropic shape variations of the rectum in prostate cancer radiation therapy
Mohammad Haekala, Hidetaka Arimurab,⁎, Taka-aki Hirosea, Yusuke Shibayamac, Saiji Ohgab, Junichi Fukunagac, Yoshiyuki Umezuc, Hiroshi Hondab, Tomonari Sasakib
aGraduate School of Medical Sciences, Kyushu University, 3-1-1, Maidashi, Higashi-ku, Fukuoka 812-8582, Japan
bFaculty of Medical Sciences, Kyushu University, 3-1-1, Maidashi, Higashi-ku, Fukuoka 812-8582, Japan
cDepartment of Medical Technology, Kyushu University Hospital, 3-1-1, Maidashi, Higashi-ku, Fukuoka 812-8582, Japan
A R T I C L E I N F O
Keywords:
Point distribution model Prostate cancer radiation therapy Rectum shape variation Rectum overlap region
A B S T R A C T
Purpose:To analyze the uncertainties of the rectum due to anisotropic shape variations by using a statistical point distribution model (PDM).
Materials and methods: The PDM was applied to the rectum contours that were delineated on planning computed tomography (CT) and cone-beam CT (CBCT) at 80 fractions of 11 patients. The standard deviations (SDs) of systematic and random errors of the shape variations of the whole rectum and the region in which the rectum overlapped with the PTV (ROP regions) were derived from the PDMs at all fractions of each patient. The sys- tematic error was derived by using the PDMs of planning and average rectum surface determined from rectum surfaces at all fractions, while the random error was derived by using a PDM-based covariance matrix at all fractions of each patient.
Results:Regarding whole rectum, the population SDs were larger than 1.0 mm along all directions for random error, and along the anterior, superior, and inferior directions for systematic error. The deviation is largest along the superior and inferior directions for systematic and random errors, respectively. For ROP regions, the po- pulation SDs of systematic error were larger than 1.0 mm along the superior and inferior directions. The po- pulation SDs of random error for the ROP regions were larger than 1.0 mm except along the right and posterior directions.
Conclusions:The anisotropic shape variations of the rectum, especially in the ROP regions, should be considered when determining a planning risk volume (PRV) margins for the rectum associated with the acute toxicities.
1. Introduction
Prostate cancer was ranked as thefifth leading cause of death from cancer for men worldwide in 2012[1]. Incidence rates are increasing every year in the developed countries such as United Kingdom and Japan [2]. Several options are available to treat the prostate cancer including radiation therapy which allowed the prostate to be treated with high dose of radiation while sparring surrounding normal tissues [3].
The quality of radiation therapy in prostate cancer treatment is af- fected by high dose regions which could be induced by patient move- ment, internal motion of the organ, and patient set-up errors [4,5].
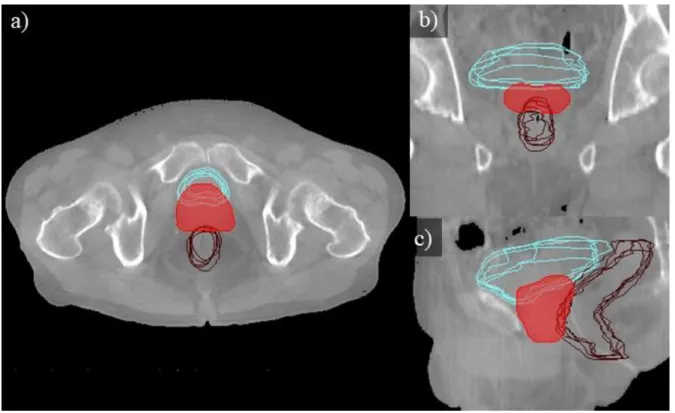
Fig. 1 illustrates the anatomical regions of a rectum, bladder, and planning target volume (PTV) determined by radiation oncologists.
Anterior parts of the rectum may overlap with the PTV due to large
internal margins and/or rectal displacements as shown inFig. 1. The rectal position uncertainties, which could cause toxicities (e.g., rectal bleeding, fecal incontinence), mainly comes from the rectal motion due to the changes in rectalfilling[6–10]. The two common methods used to study the rectal motion were tracking the changes in rectal volume and evaluating the translation and rotation errors of the rectum [5,11–13]. Fontenla et al.[14], however, noted that the more complex problem of internal organ motion involve changes in the shape (shape variations) of the organ especially along the anterior direction of the rectum[5,15]. Therefore, the shape variations of the rectum, especially along the anterior direction, need to be investigated.
In order to dealt with the position uncertainties of the organs at risks (OARs), the International Commission on Radiation Units and Measurements (ICRU) reports no. 62[16]and 83[17]introduced the concept of planning risk volume (PRV) margins. In the case of prostate
https://doi.org/10.1016/j.ejmp.2017.12.019
Received 21 June 2017; Received in revised form 23 November 2017; Accepted 23 December 2017
⁎Corresponding author at: Division of Medical Quantum Science, Department of Health Sciences, Faculty of Medical Sciences, Kyushu University, 3-1-1, Maidashi, Higashi-ku, Fukuoka 812-8582, Japan.
E-mail address:[email protected](H. Arimura).
Physica Medica 46 (2018) 168–179
1120-1797/ © 2018 Associazione Italiana di Fisica Medica. Published by Elsevier Ltd. All rights reserved.
T
cancer radiation therapy, the use of PRV dose-volume histograms (DVHs) is recommended to predict acute rectal toxicity [15,18,19].
“Recipes”to determine the uniform PRV margins have been developed by McKenzie et al. and Stroom and Heijmen [20,21]. However, the uniform PRV margins are inadequate to represent the actual rectal variations during treatment, as noted by McKenzie et al. [20]and Prabhakar et al. [22]. Therefore, an application of anisotropic PRV margins of the rectum should be considered.
There have been three studies that dealt with the shape variations of the rectum. Hoogeman et al.[23]analyzed the quantification of local rectal wall displacements by calculating local systematic and random errors of the rectum along three directions where they unfolded the outer surface of the delineated rectal wall and projected the 3-space coordinates of each surface element to a 2D map. Sohn et al.[24]in- vestigated the correlated motion of adjacent organ structures between prostate, bladder and rectum which were parametrized by using sets of corresponding surface points and calculated the displacements between surface points at each fraction. They did not calculate the systematic and random errors that could be used in determining anisotropic PRV margins. Brierley et al.[25]investigated the determination of the PTV based on the rectal shape variations by usingfinite element modeling.
They did not investigate the geometric errors related to the determi- nation of PRV margins.
None of the previously mentioned studies, including ICRU, in- vestigated directly the shape variations of the rectum along each ana- tomical direction separately (anterior, posterior, superior, inferior, left and right). The investigation along separate anatomical directions is indispensable for determining the anisotropic PRV margins. There have been also no studies on the systematic and random errors of the region in which the rectum overlapped with the PTV along the anterior wall (ROP regions), even though the shape variations of the ROP regions may cause the regions to be included in high dose distributions which can lead to rectum toxicities. Therefore, this study aims to investigate the anisotropic shape variations of the rectum and the ROP regions for
prostate cancer radiation therapy along separate anatomical direction (anterior, posterior, superior, inferior, left and right).
2. Material and methods 2.1. Clinical study
This study was performed with the approval of the Institutional Review Board of our university hospital. The clinical data used in this study were obtained from 11 patients (range: 60–75 years; median age:
64 years; stage: T1-T3a, N0, M0), who had undergone intensity modu- lated radiation therapy (IMRT) for prostate cancer. The planning CT images were acquired from a CT scanner (Mx 8000, Philips, Amsterdam, Netherlands) with 512 × 512-pixel dimensions, 0.98 mm in-plane pixel size, and 2.0 mm slice thickness. Each patient received a dose of 76 Gy at 38 fractions using an accelerating voltage of 10 MV on a linear accelerator (Varian Medical Systems Inc., Palo Alto, USA).
The analyses of systematic and random errors of interfractional anisotropic shape variations of the rectum were derived from contours delineated on the planning CT and cone-beam CT (CBCT) images at 80 fractions of 11 patients. CBCT scans were performed just before irra- diation at 5–9 fractions (mean: 7.3) of each patient. The CBCT data were used for correcting target localization at each fraction and only acquired at the beginning of the week to reduce the dose received by the patients. A kilovoltage CBCT scanner (On-Board-Imager, Varian Medical Image Systems Inc., Palo Alto, USA) was used to perform the scans which produced images with 384 × 384 pixel dimensions, 1.17 mm in-plane pixel size, and 2.5 mm slice thickness. The delinea- tions of the rectum contours were based on a consensus between a ra- diation oncologist (S.O.) and a medical physicist (T.H.) using a com- mercially available radiation treatment planning (RTP) system (Eclipse version 6.5 and 8.1; Varian Medical Systems Inc., Palo Alto, USA).
2.2. Pre-processing
The original planning CT and CBCT images were converted into isotropic images with an isovoxel size of 1.17 mm using a cubic inter- polation method. The rectum structures delineated on both planning CT and CBCT images were also extracted and converted using a shape- based interpolation method[26].
In this study, we focused on the errors introduced by the inter- fractional organ motions of the rectum. To reduce the effect of in- traobserver variation and delineation artifacts in the calculation[24], uniform-length rectums were used for all cases. The reference length was equal to the shortest length (7 cm) of a rectum between starting and ending slices (around anus to sigmoid positions) delineated on the CBCT images among all cases[27].
2.3. Calculation of errors due to shape variations
This study evaluated the local errors of the shape variations by dealing with them separately along each axis, as illustrated inFig. 2.
Thex, y, andz axes are each separated along their positive and ne- gative directions corresponding to the anterior, posterior, superior, in- ferior, left and right directions. The local errors were calculated as the displacements of position vectors at points on 3D surfaces of the rectum (Fig. 3). The rotation errors of the rectum were included as shape variations since the errors also introduced the displacements of the surface points[28].
The flowchart to calculate errors due to shape variations from planning CT and CBCT images were described inFig. 3. First, all rec- tums were registered using a centroid matching technique. Then, the surfaces of the registered rectums were triangulated using a marching cubes algorithm to obtain 3D surfaces of the rectum[29]. The produced surfaces consisted of many vertices, which were reduced to a similar number of vertices (∼1000) using a quadric error metric method[30].
Fig. 1.An illustration of the anatomical regions of a rectum (green), bladder (yellow), and PTV (red) determined by radiation oncologists. Note that parts of the rectum and the bladder were overlapped with the PTV which could cause high-dose exposure to both OARs. (For interpretation of the references to colour in thisfigure legend, the reader is referred to the web version of this article.)
M. Haekal et al. Physica Medica 46 (2018) 168–179
169
Thin plate spline robust point matching (TPS-RPM) algorithm was ap- plied to determine the correspondences between two surface structures.
TPS-RPM algorithm is a non-rigid point matching algorithm that minimizes the distances between two point sets based on deterministic annealing and softassign algorithms. The general idea of the algorithm is to incorporate the thin-plate spline as a non-rigid mapping method to the robust point matching algorithm which is known to be only using affine and piecewise-affine mappings[31]. LetXbe a set of points from
a source surface consisting of { }xa where
= …
a H H
( 1, 2, , ; : number of points)which correspondences withV, a set of points from a target surface consisting of { }vb where
= …
b D D
( 1, 2, , ; : number of points), are to be determined. The map- ping of a pointxato a new location by a non-rigid transformation is represented by a general function f. The goal of the TPS-RPM is to minimize the following cost function based on the mapping function
f x( )a between corresponding sets{ }xa and{ }vb:
∑ ∑ − +
= =
z v f x λ f
min ‖ ( )‖ ‖ ‖ ,
Z f b
D
a H
ab b a
, 1 1
2 2
(1) whereZis the correspondence matrix consisting of {zab},‖ ‖f is the L2 norm,λis the hyper-parameter that trades offbetween the registration
and regularization off, and‖ ‖f 2is the TPS regularizer which calculates the bending cost off and acts as a smoothness measure[31,32].
The geometrical errors of the rectum were classified into systematic and random errors [33,34]. The systematic and random errors for a group of similar patients can be described by using the standard de- viations (SDs)[17,33]. In this study, the systematic error of a patient due to the shape variations was defined as the average deviation of a reference rectum from the planning rectum surface. The term“plan- ning”rectum surface refers to the rectum surfaces derived from rectum structures on planning CT, while“reference”rectum surface refers to the average rectum surface determined from rectum surfaces at all fractions. The algorithm to construct a reference surface was described in a paper by Shibayama et al.[28]. On the other hand, the random error of a patient was defined as the SDs of the daily deviations of the rectum surface at each fraction from the reference rectum surface [17,35–37].
2.3.1. Systematic error
Fig. 4(a) illustrates the point distribution image of all the vertices on the reference rectum. To obtain the SDs of the systematic and random errors due to shape variations along each direction, the rectum was split into two halves (anterior and posterior regions, left and right regions, Fig. 2.Illustrations of anatomical directions describing rectum orientation. The“x”,“y”and“z”axes correspond to the right-left (RL), anterior-posterior (AP) and inferior-su- perior (IS) directions, respectively.
M. Haekal et al. Physica Medica 46 (2018) 168–179
170
Fig. 3.Aflowchart to calculate systematic and random er- rors of the rectum due to shape variations using a statistical point distribution models (PDMs).
Fig. 4.Point distributions images consisting of reference rectum vertices which are used to evaluate shape variations viewed from RL direction: (a) the PDM of whole vertices while, (b) only the anterior part of the rectum vertices split at the centroid remains to be used in evaluating the shape variations along the anterior direction.
M. Haekal et al. Physica Medica 46 (2018) 168–179
171
superior and inferior regions) with respect to its centroid, depending on which direction was evaluated. The example is shown in Fig. 4(b), where the anterior half vertices were used to calculate the SDs of the systematic and random errors along the anterior direction.
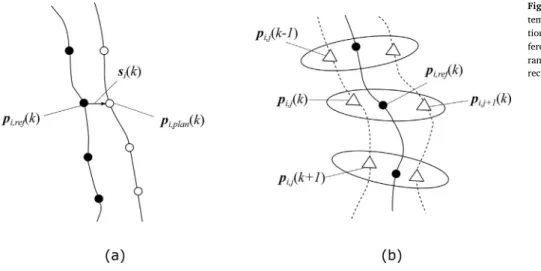
Fig. 5 illustrates the determinations of the local systematic and random errors due to the shape variations. LetRi ref, be the reference rectum of thei-th patient (i=1, 2, …, ;N N:number of patients) which corresponded with the rectum at each fraction. Accordingly, the vector pi j,( )k of thek-th vertex (k=1, 2, …,M M; :number of vertices) of the rectum at the j-th fraction (j=1, 2, …, ;F F:number of fractions) of the i-th patient is corresponded to the vector of the k-th vertex (pi ref, ( )k =(pi ref x, , ( ),k pi ref y, , ( ),k pi ref z, , ( ))k T) at the reference rectum.
The correspondence between the 3D vector at the k-th vertex (pi plan, ( )k =(pi plan x, , ( ),k pi plan y, , ( ),k pi plan z, , ( ))k T) on the planning rectum Ri plan, and the vector of thek-th vertexpi ref, ( )k on the reference rectum
Ri ref, was determined in a similar way. The local systematic errorsi( )k
can be calculated as
= − =
si( )k pi ref, ( )k pi plan, ( )k (si x, ( ),k si y,( ),k si z. ( )) ,k T (2) wheresi x, ( )k,si y, ( )k andsi z. ( )k represent thex,yandzcomponents of the local systematic error vector in the inquired half, respectively. The average deviationεSV, ,i Afor a patient along the anterior direction, in this study, can be calculated as[21,37–39]
∑
=
=
ε M1 s k
i A ( ).
A k M
i y SV, ,
1 , A
(3) Here,MAdenotes the number of vertices in the anterior half of the rectum surfaces. Then, the population SD for all patients along the anterior direction can be obtained by[33,37–39]
∑
= −
=
ε N1 ε ε
( ) ,
A i
N
i A A
SV,
1
SV, , SV, 2
(4) where
∑
=
=
ε N1 ε
A .
i N
i A SV,
1 SV, ,
(5) The population SD of the systematic error along the other directions were also calculated in a same way. The SDs of the local systematic errorτ ki( )at each vertex were calculated as
= + +
τ ki( ) si x,2( )k si y( )k si z( ) .k
,2 2,
(6)
2.3.2. Random error
The SDs of the interfractional random error due to shape variations were calculated by using a PDM-based covariance matrix. Let a point
distribution column vectorqi j, of rectumRi j, given by the elements of pi j,( )k be
= … … …
qi j, (pi j x, , (1), ,pi j x, , (M),pi j y, ,(1), ,pi j y, ,(M),pi j z, ,(1), ,pi j z, , (M)) .T (7) The covariance matrix at all fractions of thei-th patient can be obtained by calculating
∑
= − −
=
V q q q q
F
1 ( )( ) ,
i j
F
i j i i j i
1
, , T
(8) where
∑
=
=
q q
F
1 .
i j
F i j 1
, (9)
Here, the termqi denotes the mean vector ofqi j,. The covariance matrixVi consisted of diagonal elements which represent the square of SDs (variance) of the local random error at each vertex of the rectum.
These elements can be defined as
= … … …
v
σ σ M σ σ M σ σ M
( (1), , ( ), (1), , ( ), (1), , ( )) .
i
i x i x i y i y i z i z
SV, SV, ,2
SV, ,2
SV, ,2
SV, ,2
SV, ,2
SV, ,2 T
(10) The variances on all vertices of the rectum were used to calculate the individual SD of the random error along each direction. The in- dividual SD of a patient along the anterior direction (σSV, ,i A) can be calculated as
∑
=
=
σ M1 σ k
( ) ,
i A
A k M
i y SV, ,
1 SV, ,2 A
(11) whereσSV, ,i y( )k denotes the local SD of the random error in the anterior half of the rectum and MA represents the number of vertices in the anterior half. The population SD of random error for all patients along the anterior direction (σSV,A) is defined as the root-mean-square (RMS) of the individual SDs of each patient in the group and calculated by [33,38,39]
∑
=
=
σ N1 σ
A .
i N SV, i A
1 SV, ,2
(12) The population SDs along the other directions (left, right, posterior, superior, and inferior) can be obtained using the same method. The SDs of the local random error on thek-th vertex (σSV,i( )k) were calculated as
= + +
σSV,i( )k σSV, ,2 i x( )k σ i y( )k σ i z( ) .k
SV, ,2
SV, ,2
(13) Fig. 5.Illustrations of the determinations of local sys- tematic error and local random error due to shape varia- tions: (a) local systematic error was calculated between re- ference rectum (●) and planning rectum (○), while (b) local random error was calculated between reference rectum and rectum at each fraction (△).
M. Haekal et al. Physica Medica 46 (2018) 168–179
172
2.4. Calculation of errors at ROP regions
The regions in which the rectum overlapped with the PTV along the anterior wall (referred to as ROP regions) may be included in high-dose distributions which could lead to rectum toxicities such as rectal bleeding[19]. Therefore, the shape variations of the ROP regions were analyzed to improve the determination of the anisotropic PRV margins.
The vertices of the rectum which were detected to be inside the PTV were selected. Then, the calculation of errors was conducted using si- milar principles described in Section2.3.
2.4.1. Determination of ROP regions
The overall procedure for determining the ROP regions of the rectum is described in Fig. 6. The determination of correspondence between rectum at each fraction and a reference rectum will produce the corresponding rectumRi ĵ,, where jrepresents the fraction number
(j=1,2, , ; :number of fractions)…F F of the i-th patient (i=1,2, , ; :number of patients). A reference PTV…N N Ti of each patient was constructed by selecting the overlapped pixels between each PTV binary images at all fractions.
The overlapped vertices of the rectumROV, ,̂ i jat the j-th fraction of the i-th patient were identified by finding the vertices whose co- ordinates were identical with those of the reference PTVTi. The process can be intuitively described as
̂ ̂= ∩
ROV, ,i j Ri j, T,i (14)
Then, an ROP region at each fraction of a patient can be obtained by selecting overlapped vertices that have correspondences at all fractions as illustrated inFig. 7.
Fig. 6.Aflowchart to calculate systematic and random errors of rectum-overlapped-with-PTV (ROP) regions due to shape variations using a statistical point distribution models (PDMs).
M. Haekal et al. Physica Medica 46 (2018) 168–179
173
2.5. Dose evaluation study
In order to demonstrate the impacts of the proposed method on prostate cancer treatment, the treatment plans with an anisotropic PRV margin were designed as simulations on the CBCT images to calculate the dose evaluation indices, CTVD98andV75,V70,V65,V60, andV40of the rectum.D98was defined as the percentage of dose received by 98% of CTV, whileVxwas defined as the rectum volume receivingxGy. These dose evaluation indices were selected sinceV70 andV75for the rectum were associated with Grade 2 or higher complications [40], while in another reportsV65for the rectum was also associated with late toxicity [41–43]andV40−V60for the rectum were found to be more relevant to the occurrence of severe late rectal bleeding[44,45]. Four new cases were employed as test cases for validation of the PRV margin de- termined based the shape variations, which were obtained by the pro- posed method in this study. The anisotropic PRV margin was derived along each direction by using the McKenzie’s margin recipe of
+
ε σ
1.3 0.5 to the rectum[20]. Here,εandσdenote the population SDs of the systematic (Eq.(4)) and random errors (Eq.(12)) of the rectum, respectively, which were calculated by the proposed method. The test cases were treated with IMRT with a total number of 21 fractions. A treatment plan based on the PRV margin was generated for each patient by applying plan constraints to the rectum PRV using a commercially available RTP system (Eclipse version 10.0; Varian Medical Systems Inc., Palo Alto, USA). The constraints were V70<5%, V65<10%,
<
V60 20%, and V40<40%, which are based on QUANTEC re- commendations to have been used in clinical practice[44,46]. A Wil- coxon signed-rank test was employed to compute the statistical
difference between dose evaluation indices in original and PRV-based plans.
3. Results
Fig. 8shows the population SDs of the systematic and random errors of the rectum due to shape variations along each anatomical direction of all patients. The population SDs for systematic errors were 0.6 mm along the left direction, 0.3 mm along the right direction, 1.0 mm along the anterior direction, 0.7 mm along the posterior direction, 2.1 mm along the inferior direction and 2.4 mm along the superior direction.
The population SDs for random errors were 1.2 mm along the left di- rection, 1.2 mm along the right direction, 1.6 mm along the anterior direction, 1.6 mm along the posterior direction, 1.9 mm along the in- ferior direction and 1.7 mm along the superior direction.
Fig. 9shows the comparisons of the population SDs for shape var- iations between the whole rectum and the ROP regions along each di- rection. For systematic errors of the ROP regions, the population SDs were smaller along all directions except along the left and right direc- tions compared with the population SDs of the whole rectum. For random errors of the ROP regions, only the population SDs along the left direction was not changed, while along the other directions the population SDs were smaller compared with population SDs of the whole rectum. The population SDs was shown along the posterior di- rection indicating that the ROP regions were not limited to the anterior side of the rectum.
The population SDs of systematic errors for the ROP regions were 0.8 mm along the left direction, 0.8 mm along the right direction, 0.9 mm along the anterior direction, 1.9 mm along the inferior direction and 1.3 mm along the superior direction. The population SDs of random errors for ROP regions were 1.1 mm along the left direction, 0.8 mm along the right direction, 1.1 mm along the anterior direction, 0.1 mm along the posterior direction, 1.8 mm along the inferior direction and 1.6 mm along the superior direction.
In summary, the population SDs of the random errors for the whole rectum along all directions were larger than 1.0 mm. On the other hand, the population SDs of the systematic errors for the whole rectum were smaller than 1.0 mm along the posterior, left, and right directions. The deviations along the superior direction was largest for the systematic errors, while the deviation along the inferior direction was largest for the random errors. The population SDs of systematic errors for the ROP regions were larger than 1.0 mm along the superior and inferior di- rections, while the population SDs of random errors for the ROP regions were larger than 1.0 mm except along the right and posterior directions.
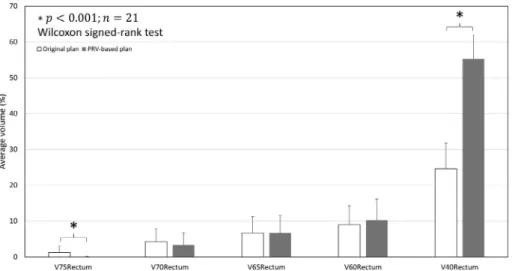
Fig. 10shows the comparison of average dose evaluation indices between original and PRV-based plans for the 4 test patients. TheV75for the rectum in PRV-based plans was significantly smaller (p < .001) than those of the original plans. However, theV40for the rectum in PRV- based plans was significantly larger (p < .001) than those of the ori- ginal plans. On the other hand, theD98to the CTV showed no statistical significant difference between original and PRV-based plans (p > .001).
4. Discussion
The deviation along the superior, inferior, and anterior directions were dominant for systematic and random errors. Brierley et al. and Nuyttens et al.[25,47]noted similar observations of large deviations along superior and inferior directions of the rectum. The deviations were affected largely by the variabilities of other organ proximal to the rectum such as small bowel[47].
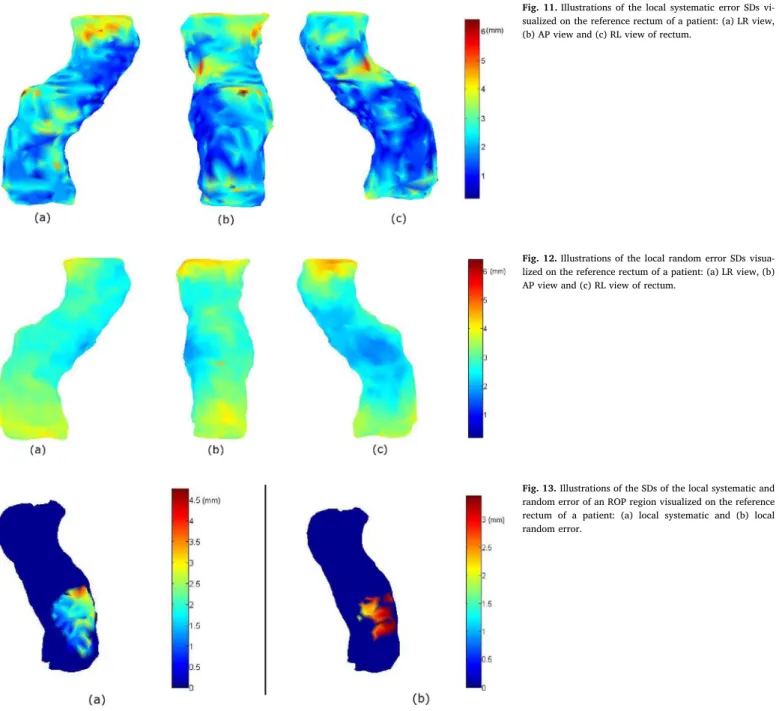
Figs. 11 and 12illustrate the SDs of the local systematic and random errors visualized on the reference rectum for a patient. The calculations of the magnitudes of the local systematic errors and local random errors were performed by using Eqs.(6) and (13), respectively. Large varia- tions (> 3.0 mm) occurred in the upper-left and the upper-anterior Fig. 7.An illustration of the determination of the ROP regions of the rectum. An over-
lapped vertex (●) would be included as ROP region (red border) if the correspondences with other overlapped vertices at all fractions were found. (For interpretation of the re- ferences to colour in thisfigure legend, the reader is referred to the web version of this article.)
M. Haekal et al. Physica Medica 46 (2018) 168–179
174
sides of the rectum for systematic errors. For random errors, beside the upper-left and upper-anterior sides, the lower-left and lower-anterior side of the rectum also had variations larger than 3.0 mm. Hoogeman et al.[23]reported that their study also resulted in the largest varia- tions occurred in the upper-anterior side of the rectum and uniformly distributed in the lower half of the rectum for random errors. The smaller variations in the posterior side of the rectum were indicating
the possibilities of the sacrum limiting rectal wall movement. The various SDs distributed on the rectum surface, as visualized inFigs. 11 and 12, showed that our method had more advantage in analyzing rectum shape variations than volume-based methods since our method considered every voxel on the surface in the calculation.
Fig. 13(a) and (b) illustrate the SDs of the local systematic and random errors of ROP region visualized on the reference rectum for a Fig. 8.The population SDs in mm of (a) systematic errors and (b) random errors of all patients due to shape variations along each anatomical direction.
Fig. 9.The population SDs in mm of whole rectum and ROP regions of the rectum: (a) systematic errors and (b) random errors of all patients due to shape variations along each direction.
Fig. 10.Comparisons of average dose evaluation indices of the rectum (rectumV75,V70,V65,V60, andV40) between ori- ginal and PRV-based plans.
M. Haekal et al. Physica Medica 46 (2018) 168–179
175
patient. Large variation (> 3.0 mm) for systematic errors occurred in the upper part of the ROP regions. On the other hand, the variations (> 2.0 mm) were uniformly distributed in the ROP regions for random errors. Aside from rectal gas and peristalsis activity[28], the lower part of the rectum was also suggested to be affected from the contraction and relaxation of the muscle system of the pelvicfloor[23]. Variation larger than 3.0 mm in the ROP regions indicated that more portions of the rectum were exposed by the high dose region, consequently in- creasing the chance of acute toxicity in the rectum[19].
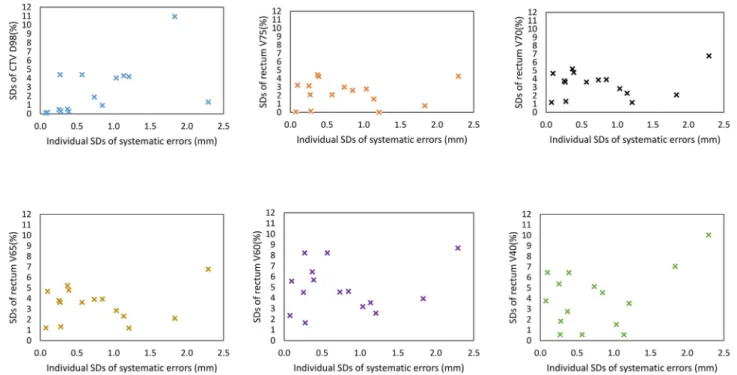
Figs. 14 and 15 show the relationships between the SDs of dose evaluation indices and the individual SDs of systematic and random errors of rectum shape variations along the anterior direction, respec- tively. These results indicate that rectum shape variations affected variations of dose evaluation indices, but there were no statistical sig- nificances between them along all directions (p > .05, Pearson corre- lation test).
The high dose to the ROP regions and large regions receiving low doses need to be studied in details to reduce rectum late toxicities and late gastrointestinal (GI) quality of life (QOL) in IMRT for prostate
cancer in future studies. The ROP region is defined as the region in which the rectum overlapped with the PTV along the anterior wall and may be included in high-dose distribution. Chennupati et al.[42]re- ported that a high dose to the anterior rectal wall was associated with a low scoring of late GI QOL. On the other hand, as for large regions receiving low doses, dose constraints such asV40<65–80% were re- commended to reduce the incidence rate of fecal incontinence to1–2%
[48]. SinceV40obtained by the proposed method was smaller than 60%
, the risk of fecal incontinence may be negligible for the cases used in this study.
The smaller population SDs of the ROP regions than for the whole rectum may be used to improve the anisotropic PRV margins used in prostate cancer radiation treatment. A large margin for PRV of parallel organs such as the rectum could become problem if the PRV is used for dose evaluation and criteria determination[21]. Since the rectal motion was reported to be occurring mainly along the anterior direction[5,15], the solution for providing a more compact margin can be obtained by deriving the PRV margins from the errors of the ROP regions especially along the anterior direction. By deriving the PRV margins based on the Fig. 11.Illustrations of the local systematic error SDs vi- sualized on the reference rectum of a patient: (a) LR view, (b) AP view and (c) RL view of rectum.
Fig. 12.Illustrations of the local random error SDs visua- lized on the reference rectum of a patient: (a) LR view, (b) AP view and (c) RL view of rectum.
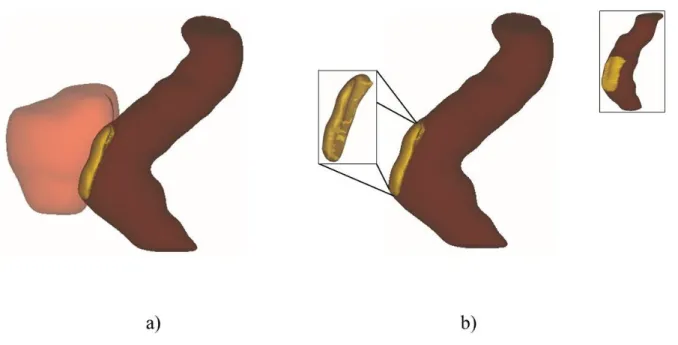
Fig. 13.Illustrations of the SDs of the local systematic and random error of an ROP region visualized on the reference rectum of a patient: (a) local systematic and (b) local random error.
M. Haekal et al. Physica Medica 46 (2018) 168–179
176
errors of the ROP regions, a smaller margin can be produced without neglecting the variations of the rectum wall proximal to the high-dose regions. Smaller margins have also been indicated to be useful in pre- dicting late morbidity of the rectum[49].
There are some limitations in this study. A larger number of cases is necessary to improve the statistical estimation of shape variations of the rectum. Since the TPS-RPM does not consider preserving the geome- trical features of the surface, a more advanced correspondence de- termination method such as free-form deformation (FFD) used in self- organizing deformable model (SDM) would also enhance the precision of the calculation of errors [50,51]. Nevertheless, this study will be useful as a means to study the shape variations of the rectum. The
results are envisioned as a means to derive anisotropic PRV margins for the rectum which can be utilized for general RTP systems.
5. Conclusions
An analysis of interfractional anisotropic rectum shape variations using a statistical PDM in a computational framework has been pre- sented. The population SDs for the whole rectum calculated by the proposed method were larger than 1.0 mm along all directions for random errors, while for systematic errors the population SDs were smaller than 1.0 mm along the posterior, left, and right directions. The population SDs of systematic errors for ROP regions calculated by the Fig. 14.Relationships between the SDs of dose evaluation indices and the individual SDs of systematic errors of rectum shape variations for 15 cases along the anterior direction.
Fig. 15.Relationships between the SDs of dose evaluation indices and the individual SDs of random errors of rectum shape variations for 15 cases along the anterior direction.
M. Haekal et al. Physica Medica 46 (2018) 168–179
177
proposed method were larger than 1.0 mm along the superior and in- ferior directions. The population SDs of random errors calculated by the proposed method for the ROP regions were larger than 1.0 mm except along the right and posterior directions. The results suggest that the anisotropic shape variations analysis, especially in the ROP regions, should be considered when determining a PRV margins for the rectum associated with the acute toxicities.
Conflict of interest statement
None.
Acknowledgements
The authors would like to send the utmost gratitude to all members in Arimura laboratory, which had contribute a great deal of efforts in the performance of this study.
Appendix A. Supplementary data
Supplementary data associated with this article can be found, in the online version, athttp://dx.doi.org/10.1016/j.ejmp.2017.12.019.
References
[1] Chen R, Ren S, Yiu MK, Fai NC, Cheng WS, Ian LH, et al. Prostate cancer in Asia: a collaborative report. Asian J Urol 2014;1:15–29.http://dx.doi.org/10.1016/j.ajur.
2014.08.007.
[2] Torre LA, Bray F, Siegel RL, Ferlay J, Lortet-Tieulent J, Jemal A. Global cancer statistics, 2012. CA Cancer J Clin 2015;65:87–108.http://dx.doi.org/10.3322/caac.
21262 [doi].
[3] Denmeade SR, Isaacs JT. A history of prostate cancer treatment. Nat Rev Cancer 2002;2:389–96.http://dx.doi.org/10.1038/nrc801.
[4] Langen KM, Jones DTL. Organ motion and its management. Int J Radiat Oncol Biol Phys 2001;50:265–78.http://dx.doi.org/10.1016/S0360-3016(01)01453-5.
[5] Muren LP, Ekerold R, Kvinnsland Y, Karlsdottir À̀, Dahl O. On the use of margins for geometrical uncertainties around the rectum in radiotherapy planning. Radiother Oncol 2004;70:11–9.http://dx.doi.org/10.1016/j.radonc.2003.11.013.
[6] Lebesque JV, Bruce AM, Guus Kroes AP, Touw A, Shouman T, van Herk M. Variation in volumes, dose-volume histograms, and estimated normal tissue complication probabilities of rectum and bladder during conformal radiotherapy of T3 prostate cancer. Int J Radiat Oncol Biol Phys 1995;33:1109–19.http://dx.doi.org/10.1016/
0360-3016(95)00253-7.
[7] Roeske JC, Forman JD, Mesina CF, He T, Pelizzari CA, Fontenla E, et al. Evaluation of changes in the size and location of the prostate, seminal vesicles, bladder, and rectum during a course of external beam radiation therapy. Int J Radiat Oncol Biol Phys 1995;33:1321–9.http://dx.doi.org/10.1016/0360-3016(95)00225-1.
[8] Zelefsky MJ, Fuks Z, Happersett L, Lee HJ, Ling CC, Burman CM, et al. Clinical experience with intensity modulated radiation therapy (IMRT) in prostate cancer.
Radiother Oncol 2000;55:241–9.http://dx.doi.org/10.1016/S0167-8140(99) 00100-0.
[9] Zelefsky MJ, Fuks Z, Hunt M, Yamada Y, Marion C, Ling CC, et al. High-dose in- tensity modulated radiation therapy for prostate cancer: early toxicity and bio- chemical outcome in 772 patients. Int J Radiat Oncol Biol Phys 2002;53:1111–6.
http://dx.doi.org/10.1016/S0360-3016(02)02857-2.
[10] Foppiano F, Fiorino C, Frezza G, Greco C, Valdagni R. The impact of contouring uncertainty on rectal 3D dose-volume data: results of a dummy run in a multicenter trial (AIROPROS01-02). Int J Radiat Oncol Biol Phys 2003;57:573–9.http://dx.doi.
org/10.1016/S0360-3016(03)00659-X.
[11] Zelefsky MJ, Crean D, Mageras GS, Lyass O, Happersett L, Clifton Ling C, et al.
Quantification and predictors of prostate position variability in 50 patients eval- uated with multiple CT scans during conformal radiotherapy. Radiother Oncol 1999;50:225–34.http://dx.doi.org/10.1016/S0167-8140(99)00011-0.
[12] van Herk M, Bruce A, Guus Kroes AP, Shouman T, Touw A, Lebesque JV.
Quantification of organ motion during conformal radiotherapy of the prostate by three dimensional image registration. Int J Radiat Oncol Biol Phys
1995;33:1311–20.http://dx.doi.org/10.1016/0360-3016(95)00116-6.
[13] Rijkhorst EJ, Lakeman A, Nijkamp J, de Bois J, van Herk M, Lebesque JV, et al.
Strategies for online organ motion correction for intensity-modulated radiotherapy of prostate cancer: prostate, rectum, and bladder dose effects. Int J Radiat Oncol Biol Phys 2009;75:1254–60.http://dx.doi.org/10.1016/j.ijrobp.2009.04.034.
[14] Fontenla E, Pelizzari CA, Roeske JC, Chen GT. Using serial imaging data to model variabilities in organ position and shape during radiotherapy. Phys Med Biol 2001;46:2317–36.http://dx.doi.org/10.1088/0031-9155/46/9/304.
[15] Dias RS, Giordani AJ, Souhami L, Segreto RA, Segreto HRC. Rectal planning risk volume correlation with acute and late toxicity in 3-dimensional conformal radia- tion therapy for prostate cancer. Technol Cancer Res Treat 2011;10:585–90.
[16] International Commission on Radiation Units and Measurements. ICRU Report 62.
Prescribing, Recording, and Reporting Photon Beam Therapy (Supplement to ICRU Report 50). J ICRU 1999: Ix +52. doi: 10.1259/bjr.74.879.740294.
[17] ICRU. Prescribing, Recording and Reporting Photon-Beam Intensity Modulated Radiation Therapy (IMRT) (ICRU Report 83). vol. 10. 2010. doi: 10.1093/jicru/
ndq025.
[18] Muren LP, Karlsdottir Á, Kvinnsland Y, Wentzel-Larsen T, Dahl O. Testing the new ICRU 62“planning organ at risk volume”concept for the rectum. Radiother Oncol 2005;75:293–302.http://dx.doi.org/10.1016/j.radonc.2005.03.007.
[19] Prabhakar R, Oates R, Daryl J, Chang J, Geso M, Cramb J. Rectal complication probability from composite volumes derived from daily cone beam computed to- mography in prostate cancer radiotherapy. J Cancer Res Ther 2016;12:374–8.
http://dx.doi.org/10.4103/0973-1482.174529.
[20] McKenzie A, Van Herk M, Mijnheer B. Margins for geometric uncertainty around organs at risk in radiotherapy. Radiother Oncol 2002;62:299–307.http://dx.doi.
org/10.1016/S0167-8140(02)00015-4.
[21] Stroom JC, Heijmen BJM. Limitations of the planning organ at risk volume (PRV) concept. Int J Radiat Oncol 2006;66:279–86.http://dx.doi.org/10.1016/j.ijrobp.
2006.05.009.
[22] Prabhakar R, Oates R, Jones D, Kron T, Cramb J, Foroudi F, et al. A study on planning organ at risk volume for the rectum using cone beam computed tomo- graphy in the treatment of prostate cancer. Med Dosim 2014;39:38–43.http://dx.
doi.org/10.1016/j.meddos.2013.09.003.
[23] Hoogeman MS, Van Herk M, De Bois J, Muller-Timmermans P, Koper PCM, Lebesque JV. Quantification of local rectal wall displacements by virtual rectum unfolding. Radiother Oncol 2004;70:21–30.http://dx.doi.org/10.1016/j.radonc.
2003.11.015.
[24] Sohn M, Birkner M, Yan D, Alber M. Modelling individual geometric variation based on dominant eigenmodes of organ deformation: implementation and evaluation.
Phys Med Biol 2005;50:5893–908.http://dx.doi.org/10.1088/0031-9155/50/24/
009.
[25] Brierley JD, Dawson LA, Sampson E, Bayley A, Scott S, Moseley JL, et al. Rectal motion in patients receiving preoperative radiotherapy for carcinoma of the rectum.
Int J Radiat Oncol Biol Phys 2011;80:97–102. doi: S0360-3016(10)00142-2 [pii]
10.1016/j.ijrobp.2010.01.042.
[26] Herman GT, Zheng J, Bucholtz CA. Shape-based interpolation. IEEE Comput Graph Appl 1992;12:69–79.http://dx.doi.org/10.1109/38.135915.
[27] Hoogeman MS, van Herk M, Yan D, Boersma LJ, Koper PCM, Lebesque JV. A model to simulate day-to-day variations in rectum shape. Int J Radiat Oncol Biol Phys 2002;54:615–25.http://dx.doi.org/10.1016/S0360-3016(02)02946-2.
[28] Shibayama Y, Arimura H, Hirose T, Nakamoto T, Sasaki T, Ohga S, et al.
Investigation of interfractional shape variations based on statistical point distribu- tion model for prostate cancer radiation therapy. Med Phys 2017;44:1837–45.
http://dx.doi.org/10.1002/mp.12217.
[29] Lorensen WE, Cline HE. Marching cubes: a high resolution 3D surface construction algorithm. Comput Graph (ACM) 1987;21:163–9.http://dx.doi.org/10.1145/
37402.37422.
[30] Garland M, Heckbert PS. Surface simplification using quadric error metrics. Proc.
24th Annu. Conf. Comput. Graph. Interact. Tech.–SIGGRAPH’97, 1997, p. 209–16.
doi: 10.1145/258734.258849.
[31] Chui H, Rangarajan A. A new point matching algorithm for non-rigid registration.
Comput Vis Image Underst 2003;89:114–41.http://dx.doi.org/10.1016/S1077- 3142(03)00009-2.
[32] Huang SH, Pan J, Mulcaire G, Abbeel P. Leveraging appearance priors in non-rigid registration, with application to manipulation of deformable objects. IEEE Int. Conf.
Intell. Robot. Syst. 2015;2015:878–85.http://dx.doi.org/10.1109/IROS.2015.
7353475.
[33] Stroom JC, Heijmen BJM. Geometrical uncertainties, radiotherapy planning mar- gins, and the ICRU-62 report. Radiother Oncol 2002;64:75–83.http://dx.doi.org/
10.1016/S0167-8140(02)00140-8.
[34] Van Herk M. Errors and margins in radiotherapy. Semin Radiat Oncol 2004;14:52–64.http://dx.doi.org/10.1053/j.semradonc.2003.10.003.
[35] Wu J, Haycocks T, Alasti H, Ottewell G, Middlemiss N, Abdolell M, et al. Positioning errors and prostate motion during conformal prostate radiotherapy using on-line isocentre set-up verification and implanted prostate markers. Radiother Oncol 2001;61:127–33.http://dx.doi.org/10.1016/S0167-8140(01)00452-2.
[36] Witte MG, van der Geer J, Schneider C, Lebesque JV, van Herk M. The effects of target size and tissue density on the minimum margin required for random errors.
Med Phys 2004;31:3068–79.http://dx.doi.org/10.1118/1.1809991.
[37] Arimura H, Shibayama Y, Haekal M, Jin Z, Ikushima K. Computer-assisted target volume determination. In: Arimura H, editor. Image-Based Comput. Radiat. Ther.
Singapore: Springer Singapore; 2017. p. 87–109.http://dx.doi.org/10.1007/978- 981-10-2945-5_5.
[38] Strbac B, Jokic VS. Evaluation of set-up errors in head and neck radiotherapy using electronic portalimaging. Phys Medica 2013;29:531–6.http://dx.doi.org/10.1016/
j.ejmp.2012.12.001.
[39] Dzierma Y, Beyhs M, Palm J, Niewald M, Bell K, Nuesken F, et al. Set-up errors and planning margins in planar and CBCT image-guided radiotherapy using three dif- ferent imaging systems: a clinical study for prostate and head-and-neck cancer. Phys Medica 2015;31:1055–9.http://dx.doi.org/10.1016/j.ejmp.2015.09.002.
[40] Huang EH, Pollack A, Levy L, Starkschall G, Dong L, Rosen I, et al. Late rectal toxicity: dose-volume effects of conformal radiotherapy for prostate cancer. Int J Radiat Oncol Biol Phys 2002;54:1314–21.http://dx.doi.org/10.1016/S0360- 3016(02)03742-2.
[41] Pederson AW, Fricano J, Correa D, Pelizzari CA, Liauw SL. Late toxicity after in- tensity-modulated radiation therapy for localized prostate cancer: an exploration of dose-volume histogram parameters to limit genitourinary and gastrointestinal
M. Haekal et al. Physica Medica 46 (2018) 168–179
178