Kyushu University Institutional Repository
PTVマージンにおけるCTV形状変動を考慮することに よる前立腺癌放射線治療への影響
廣瀨, 貴章
http://hdl.handle.net/2324/2236072
出版情報:Kyushu University, 2018, 博士(保健学), 課程博士 バージョン:
権利関係:
Contents lists available atScienceDirect
Physica Medica
journal homepage:www.elsevier.com/locate/ejmp
Original paper
E ff ect of accounting for interfractional CTV shape variations in PTV margins on prostate cancer radiation treatment plans
Taka-aki Hirose
a, Hidetaka Arimura
b,⁎, Yusuke Shibayama
c, Jun-ichi Fukunaga
c, Saiji Ohga
baGraduate School of Medical Sciences, Kyushu University, 3-1-1, Maidashi, Higashi-ku, Fukuoka 812-8582, Japan
bFaculty of Medical Sciences, Kyushu University, 3-1-1, Maidashi, Higashi-ku, Fukuoka 812-8582, Japan
cKyushu University Hospital, 3-1-1, Maidashi, Higashi-ku, Fukuoka 812-8582, Japan
A R T I C L E I N F O
Keywords:
Shape variation PTV margin Treatment planning
Prostate cancer radiation therapy
A B S T R A C T
Purpose:The aim of this study was to account for interfractional clinical target volume (CTV) shape variation and apply this to the planning target volume (PTV) margin for prostate cancer radiation treatment plans.
Methods:Interfractional CTV shape variations were estimated from weekly cone-beam computed tomography (CBCT) images using statistical point distribution models. The interfractional CTV shape variation was taken into account in the van Herk’s margin formula. The PTV margins without and with the CTV shape variation, i.e., standard (PTVori) and new (PTVshape) margins, were applied to 10 clinical cases that had weekly CBCT images acquired during their treatment sessions. Each patient was replanned for low-, intermediate-, and high-risk CTVs, using both margins. The dose indices (D98 and V70) of treatment plans with the two margins were compared on weekly pseudo-planning computed tomography (PCT) images, which were defined as PCT images registered using a deformable image registration technique with weekly CBCT images, including contours of the CTV, rectum, and bladder.
Results:The percentage of treatment fractions of patients who received CTV D98 greater than 95% of a pre- scribed dose increased from 80.3 (PTVori) to 81.8% (PTVshape) for low-risk CTVs, 78.8 (PTVori) to 87.9%
(PTVshape) for intermediate-risk CTVs, and 80.3 (PTVori) to 87.9% (PTVshape) for high-risk CTVs. In most cases, the dose indices of the rectum and bladder were acceptable in clinical practice.
Conclusion:The results of this study suggest that interfractional CTV shape variations should be taken into account when determining PTV margins to increase CTV coverages.
1. Introduction
In radiation therapy for prostate cancer, to take into account in- ternal setup and organ motion errors during treatment courses, plan- ning target volumes (PTVs) are created by expanding clinical target volumes (CTVs) with CTV-to-PTV margins [1]. Several methods of quantifying CTV-to-PTV margins (hereafter PTV margins) have been published[2–7]. According to van Herk et al.[7], the uncertainties in CTVs can be classified into systematic errors in treatment preparation and random errors in treatment execution. Systematic and random er- rors of setup and organ motion have been considered in a number of studies to estimate PTV margins in prostate cancer radiotherapy [8–12], in which proximal seminal vesicles (SV) are usually included in the CTVs in intermediate- and high-risk prostate cancer cases[13–15].
However, the studies of van Herk and others[2–7]have not accounted
for CTV shape variations with rotation and deformations in their margin formulas.
Image-guided patient positioning (IGPP) systems have been em- ployed to reduce the systematic and random errors in terms of trans- lation and rotation errors by the use of on-line correction systems. On the other hand, some studies have clarified the effects of systematic and random errors of SV displacements or shape variations (relative to prostate locations) on the PTV margins[16–18]. The CTV shape var- iations caused by the changes of the rectum and bladder volumes were < 1 mm for prostate and≤3 mm for SV[16]. Smitsmans et al.
reported that the patient positioning with respect to the shape varia- tions of SV was insufficiently corrected, even though the correction of rotation errors based on fiducial markers was performed [18]. Ad- ditionally, Liang et al. mentioned that the shape variations of targets including SV may cause the underdosing of parts of the targets[19].
https://doi.org/10.1016/j.ejmp.2018.09.008
Received 30 April 2018; Received in revised form 1 September 2018; Accepted 20 September 2018
⁎Corresponding author at: Division of Medical Quantum Science, Department of Health Sciences, Faculty of Medical Sciences, Kyushu University, 3-1-1, Maidashi, Higashi-ku, Fukuoka 812-8582, Japan.
E-mail address:[email protected](H. Arimura).
1120-1797/ © 2018 Associazione Italiana di Fisica Medica. Published by Elsevier Ltd. All rights reserved.
T
Consequently, the shape variations of the CTV have not been corrected and reduced by current IGPP systems[10,20,21]. Thus, interfractional CTV shape variations need to be considered for the determination of PTV margins on radiation treatment planning.
In our previous research [22], Shibayama et al. investigated sys- tematic and random errors of CTV shape variations based on statistical point distribution models (PDMs) for prostate cancer. The average standard deviation (SD) of the systematic errors ranged from 0.9 to 3.0 mm, and the average SD of the random errors ranged from 0.8 to 1.4 mm. This study concluded that the interfractional CTV shape var- iations were not negligible for the determination of the PTV margins.
Also, Haekal et al. analyzed the uncertainties of the rectum shape due to anisotropic variations using the PDMs[23]. For these regions, where the rectum overlapped with the PTV along the anterior wall, the SDs of systematic errors ranged from 0.8 to 1.9 mm, and the SDs of random errors ranged from 0.1 to 1.8 mm. These results suggested that aniso- tropic shape variation analysis is needed when determining the plan- ning-organ-at-risk-volume (PRV) margins for the rectum associated with acute toxicities. However, no studies so far have been performed on how interfractional CTV shape variations in PTV margins affect ra- diation treatment plans, especially the dose distributions in the targets and organs at risk (OAR). Therefore, the objective of this study was to investigate the effects of considering interfractional CTV shape varia- tions in PTV margins on prostate cancer radiation treatment plans.
2. Materials and methods
First, standard PTV margins using the van Herk formula were ob- tained from an initial patient cohort. An additional set of 10 patients was then analyzed to determine the interfractional CTV shape varia- tions, and the proposed PTV margins were calculated by including the CTV shape variations. Finally, the two PTV margins with and without CTV shape variations, i.e., standard (PTVori) and new (PTVshape) mar- gins, were tested on a different set of 10 patients to investigate the effect of taking into account CTV shape variations on the treatment plans.
2.1. Patient data and image acquisition
This study was performed with the approval of the institutional review board of our hospital. Forty patients [median age: 65 yr; range:
56–83 yr; Stage: T1–T3a, N0, M0, median initial prostate-specific an- tigen: 10.24 ng/mL; range: 3.56–99.17, Gleason score (sum): median 7, range: 6–10] who had undergone intensity modulated radiation therapy (IMRT) for prostate cancer, were selected for this study amongst pa- tients treated between May and November 2012.
Treatment planning was performed on a commercially available RTP system (Eclipse version 10.0, Varian Medical Systems Inc., Palo Alto, USA) using an analytical anisotropic algorithm (AAA). In each plan, the mean dose in the PTV including both prostate and SV was set to 76 Gy in 38 fractions at a linear accelerator with an accelerating voltage of 10 MV (Clinac 21EX; Varian Medical Systems Inc., Palo Alto, USA). The IMRT plans were optimized using sevenfields of the same gantry angles with a dynamic sliding window technique for all cases. As for the bladder and rectum preparation, all patients were given in- structions to empty their bladders and rectums as much as possible, and to drink 300 mL water at 30 min before the scheduled treatment.
The forty patients were scanned for the treatment planning by a planning computed tomography simulator (PCT) (Mx 8000, Philips Healthcare, Amsterdam, The Netherlands; 120 kV, 0.98 mm in-plane pixel size, 2.0 mm slice thickness). Three hundred-three cone-beam computed tomography (CBCT) images of the patients (On-Board- Imager, Varian Medical Systems Inc., Palo Alto, USA; Half-Fan mode, 120 kVp, 1.17 mm in-plane pixel size, 2.5 mm slice thickness) were acquired at 5–9 fractions (mean: 7) of 38 fraction treatment course per patient, with fixed exposure parameters (‘‘pelvis’’ mode, 120 kV,
1040 mAs, 365° acquisition angle range with a half-fan bow tiefilter).
The CBCT images were only acquired at the beginning of the week to reduce the patient dose according to the principle of“as low as rea- sonably achievable (ALARA)”.
We divided the 40 patients into three patient datasets, named A, B, and C. The 20 patients of Dataset A with 157 CBCT images treated between May and August 2012, were chosen to analyze the organ motion errors for CTVs with prostates and SVs. The 10 patients of Dataset B with 73 CBCT images treated between August and October 2012, were used to determine the interfractional CTV shape variations.
The remaining 10 test patients of Dataset C with 73 CBCT images treated between October and November 2012, were employed to in- vestigate the effects of two PTV margins with and without interfrac- tional CTV shape variations on the treatment plans.
2.2. Delineation of three risk CTV contours on PCT images
To determine the CTV shape variations and investigate the effect of accounting for interfractional CTV shape variations on treatment plans, two additional CTVs belonging to three risk classes (low-, inter- mediate-, and high-risk CTV) were delineated for each of the patients of Datasets B and C, except a clinical CTV, which was determined for the actual treatment of the patient. The low-, intermediate-, and high-risk CTVs were defined as containing only the prostate, prostate plus 1 cm proximal SV, and prostate plus 2 cm proximal SV, respectively[14,15].
The OARs were defined as the bladder (from its base to the dome) and the rectum (inferiorly starting from the anorectal junction and super- iorly, extending up to the beginning of the sigmoid at the rectosigmoid junction). The contours of the three CTV risk types and OAR were de- lineated on PCT and weekly CBCT images for each patient based on the consensus between a radiation oncologist (S.O.) and medical physicist (T.H.) with the use of a commercially available RTP system (Eclipse version 10.0; Varian Medical Systems Inc., Palo Alto, USA).
2.3. Organ motion errors
The organ motion error was defined as the difference in couch correction distance between the CTV centroids-based registration and bone-based registration when registering CBCT images to PCT images.
The systematic and random organ motion errors were calculated from the SDs and the root mean squares of the average organ motion errors for each patient, respectively. The systematic and random organ motion errors, excluding the rotation errors in six directions (anterior, pos- terior, superior, inferior, right, and left), were obtained from Dataset A.
The treatment and imaging scheduled in our hospital was that daily orthogonal projections and weekly CBCT scans were performed for each patient throughout 38 fractions just prior to dose delivery for online correction of target localization. The online correction for each fraction is assumed based on bone registration with orthogonal projections.
2.4. CTV shape variations
To estimate the PTV margin with consideration of the interfrac- tional CTV shape variations, the systematic and random errors for the interfractional CTV shape variations were analyzed with the method proposed by Shibayama et al.[22]based on PDMs. The systematic er- rors were calculated with CTV contours on PCT and CBCT images by using an in-house software, and the random errors on CBCT images. The procedure for the calculation was developed as the in-house software as follows. First, CTV contours were delineated manually on the 10 PCT images and 73 CBCT images of Dataset B, which were the same data as that used by Shibayama et al.[22]. Next, a triangulated CTV surface was generated from a CTV contour on each of PCT and CBCT images by use of a marching cubes algorithm, which can yield 3D surface[22,24].
Then, a PDM was generated from vertices of the triangulated CTV surface [22]. Finally, the systematic and random errors of
interfractional CTV shape variations were quantified by calculating the SDs of corresponding points of PDMs[22]. In this study, it should be noted that the rotation errors of the CTVs were included as the shape variations, because the errors could lead to displacements of the CTV surface points.
The systematic error for shape variations is defined as the average deviation between the surfaces of a reference CTV on the CBCT images and those of the CTVs on PCT images. Here, an average CTV surface on CBCT images was used as the reference CTV surface. Meanwhile, the random error for shape variations is defined as the average deviation of the CTV surface over fractions from a reference CTV surface, which was derived from an average CTV.
2.5. PTV margin calculations
The PTVoriand PTVshapemargins were calculated without and with consideration of the interfractional CTV shape variations of the three CTV risk classes, which were used to set PTVoriand PTVshape. The PTV margins in all six directions (anterior, posterior, superior, inferior, right, and left) were calculated using van Herk’s margin formula[7];
M =2.5ε+0.7σ, whereε andσ denote the SDs of the treatment pre- paration (systematic) and execution (random) errors, respectively. This margin formula was based on a dose-population histogram to deliver at least 95% of a prescribed dose to 90% of a patient population.
The PTV margin formula of van Herk consists of the systematic and random error terms. The systematic error term includes the delineation error, organ motion error, and shape variation. The random error term includes the organ motion and shape variation. The systematic deli- neation errors for the prostate obtained by Gardner et al. [25]were used without changes in this study, because their results contained newer data than other studies for the delineation errors[26,27]. The delineation errors were derived from the contours made by five ob- servers on the PCT images of 10 prostate cancer patients in their study.
The SDs of theεandσ for the systematic and random errors were ob- tained by the quadratic sum of all systematic and random errors, re- spectively, by
= + +
ε εDE2 εOM2 εSV2 (1)
and
= +
σ σOM2 σSV2 (2)
Here,εDE,εOM, andεSVrepresent the mean SDs of the systematic errors in the delineation of the contours on PCT, organ motion, and inter- fractional shape variations of the CTVs, respectively, whereasσOMand σSVrepresent the mean SDs of the random errors for the organ motion and interfractional CTV shape variations, respectively. In this study, we did not consider the intra-fractional errors in the PTV margins, because the weekly pseudo dose distributions were calculated for the pre- treatment CBCT images to evaluate the impacts of the interfractional CTV shape variations.
2.6. Overall workflow to investigate the effects of accounting for interfractional CTV shape variations in PTV margins on treatment plans
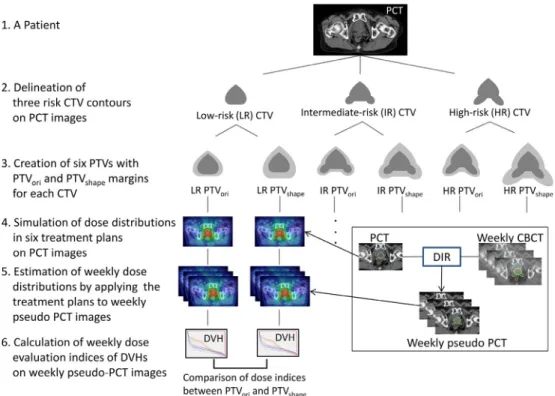
Fig. 1illustrates the overall workflow to investigate the effects of taking into account the interfractional CTV shape variations in PTV margins on treatment plans. Three risk CTVs, i.e., low-, intermediate-, and high-risk CTVs, were delineated on the PCT images for the patient.
The six PTVs were created by adding PTV margins without and with consideration of the interfractional CTV shape variations for each risk CTV. The PTVs without and with the CTV shape variations were de- noted as PTVoriand PTVshape, respectively. The delineation and organ motion errors were derived from a reference paper (Gardner et al.[25]) and clinical data, respectively, and were used to calculate the PTV margins. The dose distributions in six treatment plans for the patient
were simulated from the PCT images. To estimate the weekly pseudo dose distributions at 6–8 fractions, the dose distributions of the treat- ment plans with PTVoriand PTVshapemargins were applied on weekly pseudo-PCT images, which were defined as PCT images registered by using a deformable image registration (DIR) technique with weekly CBCT images including contours of CTV, rectum, and bladder. Weekly dose evaluation indices for CTV coverage (D98) and irradiated OAR volume (V70) derived from dose-volume histograms (DVH) of the weekly pseudo dose distributions were calculated to compare the plans with PTVoriand PTVshapeand assessing the impacts of interfractional CTV shape variations on PTV margins. D98 was defined as the per- centage of nearly minimum dose received by 98% of each CTV, and indicates the CTV dose coverage[28]. V70 was defined as the OAR (rectum or bladder) volume receiving 70 Gy and was used to represent the high-dose OAR volume.
2.7. Creation of six PTVs with PTVoriand PTVshapemargins for each CTV Six PTVs were created by adding the PTVoriand PTVshapemargins to the low-, intermediate-, and high-risk CTVs from Dataset C. These PTVs were employed in this study to validate the usefulness of the PTV margins with interfractional CTV shape variations.
2.8. Simulation of dose distributions in six treatment plans on the PCT images
The dose distributions in six treatment plans with PTVori and PTVshapefor the three risk CTVs for Dataset C were obtained from the PCT images to investigate the effects of taking into account interfrac- tional CTV shape variations in the PTV margins on treatment plans.
Treatment planning was performed for six PTVs of each patient. To guarantee the coverage of each PTV on the plans, we used the dose constraint that PTV D95 was greater than 95% of the prescribed dose, while keeping the OAR doses as low as possible.
2.9. Estimation of weekly pseudo dose distributions by applying the treatment plans to weekly pseudo-PCT images
The dose distributions on the treatment plans with PTVori and PTVshapemargins were estimated on weekly pseudo-PCT images, which were registered using a DIR technique with weekly CBCT images to reduce the uncertainties including artifacts (e.g., streak artifacts due to rectal gas) and inaccurate CT values on CBCT images. The contours delineated on the CBCT images were superimposed on pseudo-PCT images without using the DIR. Seventy-three weekly dose distributions in the treatment plans with PTVoriand PTVshapeat 6–8 fractions of the patients for Dataset C were calculated on pseudo-PCT images. In this estimation, the weekly isocenter positions were determined by bone matching between the PCT and pseudo-PCT images. The dose calcula- tions were performed on each pseudo-PCT image, while keeping the MLC movements and MU constant in the treatment plans.
2.10. Calculation of weekly dose evaluation indices of DVH
The weekly dose evaluation indices for CTV coverage (D98) and irradiated OAR volume (V70) derived from the DVHs of the weekly pseudo dose distributions were calculated to compare the plans with PTVoriand PTVshapefor validation of the impact of the interfractional CTV shape variations on the PTV margins. The averages and SDs of the dose evaluation indices were calculated for PTVoriand PTVshape, and were statistically analyzed by performing a Wilcoxon signed-rank test for paired samples, due to the non-normal distribution of the data.
Then, as for each of the 10 test patients in Dataset C, the 10 test plans with six types of PTVs (Fig. 1) were compared with the 73 pseudo dose distributions generated from the weekly CBCTs to evaluate the plan robustness against interfractional CTV shape variations. The
means and SDs of the dose evaluation indices of D98 for CTV and V70 for rectum and bladder were statistically analyzed by performing a Mann–Whitney U test for unpaired samples, due to the non-normal distribution of the data. In these evaluations, p-values from two-sided tests lower than 0.05 were considered to be statistically significant.
Furthermore, the percentages of the treatment fractions with a D98 of the CTV greater than 95% of a prescribed dose in treatment plans with PTVoriand PTVshapemargins were calculated among the 73 frac- tions for Dataset C.
2.11. Deformable image registration for estimation of weekly pseudo dose distributions
To estimate weekly pseudo dose distributions, we used a commer- cially available image registration software (MIM Maestro version 6.4;
MIM Software, Cleveland, OH) with an intensity-based free-form de- formable registration algorithm to perform the DIR. The optimization algorithm was a custom modified gradient descent. To assess the ac- curacy of the DIR in the estimation of weekly pseudo dose distributions, validation of the DIR software performance was performed based on the test suggested in American Association of Physicists in Medicine (AAPM) Task Group 132 report [29]. Basic anatomical datasets of
digital phantoms with structure of prostate, rectum, and bladder were employed for the validation test, which were generated using Im- SimQA™software (Oncology System Limited, UK). The evaluation of the validation test was performed using Dice similarity coefficients (DSC). The DSCs for contours of prostate, rectum, and bladder were 0.94, 0.95, and 0.96, respectively, which exceeded the tolerance of 0.80–0.90 suggested in AAPM Task Group 132 report. Moreover, as for clinical cases used in this study, the total registration errors in deformed pseudo-PCT and CBCT images of Dataset C were estimated using DSC for the contours of low-, intermediate-, and high-risk CTVs, rectum and bladder. The DSCs for the contours of low-, intermediate-, and high-risk CTVs, rectum and bladder on deformed pseudo-PCT and CBCT images were 0.86 ± 0.07, 0.86 ± 0.07, 0.84 ± 0.08, 0.80 ± 0.08, and 0.80 ± 0.12, respectively, which were within the tolerance rage of 0.80–0.90 in Task Group 132 report.
3. Results 3.1. PTV margins
Table 1lists the systematic errors (organ motion errors, delineation errors, and CTV shape variations) and random errors (organ motion Fig. 1.Overall workflow to investigate the effects of accounting for interfractional CTV shape variations in PTV margins on treatment plans, with an analysis of the test patient contoured low-risk (LR), intermediate-risk (IR), and high-risk (HR) CTVs in this study.
Table 1
Systematic and random errors calculated for three risk (low-, intermediate-, and high-risk) CTVs.
Direction Systematic error (mm) Random error (mm)
Organ motion Delineation* Shape variation Organ motion Shape variation
Low Intermediate High Low Intermediate High
Anterior 2.0 1.3 1.0 2.0 1.8 1.7 0.9 1.1 1.1
Posterior 2.0 0.9 1.3 2.6 2.3 1.7 1.0 1.2 1.3
Superior 1.7 1.4 1.0 2.5 2.1 1.6 0.9 1.0 1.0
Inferior 1.7 2.2 0.9 1.9 1.4 1.6 0.8 0.9 0.8
Right 0.5 1.1 1.1 2.4 2.6 0.8 0.8 0.8 0.9
Left 0.5 1.1 1.1 2.5 3.0 0.8 0.8 0.8 0.9
* Delineation obtained from Ref.[25].
errors and CTV shape variations) calculated using van Herk’s formalism [7].Table 2provides the PTV margins calculated for 3 risk (low-, in- termediate-, and high-risk) CTVs. The PTVorimargins in the anterior, posterior, superior, inferior, right, and left directions were 7.1, 6.7, 6.6, 8.1, 3.6, and 3.6 mm, respectively, while the PTVshapemargins for all risk CTVs in the anterior, posterior, superior, inferior, right, and left directions were 7.8–9.2 mm, 7.7–10.0 mm, 7.4–9.7 mm, 8.6–9.7 mm, 4.9–8.1 mm, and 4.9–9.0 mm, respectively.
3.2. CTV dose coverage and OAR doses
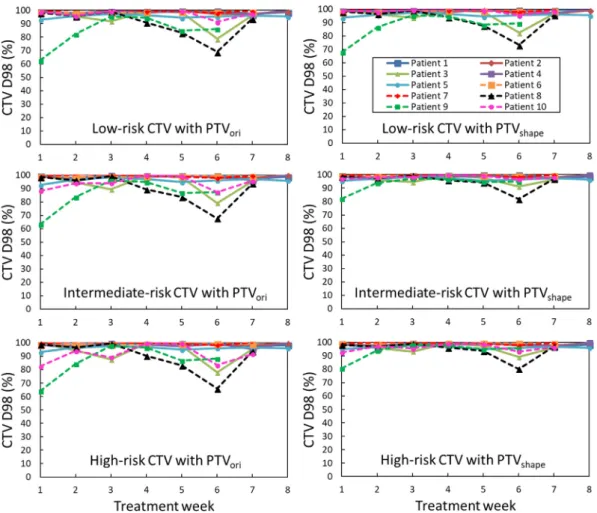
Figs. 2–4depict the temporal (weekly) variations of D98 for the CTVs and V70 for the rectum and bladder in the plans for Dataset C,
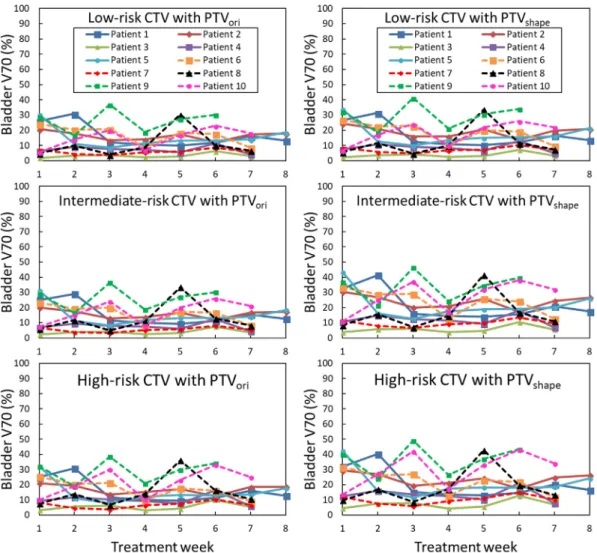
which were derived from the estimation based on the PTVori and PTVshapemargins, for all three risk CTVs. For each risk CTV, the D98 for the CTVs changed less over time in the cases with PTVshapemargins, than for the cases with the PTVorimargins. The V70 for the rectum and bladder was higher in the cases with PTVshapemargins than those in the cases with PTVorimargins.
Fig. 5presents the averages and SDs of D98 (for CTV) and V70 (for rectum and bladder) in 73 weekly pseudo dose distributions for the same Dataset C. The average D98 for the CTV was significantly higher in the plans with PTVshapethan in those with PTVori, for low-, inter- mediate-, and high-risk CTVs (p = 0.011, < 0.001, and 0.035, respec- tively). Also, the average V70 for the rectum and bladder was sig- nificantly higher in the plans with PTVshapethan in those with PTVori, for low-, intermediate-, and high-risk CTVs (p < 0.001 for the rectum and p < 0.001 for the bladder).
Fig. 6shows the averages and SDs of D98 (for CTV) and V70 (for rectum and bladder) in the planning and weekly pseudo dose dis- tributions for each PTV of the same Dataset C. There were no significant differences between the planning and weekly pseudo dose distributions for the averages of D98 for CTV and V70 for rectum. The averages of V70 for bladder in the weekly pseudo dose distributions were sig- nificantly higher than those in the planning dose distributions for PTVorifor low-, intermediate-, and high-risk CTVs (p = 0.032, 0.030, 0.032, respectively) and PTVshapefor low-risk CTVs (p = 0.041).
Fig. 7shows the percentages of the treatment fractions with a D98 for CTV greater than 95% of a prescribed dose in the weekly pseudo dose distributions with PTVoriand PTVshape. The percentage of treat- ment fractions of patients with D98 greater than 95% of a prescribed dose, increased from 80.3 (PTVori) to 81.8% (PTVshape) for low-risk Table 2
PTV margins calculated for three risk (low-, intermediate-, and high-risk) CTVs.
The PTVori margins include organ motion and delineation errors, and the PTVshapemargins include organ motion, delineation, and shape variation errors.
Direction PTV margin**(mm)
PTVori PTVshape
Low Intermediate High
Anterior 7.1 7.8 9.2 8.8
Posterior 6.7 7.7 10.0 9.4
Superior 6.6 7.4 9.7 8.9
Inferior 8.1 8.6 9.7 9.1
Right 3.6 4.9 7.5 8.1
Left 3.6 4.9 7.8 9.0
** PTV margin = 2.5ε+ 0.7σ(Ref.[7]).
Fig. 2.Temporal (weekly) changes in the CTV D98 in the plans based on PTVorimargins (left) and PTVshapemargins (right) for the low-risk (top row), intermediate- risk (middle row), and high-risk (bottom row) CTVs using Dataset C.
CTVs, from 78.8 (PTVori) to 87.9% (PTVshape) for intermediate-risk CTVs, and from 80.3 (PTVori) to 87.9% (PTVshape) for high-risk CTVs.
4. Discussion
In this study, the impacts of interfractional CTV shape variations in PTV margins on the resulting dose distributions were investigated.
Regarding the interfractional CTV shape variations, van der Wielen et al. found that the shape variations were 0.3–1.4 mm for prostate and 1.7–3.4 mm for SVs[16]. Mak et al. reported that the displacements of proximal-2.5-cm-SV centroids to prostate centroids were 1.9–3.5 mm [17]. Smitsmans et al. demonstrated that the SV displacements were 1.5–2.6 mm[18]. In this study, as shown inTable 1, systematic errors of the shape variations were 0.9–1.3 mm for low-risk CTVs with only prostate, and 1.4–3.0 mm for high-risk CTVs with prostate plus prox- imal 2-cm-SVs. Our results were similar to other studies, although the calculation methods were different.
PTVoriand PTVshapemargins were calculated for three risk CTVs, using the van Herk’s formula[7]. Frank et al.studied the effects of positional changes on the centroids of the prostate and SVs, and found that a PTV margin of 10.0 mm covered the anterior–posterior SV movement in 86% of all fractions[30]. According toTable 2andFig. 7 in this study, PTVshapemargins of 8.1–9.4 mm for the high-risk CTVs including SVs covered 87.9% of all fractions.
As depicted inFig. 2, D98 is the lowest for Patient 9. For this pa- tient, the mean D98 in the low-, intermediate-, and high-risk CTV cases are 87.1, 93.1, and 93.5%, respectively, when including the shape variations. The reason that D98 for the CTV of this patient is less than
the average D98 for the CTVs of 96.5, 97.5, and 97.1% for other pa- tients of Dataset C is that the relative displacements of the CTVs to the patient’s bony anatomy (large organ motion) exceeded the PTV margins due to the volume changes of the rectum and bladder. A similar result is observed for Patient 8. For the other eight patients, the average D98 values were greater than 95% in the cases in which the interfractional CTV shape variations were taken into account in the PTV margins.
These results suggest that the PTV margins, when including the shape variations, may guarantee higher coverages for the deformable CTVs, subject to using target-based patient positioning (TBPP) approaches or target tracking methods.
Additionally, although the bone-based registration was performed in our study to obtain weekly pseudo dose distributions, TBPP ap- proaches with implanted fiducial markers and implanted electro- magnetic transponders have recently become common practice in radiotherapy. Other researchers have reported that TBPP approaches resulted in reduced margins[31,32]. Therefore, organ motion errors in this study would become smaller than the current results in the TBPP approaches. Nevertheless, the shape variations would not be reduced, and thus the impacts of the shape variations on the PTV margins could be relatively larger.
Tumor tracking techniques can provide real-time and accurate target positional information during radiotherapy[33]. However, these techniques are not applicable when the SV displacement to the prostate is large [18]. Therefore, our method with PTVshapemargins may be useful for intermediate- and high-risk CTVs.
The adaptive radiation therapy strategy allows us to replan when observing large deformations or positional changes of targets or OAR on Fig. 3.Temporal (weekly) changes in rectum V70 in plans based on PTVorimargins (left) and PTVshapemargins (right) for the low-risk (top row), intermediate-risk (middle row), and high-risk (bottom row) CTVs, using Dataset C.
Fig. 4.Temporal (weekly) changes in bladder V70 in plans based on PTVorimargins (left) and PTVshapemargins (right) for the low-risk (top row), intermediate-risk (middle row), and high-risk (bottom row) CTVs, using Dataset C.
Fig. 5.Averages and SDs of D98 (for CTV) and V70 (for rectum and bladder) in the weekly pseudo dose distribution based on PTVoriand PTVshapefor three risk CTVs for Dataset C. The error bars indicate the SDs, and the asterisks indicate statistically significant differences in the averages (p < 0.05).
CBCT images[34]. However, this strategy generally may require longer treatment times and more complex treatment procedures than the conventional IMRT with the PTVshapemargins proposed in this study.
Our study could solve these issues using simpler treatment procedures.
A comparison of the weekly pseudo dose distributions obtained using PTVoriand PTVshapemargins revealed that D98 was significantly improved for each CTV risk class for Dataset C when the CTV shape variations were taken into account (Fig. 5). On the contrary, the V70 of both rectum and bladder were significantly increased in the cases where the PTV margins were set with CTV shape variations. Vargas et al.
mentioned that the V70 for the rectum was useful for predicting the risk of chronic toxicity[35]. Huang et al.reported that the 6-year rate of Grade 2 or higher late rectal complications was 13 and 54% with V70 < 26.2% and V70≥26.2%, respectively (p > 0.05) [36]. As
shown inFig. 5, the mean V70 for the rectum in the low-, intermediate-, and high-risk CTV cases in our results are 5.1, 11.4, and 14.1%, re- spectively, for PTVshapeand 3.4, 5.9, and 8.5% for PTVori. The average rectal V70 values for 6–8 fractions of each patient ranged from 4.5 to 26.0% in the high-risk CTV cases with shape variations. Consequently, the rectal doses in our results would be considered acceptable in clinical practice. In this study, as we analyzed the shape variations on a CTV including prostate and SVs, in terms of estimating the CTV-to-PTV margins, the posterior margins to prostate for intermediate- and high- risk cases were theoretically enlarged. However, the posterior margin should be determined clinically by considering the effect on the rectum dose.
Two studies indicated the relationships between bladder surface dose and urinary toxicities[37,38], whereas Pederson et al. reported that no bladder dose–volume relationships were associated with the risk of late genitourinary toxicity after IMRT for prostate cancer[39]. In the absence of any reliable DVH-based data, the dose limits listed in the conventional fractionation arm of the Radiation Therapy Oncology Group (RTOG) 0415 study of prostate cancer are recommended, which includes a solid bladder constraint of no more than 35% of the volume to receive a dose > 70 Gy[40]. However, it should be noted that the protocol in this simulation (76 Gy/38 fractions and biologically effec- tive dose (BED)10: 91.2 Gy) was different from that of RTOG 0415 (70 Gy/28 fractions or 73.8 Gy/41 fractions, and BED10: 87.5 or 87.1 Gy). As depicted inFig. 5, the mean V70 for the bladder in the low-, intermediate-, and high-risk CTV cases in our results were 15.6, 20.4, and 21.1%, respectively, for PTVshapeand 13.8, 14.3, and 16.1%
for PTVori. The average V70 values for the bladder for 6–8 fractions of each patient ranged from 7.0 to 36.6% in the high-risk CTV cases when including the shape variations. Only one plan of high-risk CTV of Pa- tient 9 resulted in exceeding the dose limit of RTOG 0415. In general, the smaller the bladder volume, the larger the high dose (70 Gy) volume percentage. The V70 of Patient 9 was 16% smaller than the RTOG criterion of 35% for a bladder volume of 166 mL on the planning CT image. However, since the average bladder volume of Patient 9 on the weekly CBCT images was 111 mL, V70 may increase. Furthermore, the Fig. 6.Averages and SDs of D98 (CTV) and V70 (for rectum and bladder) in the planning and weekly pseudo dose distributions based on PTVoriand PTVshapefor three risk CTVs for Dataset C. The error bars indicate the SDs, and the asterisks indicate statistically significant differences in the averages (p < 0.05).
Fig. 7.Percentages of the treatment fractions (73 fractions for Dataset C) in which the D98 for the CTV was greater than 95% of prescribed dose in the treatment plans with PTVoriand PTVshapemargins for three risk CTVs.
bladder motion may have affected the higher V70.
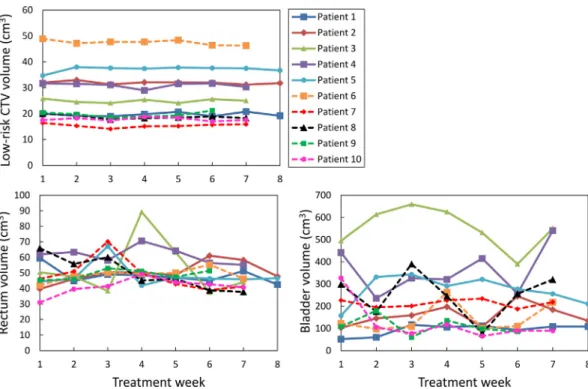
To discuss the effects of OAR volumes on the OAR dose indices, Fig. 8shows the temporal volume changes of the low-risk CTV, rectum, and bladder in 10 patients for Dataset C, which were measured on an RTP system.Fig. 8indicated that the volume changes were largest for bladder, and they were smallest for low-risk CTV. Also,Fig. 9shows the relationships between rectum or bladder V70 and volume on the weekly pseudo dose distributions for high-risk CTV, which were evaluated by linear regression correlation coefficient values (R2). Here, rectum and bladder V70 indicate the volume of 70 Gy isodose lines that intersect with rectum and bladder, respectively. As shown inFig. 9, the effects of the volumes on V70 in both PTVshapeand PTVorishowed higher cor- relations with the bladder than those on the rectum. V70 for the bladder increased as the volume decreased. Also, the difference between V70 with PTVshapeand PTVoriwas larger as the volume decreased. Thus, the improvement of CTV D98 (coverage) led to the increase of V70 for the rectum and bladder, as shown inFig. 5. Although in most cases the dose indices of the rectum and bladder were acceptable in clinical practice, the dose to OAR should be reduced as possible as due to risk for sec- ondary malignancies [41]. Hence, we will improve the present ap- proach to obtain more appropriate PTV margins by optimizing the target coverage and OAR dose in future work.
In addition, as shown inFig. 6, the dose evaluation indices of 10
planning dose distributions on PCT images and 73 weekly pseudo dose distributions were compared to assess the plan robustness against inter- fractional CTV shape variations. Concerning D98 for the CTV, no sig- nificant differences were found between the planning and weekly pseudo dose distributions, and thus the PTVshapemargins ensure that the treatment plans are robust. The means of V70 for the bladder for each risk PTVoriand low-risk PTVshapein the weekly pseudo dose dis- tributions were significantly higher than those in the planning dose distributions. These differences may be caused by the shape variations or volume changes of the critical organs such as the rectum and bladder. Haekal et al. reported that the rectum shape variations affected variations of these dose evaluation indices[23]. They then proposed calculation methods of the PRV margins by considering OAR shape variations to overcome these problems. Therefore, a trade-offbetween PTV and PRV should be considered.
This study was limited in that we did not consider intra-fractional shape variations in the PTV margins, because the weekly pseudo dose distributions were calculated on pseudo-PCT images using pre-treat- ment weekly CBCT images to evaluate the impacts of the interfractional CTV shape variations. Kron et al. showed that intra-fractional margins of 2–3 mm were required even for a short period of time (< 6 min) [42]. If CTV shape variations are considered in the PTV margins in clinical practice, the investigation of the margins with intra-fractional Fig. 8.Temporal (weekly) volume changes of low-risk CTV, rectum, and bladder in 10 patients for Dataset C.
Fig. 9.Relationships between (a) rectum or (b) bladder V70 and volume on the weekly pseudo dose distributions for high-risk CTVs in 73 fractions for Dataset C.
errors is required in future work. Also, there were only a few cases considered for the calculation of PTV margins and evaluations of dose distributions in this study. More cases for analyzing the PTV margins for Datasets A and B could yield more adequate PTV margins. Regarding the dose evaluation of the weekly pseudo dose distributions for Dataset C using weekly CBCT images, it should be noted that the results did not include all fractions. In particular, the doses at the rectum and bladder may be limiting factors for the applicability of the proposed approach.
The evaluation of these using more cases and all fractions is required in future work.
The CTV shape variations and delineation errors were not in- dependently obtained because the shape variations were calculated from manual contours, which may include delineation errors.
Therefore, to reduce delineation errors, at least the intra- and inter- observer variability of the contours, all CTV contours on the PCT and the CBCT images were determined based on a consensus between the same radiation oncologist and medical physicist. However, Gardner et al.reported that the variability of human observer contours was si- milar between PCT and CBCT images[25]. Our results of interfractional CTV shape variation with CBCT images were also similar to other stu- dies evaluated using PCT images[16]. Therefore, we assumed that the impact of the CBCT images on CTV shape variation were negligible.
The actual clinical CTVs in the cases considered in this study were delineated by five experienced radiation oncologists in our hospital.
Therefore, the estimation of the delineation errors from these inter- observer variations are required. However, since we focused on CTV shape variation in this study, we derived the information of the deli- neation errors from other reliable reports. Nevertheless, these issues are limitations in the methodology for estimating delineation errors.
5. Conclusions
In this study, we investigated the impact of accounting for inter- fractional CTV shape variations in PTV margins in prostate cancer ra- diation treatment plans. The PTV margins including the interfractional CTV shape variations provided significant target coverage improve- ments. Therefore, the results suggest that interfractional CTV shape variations should be considered when determining PTV margins. In the era of image guided radiotherapy, the shape variations become more important in the determination of the CTV-to-PTV margins in radiation treatment planning, because the shape variations of the CTVs could not be corrected or reduced by current IGPP systems, which focus only on translation and rotation errors.
Conflict of interest
The authors declare that they have no conflict of interest.
Acknowledgments
The authors are grateful to all of the members of Arimura Laboratory (http://web.shs.kyushu-u.ac.jp/~arimura), whose com- ments contributed significantly to this study. The research was partially supported by“Program for Supporting Educations and Researches on Mathematics and Data Science in Kyushu University, Japan”. References
[1] ICRU50. ICRU report 50: Prescribing, recording, and reporting photon beam therapy. Bethesda, Maryland: International Commission on Radiation Units and Measurements; 1993.
[2] Austin-Seymour M, Chen GTY, Rosenman J, Michalski J, Lindsley K, Goitein M.
Tumor and target delineation: current research and future challenges. Int J Radiat Oncol 1995;33:1041–52.https://doi.org/10.1016/0360-3016(95)00215-4.
[3] Balter JM, Ten Haken RK, Lawrence TS, Lam KL, Robertson JM. Uncertainties in CT- based radiation therapy treatment planning associated with patient breathing. Int J Radiat Oncol Biol Phys 1996;36:167–74.https://doi.org/10.1016/S0360-3016(96) 00275-1.
[4] Goitein M, Schultheiss TE. Strategies for treating possible tumor extension: some theoretical considerations. Int J Radiat Oncol Biol Phys 1985;11:1519–28.
[5] Roeske JC, Forman JD, Mesina CF, et al. Evaluation of changes in the size and location of the prostate, seminal vesicles, bladder, and rectum during a course of external beam radiation therapy. Int J Radiat Oncol Biol Phys 1995;33:1321–9.
[6] Stroom JC, Koper PCM, Korevaaar GA, van Os M, Janssen M, de Boer HCJ, et al.
Internal organ motion in prostate cancer patients treated in prone and supine treatment position. Radiother Oncol 1999;51:237–48.https://doi.org/10.1016/
S0167-8140(99)00061-4.
[7] van Herk M, Remeijer P, Rasch C, Lebesque JV. The probability of correct target dosage: dose-population histograms for deriving treatment margins in radiotherapy.
Int J Radiat Oncol Biol Phys 2000;47:1121–35.https://doi.org/10.1016/S0360- 3016(00)00518-6.
[8] Aubry J-F, Beaulieu L, Girouard L-M, Aubin S, Tremblay D, Laverdière J, et al.
Measurements of intrafraction motion and interfraction and intrafraction rotation of prostate by three-dimensional analysis of daily portal imaging with radiopaque markers. Int J Radiat Oncol Biol Phys 2004;60:30–9.https://doi.org/10.1016/j.
ijrobp.2004.02.045.
[9] Huang E, Dong L, Chandra A, Kuban DA, Rosen II, Evans A, et al. Intrafraction prostate motion during IMRT for prostate cancer. Int J Radiat Oncol 2002;53:261–8.
https://doi.org/10.1016/S0360-3016(02)02738-4.
[10] Létourneau D, Martinez AA, Lockman D, Yan D, Vargas C, Ivaldi G, et al.
Assessment of residual error for online cone-beam CT-guided treatment of prostate cancer patients. Int J Radiat Oncol Biol Phys 2005;62:1239–46.https://doi.org/10.
1016/j.ijrobp.2005.03.035.
[11] Mah D, Freedman G, Milestone B, Hanlon A, Palacio E, Richardson T, et al.
Measurement of intrafractional prostate motion using magnetic resonance imaging.
Int J Radiat Oncol Biol Phys 2002;54:568–75.https://doi.org/10.1016/S0360- 3016(02)03008-0.
[12] Kupelian PA, Langen KM, Willoughby TR, Wagner TH, Zeidan OA, Meeks SL. Daily variations in the position of the prostate bed in patients with prostate cancer re- ceiving postoperative external beam radiation therapy. Int J Radiat Oncol Biol Phys 2006;66:593–6.https://doi.org/10.1016/j.ijrobp.2006.05.071.
[13] Bayman NA, Wylie JP. When should the seminal vesicles be included in the target volume in prostate radiotherapy? Clin Oncol 2007;19:302–7.https://doi.org/10.
1016/j.clon.2007.03.005.
[14] Boehmer D, Maingon P, Poortmans P, Baron M-H, Miralbell R, Remouchamps V, et al. Guidelines for primary radiotherapy of patients with prostate cancer.
Radiother Oncol 2006;79:259–69.https://doi.org/10.1016/j.radonc.2006.05.012.
[15] AJ H, JM M, AB K, Lehman M, KL W, Skala M, et al. Australian & New Zealand faculty of radiation oncology genito‐urinary group: 2010 consensus guidelines for definitive external beam radiotherapy for prostate carcinoma. J Med Imaging Radiat Oncol 2010;54:513–25.https://doi.org/10.1111/j.1754-9485.2010.
02214.x.
[16] van der Wielen GJ, Mutanga TF, Incrocci L, Kirkels WJ, Vasquez Osorio EM, Hoogeman MS, et al. Deformation of prostate and seminal vesicles relative to in- traprostaticfiducial markers. Int J Radiat Oncol Biol Phys 2008;72:1604–11.
https://doi.org/10.1016/j.ijrobp.2008.07.023. e3.
[17] Mak D, Gill S, Paul R, Stillie A, Haworth A, Kron T, et al. Seminal vesicle inter- fraction displacement and margins in image guided radiotherapy for prostate cancer. Radiat Oncol 2012;7:139.https://doi.org/10.1186/1748-717X-7-139.
[18] Smitsmans MHP, de Bois J, Sonke J-J, Catton CN, Jaffray DA, Lebesque JV, et al.
Residual seminal vesicle displacement in marker-based image-guided radiotherapy for prostate cancer and the impact on margin design. Int J Radiat Oncol 2011;80:590–6.https://doi.org/10.1016/j.ijrobp.2010.06.026.
[19] Liang J, Wu Q, Yan D. The ROLE of seminal vesicle motion in target margin as- sessment for online image-guided radiotherapy for prostate cancer. Int J Radiat Oncol Biol Phys 2009;73:935–43.https://doi.org/10.1016/j.ijrobp.2008.10.019.
[20] Beltran C, Herman MG, Davis BJ. Planning target margin calculations for prostate radiotherapy based on intrafraction and interfraction motion using four localization methods. Int J Radiat Oncol Biol Phys 2008;70:289–95.https://doi.org/10.1016/J.
IJROBP.2007.08.040.
[21] Marcel van H, KH M. Automatic three‐dimensional correlation of CT‐CT, CT‐MRI, and CT‐SPECT using chamfer matching. Med Phys 1998;21:1163–78.https://doi.
org/10.1118/1.597344.
[22] Shibayama Y, Arimura H, Hirose T, Nakamoto T, Sasaki T, Ohga S, et al.
Investigation of interfractional shape variations based on statistical point distribu- tion model for prostate cancer radiation therapy. Med Phys 2017;44:1837–45.
https://doi.org/10.1002/mp.12217.
[23] Haekal M, Arimura H, Hirose T-A, Shibayama Y, Ohga S, Fukunaga J, et al.
Computational analysis of interfractional anisotropic shape variations of the rectum in prostate cancer radiation therapy. Phys Medica 2018;46:168–79.https://doi.
org/10.1016/j.ejmp.2017.12.019.
[24] Lorensen WE, Cline HE. Marching cubes: a high resolution 3D surface construction algorithm. Comput Graph 1987;21:163–9.
[25] Gardner SJ, Wen N, Kim J, Liu C, Pradhan D, Aref I, et al. Contouring variability of human- and deformable-generated contours in radiotherapy for prostate cancer.
Phys Med Biol 2015;60:4429–47.https://doi.org/10.1088/0031-9155/60/11/
4429.
[26] Fiorino C, Reni M, Bolognesi A, Cattaneo GM, Calandrino R. Intra- and inter-ob- server variability in contouring prostate and seminal vesicles: implications for conformal treatment planning. Radiother Oncol 1998;47:285–92.https://doi.org/
10.1016/S0167-8140(98)00021-8.
[27] Oehler C, Lang S, Dimmerling P, Bolesch C, Kloeck S, Tini A, et al. PTV margin definition in hypofractionated IGRT of localized prostate cancer using cone beam CT and orthogonal image pairs withfiducial markers. Radiat Oncol 2014;9:229.
https://doi.org/10.1186/s13014-014-0229-z.
[28] ICRU. Prescribing, recording and reporting photon-beam intensity modulated ra- diation therapy (IMRT) (ICRU Report 83). vol. 10. 2010. doi: 10.1093/jicru/
ndq025.
[29] Brock KK, Mutic S, McNutt TR, Li H, Kessler ML. Use of image registration and fusion algorithms and techniques in radiotherapy: report of the AAPM radiation therapy committee task group no. 132. Med Phys 2017;44(7):e43–76.
[30] Frank SJ, Dong L, Kudchadker RJ, De Crevoisier R, Lee AK, Cheung R, et al.
Quantification of prostate and seminal vesicle interfraction variation during IMRT.
Int J Radiat Oncol Biol Phys 2008;71:813–20.https://doi.org/10.1016/j.ijrobp.
2007.10.028.
[31] Skarsgard D, Cadman P, El-Gayed A, Pearcey R, Tai P, Pervez N, et al. Planning target volume margins for prostate radiotherapy using daily electronic portal imaging and implantedfiducial markers. Radiat Oncol 2010;5:52.https://doi.org/
10.1186/1748-717X-5-52.
[32] Tanyi JA, He T, Summers PA, Mburu RG, Kato CM, Rhodes SM, et al. Assessment of planning target volume margins for intensity-modulated radiotherapy of the pros- tate gland: role of daily inter- and intrafraction motion. Int J Radiat Oncol Biol Phys 2010;78:1579–85.https://doi.org/10.1016/j.ijrobp.2010.02.001.
[33] Willoughby TR, Kupelian PA, Pouliot J, Shinohara K, Aubin M, Roach M, et al.
Localization and real-time tracking using the calypso 4d localization system in patients with localized prostate cancer. Int J Radiat Oncol Biol Phys 2006;65:528–34.https://doi.org/10.1016/j.ijrobp.2006.01.050.
[34] Wu QJ, Thongphiew D, Wang Z, Mathayomchan B, Chankong V, Yoo S, et al. On- line re-optimization of prostate IMRT plans for adaptive radiation therapy. Phys Med Biol 2008;53:673–91.https://doi.org/10.1088/0031-9155/53/3/011.
[35] Vargas C, Martinez A, Kestin LL, Yan D, Grills I, Brabbins DS, et al. Dose-volume analysis of predictors for chronic rectal toxicity after treatment of prostate cancer with adaptive image-guided radiotherapy. Int J Radiat Oncol Biol Phys 2005;62:1297–308.https://doi.org/10.1016/j.ijrobp.2004.12.052.
[36] Huang EH, Pollack A, Levy L, Starkschall G, Dong L, Rosen I, et al. Late rectal toxicity: dose-volume effects of conformal radiotherapy for prostate cancer. Int J Radiat Oncol Biol Phys 2002;54:1314–21.https://doi.org/10.1016/S0360- 3016(02)03742-2.
[37] Palorini F, Cozzarini C, Gianolini S, Botti A, Carillo V, Iotti C, et al. First application of a pixel-wise analysis on bladder dose–surface maps in prostate cancer radio- therapy. Radiother Oncol 2016;119:123–8.https://doi.org/10.1016/j.radonc.
2016.02.025.
[38] Improta I, Palorini F, Cozzarini C, Rancati T, Avuzzi B, Franco P, et al. Bladder spatial-dose descriptors correlate with acute urinary toxicity after radiation therapy for prostate cancer. Phys Medica 2016;32:1681–9.https://doi.org/10.1016/j.ejmp.
2016.08.013.
[39] Pederson AW, Fricano J, Correa D, Pelizzari CA, Liauw SL. Late toxicity after in- tensity-modulated radiation therapy for localized prostate cancer: an exploration of dose-volume histogram parameters to limit genitourinary and gastrointestinal toxicity. Int J Radiat Oncol Biol Phys 2012;82:235–41.https://doi.org/10.1016/j.
ijrobp.2010.09.058.
[40] Lee WR, Dignam JJ, Amin M, Bruner D, Low D, Swanson GP, et al. NRG Oncology RTOG 0415: a randomized phase III non-inferiority study comparing two fractio- nation schedules in patients with low-risk prostate cancer. J Clin Oncol 2016;34:1.
https://doi.org/10.1200/jco.2016.34.2_suppl.1.
[41] Mavroidis P, Komisopoulos G, Buckey C, Mavroeidi M, Swanson GP, Baltas D, et al.
Radiobiological evaluation of prostate cancer IMRT and conformal-RT plans using different treatment protocols. Phys Medica 2017;40:33–41.https://doi.org/10.
1016/j.ejmp.2017.07.003.
[42] Kron T, Thomas J, Fox C, Thompson A, Owen R, Herschtal A, et al. Intra-fraction prostate displacement in radiotherapy estimated from pre- and post-treatment imaging of patients with implantedfiducial markers. Radiother Oncol 2010;95:191–7.https://doi.org/10.1016/j.radonc.2010.01.010.