九州大学学術情報リポジトリ
Kyushu University Institutional Repository
日本における多次元の貧困と厚生に関する実証研究
王, 瑋
https://doi.org/10.15017/1866250
出版情報:Kyushu University, 2017, 博士(経済学), 課程博士 バージョン:
権利関係:
1
Empirical Study of Multidimensional Poverty and Well-being: Evidence from Japan
Wei Wang
Graduate School of Economics Kyushu University
Japan
July, 2017
2
Committee on Dissertation Guidance
Chief supervisor
Associate professor Kunio URAKAWA
Co-supervisors
Associate professor Takeshi MIYAZAKI Associate professor Yuki HASHIMOTO
3
Acknowledgement
First and foremost, I would like to express my deep gratitude to my supervisor, Prof.
Kunio Urakawa, for continuous support, expert guidance, and encouragement throughout of my study and research. It has been a great honor to be his first Chinese Ph.D. student.
The enthusiasm and love he has for his research was contagious and motivational for me during the entire time I spent in Kyushu University. His guidance and insightful discussions helped me at all the times during the research and writing of this thesis. I am thankful for the excellent example he has provided as a researcher, mentor, instructor, and role model.
In addition, I would like to thank two sub-supervisors of my thesis committee, Prof.
Takeshi Miyazaki and Prof. Yuki Hashimoto, for their insightful comments and encouragement. Thanks to their hard and good questions, I was able to widen my research perspectives.
Dozens of people have helped me to finish my studies at Kyushu University. I extend my sincere appreciation to Tomoya Tokudomi, Kyoko Anegawa, and Masrul Alam who provided me opportunities to collaborate, and who helped me with employment related to the economics of poverty research. My time at Kyushu University was enriched by spending an enjoyable time with them as friends. Additionally, I would like to acknowledge and express my gratitude for the enormous amount of help and cooperation with Prof. Kunio Urakawa and Masrul Alam while finishing chapter 3 of this thesis. I humbly recognize that I have been lucky to work with them on such very interesting research.
Furthermore, special thanks go to all colleagues and staff members at the Faculty of Economics at Kyushu University, who helped me throughout this academic exploration.
Last but not least, I would like to thank my family: my parents who raised me with their unconditional love, constant support, faith, and encouragement. Thank you.
4
Index
Abstract
p.5 Chapter 1: Introduction
p.7
Chapter 2: Effects of multidimensional poverty on health indicators in Japan: income, living time, and social inclusion
p.23
Chapter 3: Potential impacts of income and time poverty on daily recreational activities in Japan
p. 40
Chapter 4: Analysis of poverty of income and living time:
An approach from estimation of CES well-being function
p.58
Chapter 5: Enrollment and graduation effects of university on poverty risk – Empirical analysis based on propensity score matching –
p.83
Chapter 6: Conclusion
p.98 References
p.104
5
-Abstract-
A decreasing trend of extreme poverty has prevailed worldwide because of worldwide economic growth and international efforts at poverty reduction such as the Millennium Development Goals (MDGs) advocated by the United Nations. Nevertheless, as many researchers have pointed out, the benefits of growth have not been equally distributed. Consequently, globalization has been raising inequality and poverty in economically developed countries. According to recent OECD statistics, the relative poverty ratios of most OECD countries have increased from the mid-1980s to the mid- 2010s.
Economists and policymakers have long been interested in income distribution, partially because changes in income disparity and poverty are expected to affect numerous social outcomes such as national health, educational achievement, social mobility, trust, and crime. Reducing excessive income disparity and poverty is the consensus choice of policy for building a harmonious society.
Nevertheless, as Amartya Sen pointed out with his capability approach, inequality and poverty include multidimensional aspects. In reality, shortages of nonmonetary factors such as leisure time spent with family members and social relations in society sometimes play a more important role in human well-being than monetary factors such as income. Therefore, for poverty analysis, nonmonetary dimensions such as time and social relations should be regarded as important dimensions.
Based on the problem consciousness explained above, this dissertationpresents an investigation of multidimensional poverty and well-being in Japan. Specifically, it presents the following assessments: (1) what multiple poverty situations people are facing, along with socioeconomic factors, influence people’s well-being and daily activities; (2) what socioeconomic factors affect multidimensional poverty including the time dimension; and (3) whether higher education can truly reduce the risk of multidimensional poverty.
This dissertation comprises six main chapters. Chapter 1 describes recent trends of inequality and poverty around the world and, after reviewing earlier reports of the relevant literature, presents research objectives and the potential contributions of this dissertation.
Additionally, it provides a theoretical framework for the analysis of multidimensional poverty and well-being in Japan.
Chapter 2 measures the multidimensional poverty index based on the method used by Alkire and Foster (2011a) using individual data from the Japanese Study of Stratification, Health, Income, and Neighborhood (J-SHINE; 2010, 2012). After setting
6
three dimensions of poverty (income, living time, and social inclusion), the index presents multidimensional poverty effects on key health indicators of self-rated health (SRH) and psychological distress (K6), while controlling other important variables. Results obtained from the analysis confirm the practical relevance of multidimensional poverty for predicting health indicators.
Chapter 3 describes an examination of the relations between income and time poverty, and physical activities, using the household micro-dataset in Japan. The estimation results obtained from econometric models reveal that time poverty is closely associated with low frequency of reading and short duration of sleeping. Indeed, analysis results show differences between women and men. For men, individuals who are deprived in two dimensions of poverty tend not to participate in sports. In addition, lack of leisure time might prevent them from actively reading, while getting less sleep. For women, time poverty is an important determinant of visiting interesting places and reading actively.
Chapter 4 presents estimation of the socioeconomic causes of interdependent multidimensional (IMD) poverty by considering two interdependent dimensions: income and leisure time. Using panel data from a Japan Household Panel Survey (JHPS2011- JHPS2014), this chapter presents specific quantification of the degree of substitution between income and leisure time via the estimation of CES-utility function, following the methodology provided by Merz and Rathjen (2014). After the quantification, we examine socioeconomic factors that influence each IMD poverty regime. Results suggest that not a few single-parent households confront interdependent multidimensional poverty. In addition, full-time employed couples with preschool children particularly confront IMD poverty, using their incomes to compensate for their time deficit.
Chapter 5 investigates the effects of university enrollment and graduation on interdependent multidimensional poverty. Using the analytical method called propensity score matching, we examine the true effects of college entrance and graduation on the risks of income poverty and IMD poverty. Estimation results suggest a poverty reduction effect of a college degree for men for both income poverty and IMD poverty. However, for women, the effect of a college degree on IMD poverty reduction is much weaker than in the case of men. It can be considered that the difficulty of work–life balance and low wage levels of female workers affect the results for Japan.
Chapter 6 presents a summary and conclusions of this dissertation. The conclusions support the view that multiple dimensions of poverty are more closely associated with people’s well-being such as self-rated health and physical activities. Particularly, the time dimension plays an extremely important role in Japan because not a few groups are regarded as time poor. Policy implications are suggested based on empirical evidence.
7
Chapter 1: Introduction
1.1 Current Status of Inequality and Poverty
Thomas Hobbes (1651) argued that nations act selfishly just as human beings do.
Each country has been driven continuously by the pursuit of power and wealth during past centuries. Fortunately, many countries in the world have enjoyed their golden ages of growth since World War II. Herculean efforts for postwar reconstruction led to great development, particularly in Western European and eastern Asian countries. By virtue of that global economic growth, most world citizens have become richer than ever. However, as every coin has two sides, the benefits of global growth have not been equally distributed. That imbalance has raised social issues such as inequality and poverty.
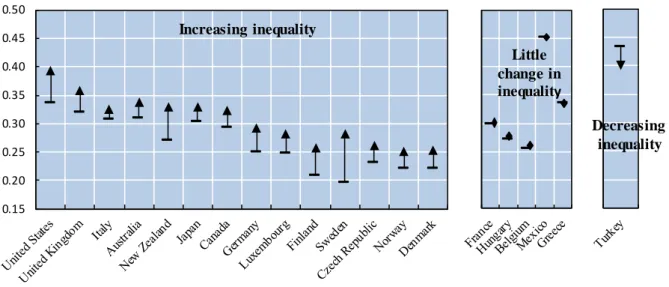
A recent OECD study has revealed that the income gap separating the top 10 percent and the bottom 10 percent among OECD countries is now at its highest level in the past 30 years (OECD, 2011a). Figure 1-1 presents the Gini coefficients (a representative measure of inequality) of most OECD countries, which have grown more than 2 percentage points from the mid-1980s to the mid-2010s, although only Turkey has posted a decreasing level of Gini coefficient. Today, the richest 10% of the population in the OECD area earn 9.5 times more than the poorest 10% (OECD, 2011a).
Economists and policymakers have long been interested in income distribution, partly because changes in income disparity are expected to affect numerous social outcomes such as national health, educational achievement, social mobility, trust, and crime (Wilkinson and Pickett, 2007; Bagchi and Svejnar, 2015). Reducing excessive income disparity is the consensus choice of policy for building a harmonious society.
Economists who have specifically examined rising income inequality have already identified some important factors related to the trend: technological change, growth of financial services, changing pay norms, reduced roles of trade unions, and scaling back of redistributive tax-and-transfer policies (Atkinson, 2015). Recently, Piketty (2014) provided a new perspective: inequality is not an accident but is instead the result of a feature of capitalism. He pointed out in his book “Capital in the 21st Century” that the rate of return on capital (r) is constantly greater than the rate of economic growth (g). Piketty (2014) also argued that the change in global inequality has depended primarily on technological progress such as the IT revolution of the leading economically developed countries and its prevalence among all the countries of the world.
8
1.2 Globalization and Poverty
Many researchers who agree with Piketty and Lee’s ideas associate them with the relation that prevails among globalization, inequality, and poverty. They endorse the idea that globalization positively affects income inequality and poverty (Lee, 2014). However, the relations between globalization, income inequality, and poverty are complex. Not a few researchers have argued that globalization promotes economic growth and poverty reduction, although widespread criticisms exist.
Libertarians assert that the process of globalization actually provided excellent opportunities for humankind to contribute to the decline of poverty around the world during the past several decades. Figure 1-2 presents the trend of the headcount ratio which represents extreme poverty. The World Bank uses the poverty line defined as the “$1.9- a-day” at 2011 PPP level. This extreme or absolute poverty line represents the share of the population living on expenditures of less than US$1.9 per day. As the figure shows, eastern Asia and Pacific countries show strong performance related to poverty reduction.
In the past two decades, the region reduced the population in poverty by 56.7 percentage points, down to 3.5 percent. The level approaches the World Bank’s global target of 3.0 percent in 2030. The reduction is largely explained by the economic growth of China.
Eastern Europe and Central Asia have maintained a slow but steady decline in the headcount ratio to around 2 percent. Poverty estimates in southern Asia indicate substantial progress, particularly in the five years up to 2013. Poverty reduction in southern Asia has been driven mainly by India’s economic growth (World Bank, 2016).
Not a few workers in economically developing countries such as China and India have found new jobs because of expanding foreign trade and investment. In addition, poor people can newly access capital. They have more opportunities to learn new skills. The globalization process opens markets, spreads knowledge of advanced technology, and expands the division of labour, which also improves wages and incomes for people in these regions. Consequently, extreme poverty has declined dramatically in economically developing countries through integration of the global economy. They have reduced their extreme poverty by slashing protective tariffs and by increasing their participation in world trade.
However, it is somewhat complex to describe the benefits of globalization in economically developed regions, where there are almost no extremely poor people. The reasons for opposition to globalization are related mainly to three aspects of its impact:
(1) the fragility of valued local and indigenous cultures in society facing the onslaught of global mass production and cultural homogenization, (2) the economic devastation of
9
billions of dollars of volatile short-term capital stampeding around the globe in herd-like crushes, and (3) the losses of jobs, wages, and incomes of poorer people to competitive international trade and foreign investment, along with the weakening ability of the state to compensate for this damage and to alleviate poverty (Bardhan, 2006).
Therefore, a salient concern of globalization’s critics is its impact on rising inequality in economically developed countries. As shown in Figure 1-1, inequality has risen in most OECD countries in the past three decades. In recent years, wage differences between skilled workers and unskilled workers have been growing, or between regular workers and non-regular workers in economically developed countries. How can globalization change the form of income distribution? Atkinson (2015) emphasized that through the enlargement of globalization, advanced economies face increased competition with immigrants from countries where wages of unskilled workers are lower.
Industries that rely heavily on unskilled workers find it difficult to continue to compete within the country. As a result, jobs are lost or outsourced to lower-wage countries.
However, globalization increases demand for higher-educated workers. Therefore, a handful of highly skilled workers in economically developed countries can obtain more money, reflecting production shifts towards high-skill sectors. Atkinson’s theory can partially clarify the reasons underlying rising inequality and poverty in economically developed countries.
1.3 Inequality and Poverty in Japan
Regarding inequality and poverty, this dissertation primarily addresses the Japanese experience. The analysis related to Japan is of particular interest, not only because Japan caught up with other economically developed countries within a very short time and became the world’s second largest economy after the WW II, but also because its dramatic change of industrial structure has given rise to several pressing social issues even now.
As Piketty (2014) emphasized, understanding the current circumstances of expanding inequality and poverty in representative countries can help us to derive and clarify reasons underpinning increasing inequality and poverty throughout the world.
Many Japanese people agreed with the idea that Japan was an egalitarian society until the late 1980s. However, income inequality has increased since the beginning of the 1990s as a consequence of the economic bubble and its eventual collapse, in addition to other rapid social changes such as its aging population and declining birthrate (Tachibanaki, 2009). Japan is now confronting poverty and income inequality, which both pose severe social problems just as they do in other economically developed countries.
10
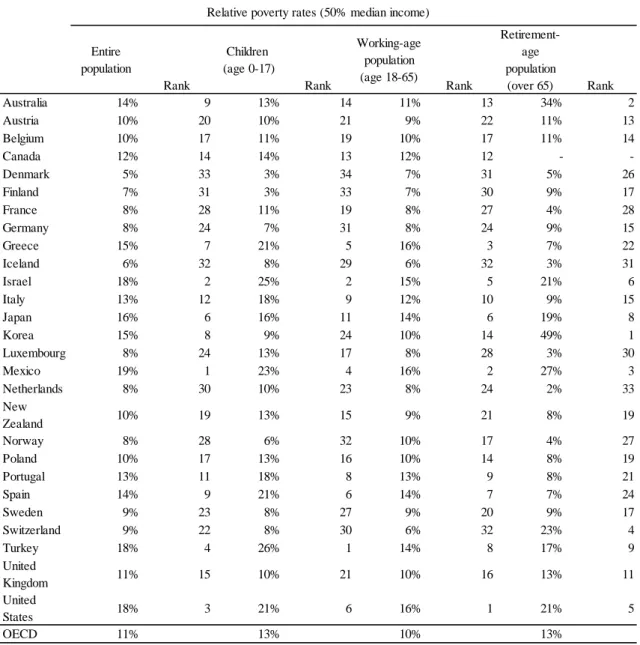
Actually, the OECD reported in recent years that Japan has high rates of relative poverty, which is defined as a state in which the household income is at a level below half of the median of equilibrated income (OECD, 2016a). Figure 1-3 shows that Japan’s relative poverty rate is 16%: sixth among all OECD members. With 16 percent of children (age 0–17) and 14 percent of working-generation (age 18–64) living in poverty, groups such as children and the working generation are confronting poverty risks in Japan along with elderly people.
“Working poor” is a neologism describing a phenomenon by which people are unable to realize an acceptable livelihood despite being employed as workers. The
“working poor” phenomenon often occurs among irregular workers, who now account for approximately one-third of the nation’s workers in Japan. In addition, Abe (2008) claimed that approximately one in every 6.5 children is living in relative poverty now.
What is worrisome is the replication of poverty as children from low-income families are unable to benefit from higher education and other cultural resources. Because child poverty is partly attributable to the existence of single parent families, and because the poverty rate of single-parent households in Japan is now the highest among OECD nations, the government must ensure access to high-quality childcare, particularly to compensate for increasingly common circumstances of single parenthood. In doing so, it can help to break the cycle of disadvantage from one generation to the next. According to OECD data (2016b), childcare costs for single parents vary among OECD countries. In Japan, childcare costs for a lone parent account for over 20% of net income, although the United States spends over half of income on childcare costs (Figure 1-4). Moreover, childcare costs for a dual-earner couple in Japan claims more income than the OECD average. The Japanese government improved its child-raising support payment (called “kodomo teate”
in Japanese) from 2011. Some examples are that government provides ¥15,000 per month for each child under age three for Japanese or foreign parents who are living with their children in Japan. Nevertheless, some large cities such as Tokyo are facing a severe shortage of day care centers for young children. Consequently, it is still necessary to take more political action for child support systems to help employees to raise children in Japan.
Many studies have examined changes in income inequality and the factors that have brought about these changes. The various causes of income inequality and poverty in Japan can be summarized by two main factors: (1) endogenous factors such as reforms of the wage system (Uni, 2008a; Uni, 2008b), non-regularization of employment (Ota, 2005;
Tachibanaki and Urakawa, 2006), population aging (Ohtake, 2003), and others; and (2) exogenous factors such as a demand shift towards skilled labour and changes in relative
11
factor prices by trade (Sakurai, 2000; Sakurai, 2004) (Figure 1-5).
Regarding the poor working generation, Tachibanaki and Urakawa (2006) described that the type of household most affected by the rise in unstable employment has been single-person households of working age, which is a main cause of rising poverty. Ota (2005) and Uni (2008a) also presented the view that poverty in Japan’s young generation is mainly attributable to the effects of a rapid increase of non-regularization since the economic recession occurred in the 1990s.
Regarding exogenous factors, Atkinson (2015) argued that globalization contributes to the growth of wage differences between skilled workers and unskilled workers, which should be regarded as a main reason for inequality in Japan. However, he also presented an opposite perspective that a country with highly skilled labourers might receive benefit from globalization because it can fully offer advanced products and services. In addition, Uni (2008a) argued that the influence of IT and globalization on wages is unlikely to bring wage inequality in Japan. The influence of IT and globalization on wages is reflected mainly in the institutional reactions of enterprises. These institutional reactions are influenced by various internal and external changes in the enterprise, such as aging of the employees and deregulation.
Several economists including Atkinson (2015) and Boyer (2016) have recommended that the Japanese government take some appropriate political actions to reduce expanding income inequality and poverty. In addition, working long hours has become an important issue in Japan because it is expected to affect Japanese people’s quality of life directly.
According to OECD statistics, workers in 2014 worked for about 1,729 hours in Japan on average, 1,789 hours in United States, 1,473 hours in France, and 1763 hours in the OECD average level (Figure 1-6). Average working hours per year in Japan have been declining gradually during recent decades. They dropped below that of the US after the mid-1990s.
However, some reports of the relevant literature suggest that this large decline in hours worked was mainly attributable to the severe and prolonged recession in Japan during the 1990s (Japan’s lost decade) and the polarization of employment. Furthermore, since the 1990s, part-time employees and retirees going to work began to contribute to a large percentage of the nation’s labour force. Actually, from a Japanese time-use survey,
“Survey on Time Use and Leisure Activities”, Kuroda (2010) found that the average hours spent for market work per week among full-time male employees has increased during the last three decades (Figure 1-7). Consequently, it is difficult to say that Japanese working hours have become shorter than before.
In 2016, death from overwork became a hot topic again in Japan when a young female employee at the advertising giant Dentsu Inc. committed suicide, mainly because
12
of her excessive working hours. The phenomenon is called “Karoshi” in Japan. Overwork and excessive stress cause severe health problems such as cerebral/heart diseases, mental disorders, and eventually, death. Since then, the Japanese government has set a cap on overtime hours as part of its “work style reform” agenda.
In addition, an increase in unstable work and overwork might engender an increase in the risk of the social exclusion from Japanese society. The concept of social exclusion is regarded as covering a remarkably wide range of social and economic problems.
According to Sen (2000), social exclusion is directly a part of capability poverty. It reflects a situation of exclusion from social relations, and engenders other deprivations as well, thereby limiting people’s leisure opportunities further. For Abe (2012), the lack of social relations and social participation is closely related to income poverty in Japan.
Moreover, Ikeda et al. (2013) emphasized that good social relationships can contribute to good health conditions for Japanese people. Therefore, it has become necessary to use a class of multidimensional poverty measures rather than other measures merely addressing particular monetary aspects such as income if one wants to capture the poverty trend based on the complex situations of Japanese society.
1.4 Growing Argument Related to Multidimensional Poverty
1.4.1 Multiple Perspectives for Defining Poverty
Philosophically, Bossuet’s phrase about living “under a roof of falling tiles” aptly describes multidimensional poverty. People know that, in their condition, multiple disadvantages are going to keep striking at them, although they might not know which problems will strike, or when, or how (Alkire et al., 2015).
Amartya Sen (1985b) urges that “human lives are battered and diminished in all kinds of different ways.” Thereby, poverty must be viewed more broadly and more multidimensionally than merely inadequately using readily available economic metrics.
He argues that poverty demands emphasis upon the moral significance of individuals’
capabilities of achieving the kind of life they have reason to value. Consequently, in the context of Sen’s account, poverty or inequality includes not having sufficient earnings or savings to ensure basic needs (monetary deprivation), as well as being denied access to political participation, education, or social included role in society (non-monetary deprivation). Sen recognizes that poverty is sometimes related to the norms and customs of a society in which someone lives. Full participation in a wealthy society might require more money than participation in a poor one (Deaton, 2006).
In addition, Tsui (2002) favored a multidimensional perspective to poverty where
13
“human deprivation is visualized not through income as an intermediary of basic needs but in terms of shortfalls from the minimum level of basic needs themselves.” Deaton (2006) argued that poverty is a multidimensional phenomenon encompassing lack of access to various basic necessities such as nutrition, health, education, housing, security, and opportunities for future improvement.
1.4.2 Monetary Dimensions and Non-Monetary Dimensions
Sen’s understanding of poverty based on a capability approach has attracted many scholars. To capture a multidimensional picture of one’s living situation, Oxford Poverty
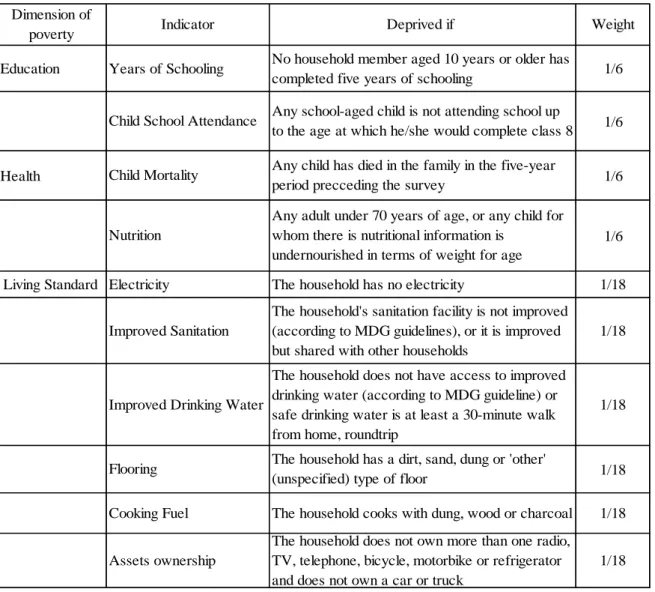
& Human Development Initiative (OPHI) published the Multidimensional Poverty Index (MPI) for analysis of multiple poverty variables. The MPI uses information from 10 indicators organized into three dimensions (Table 1-1): health, education, and living standards (Alkire et al., 2016).
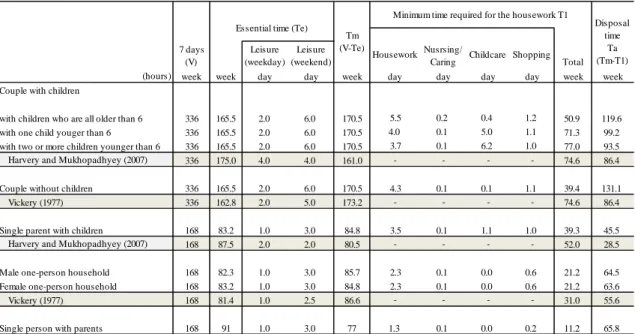
Researchers select multiple dimensions for measuring poverty based mainly on (1) monetary dimensions (e.g., income, consumption, asserts, wealth, housing conditions), and (2) non-monetary dimensions (e.g., food, water, educational attainment, skills, well- being, security, social inclusion) (Alkire and Foster, 2011b). However, few of them have drawn attention explicitly to the time dimension. Capabilities that Sen emphasized toward poverty reduction are defined as individual’s freedom and opportunities to achieve the kind of life that they have reason to value (Sen, 1992). In this context, securing leisure time for the realization of various opportunities should be regarded as a candidate for use as a poverty dimension because time is regarded as a basic resource to enable and restrict individuals’ activity. Since Vickery (1977) provided a new way of analyzing leisure time, earlier reports of the relevant literature have highlighted the situation of time poverty, and have demonstrated that not a few people or groups nowadays are lacking time. For example, Harvey and Mukhopadhyay (2007) reported a high time-poverty rate for single- parent households in Canada. Ishi and Urakawa (2014) found that in Japan as well, and showed that not only single-parent households but also double earner (both full time employed) couples with small children are greatly deprived in terms of time resources.
1.4.3 Measurement of Multidimensional Poverty
As Alkire and Foster (2011b) described, methods of measuring poverty can be affected by the way in which we grasp poverty. For this reason, the measurement methodologies of poverty can be of important and practical relevance (Alkire and Foster, 2011b)
The multiple measurements of poverty mainly include two distinct steps:
14
identification and aggregation. Identification means to identify the poor: “who is poor.”
Alkire and Foster method (AF method) counts the overlapping or simultaneous deprivations that a person or households experience in different indicators of poverty. In the identification step, several appropriate dimensions for explaining the situation of deprivation on quality of life are selected first. The indicators which estimate the level of deprivation might assign equal weights or different weights for each dimension. Next, choose poverty lines (or cut-offs (Alkire and Foster (2011a)) for each dimension/indicator.
The poverty line is useful to identify the lower distribution.
Secondly, the aggregation step is accomplished by selecting a poverty index, which brings poor people together into an overall indicator of poverty. The widely used aggregation poverty measures are, for instance, the headcount ratio, poverty gap, and the FGT index.
Much attention has been devoted to the aggregation step in poverty measurement through which the data are combined into an overall indicator of multidimensional poverty. However, each aggregation technique relies on a prior identification step (Alkire and Foster, 2011a). Consequently, devoting more attention to the identification of multiple poverty is likely to be an ethical way for economists’ thinking, whereas the aggregation step is an analytical tool for the multidimensional measurement of inequality and poverty.
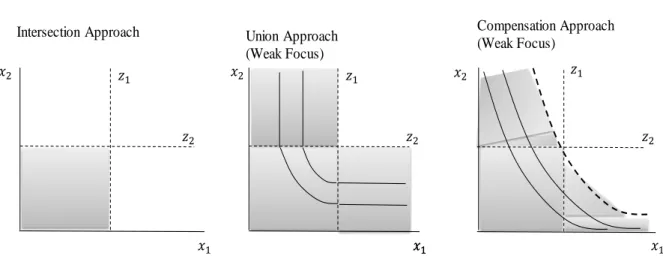
To reveal a comprehensive picture of social problems in Japan, several approaches are applied in this dissertation to identify multidimensional poverty, as presented in Figure 1-8: a “union” approach, an “intersection” approach, and a “compensation” approach.
First, a “union” approach indicates that we regard persons who are deprived in a single dimension as poor. Most economists employ this approach, and use economic resources such as income or consumption expenditure as at least one dimension to estimate poverty.
However, the “union” approach might engender exaggerated estimates of poverty, because it overly regards numerous people as poor once the dimensions that are considered increase. Second, an “intersection” approach regards a person who is deprived in all dimensions as poor. This approach might be too strict sometimes, compared to a
“union” approach, because very few people will be included in an extreme multiple poverty situation.
In a “compensation approach,” the possibility of substitution among dimensions will be considered. Interdependent multiple poverty measures are estimated based on the form of a utility function. As the example in Figure 1-8 shows, income can compensate insufficient leisure time to some degree because people can purchase housework services from the market and vice versa.
15
1.5 Analytical Framework
Although many reports of the relevant literature have already shown that monetary poverty has several important effects on human well-being, very few studies have examined the effects of multiple poverty dimensions (time, social relation, education and others). As one of the few related studies, Oshio and Kan (2014) investigated the relations between health and multidimensional poverty in Japan using AF method. They found that multidimensional poverty is more useful for predicting poor self-rated health and high psychological distress. However, this analysis did not examine the time dimension specifically. In Japan, the lack of leisure hours caused by long working and commuting times is regarded as strongly related to severe health problems (Iwasaki et al., 2006). As represented by the term “Karoshi,” many Japanese studies have found an association between working hours and cerebrovascular/ cardiovascular disease (Ohtsu et al., 2013).
To ascertain the determinants of health more clearly, an analysis should be conducted while incorporating the viewpoint of securing a minimum amount of leisure hours.
Figure 1-9 depicts the framework of this dissertation based on the multiple poverty measures described in the previous section. First, the empirical analysis presented in chapter 2 investigates the effects of multidimensional poverty including income poverty, time poverty, and social exclusion, on key health indicators in Japan: self-rated health (SRH) and psychological distress (K6), based on the multidimensional poverty approach presented by Alkire and Foster (2011a). The contribution of this paper in the field of multiple poverty studies is to examine leisure time specifically, and to emphasize the impact of multidimensional poverty, including the time dimension, on an individual’s health.
In addition, many empirical results of studies suggest that people who actively engage in physical activities are more likely to show better health status and well-being.
Consequently, chapter 3 specifically examines relations between income and time poverty, and physical activity. Therefore, this chapter presents estimation of the effects of multiple poverty dimensions on the degree of daily recreational activities using the household micro-dataset in Japan. Actually, the estimation results show that time poverty is highly associated with a low frequency of reading and short-duration sleeping. Indeed, different results are obtained for women and men by checking the effects of cross terms. For men, individuals who are deprived in two dimensions of poverty tend not to participate in sports.
In addition, lack of leisure time might prevent them from actively reading, while getting less sleep. For women, time poverty is also an important determinant to visit interesting
16
places and to read actively. An important contribution to this paper is to confirm the importance of the time dimension, and to emphasize the direct relation between multiple poverty dimensions and people’s well-being.
Regarding the analysis of income and time, Ishi and Urakawa (2014) reported that time poverty can be reduced by payment for housework services. Empirical results obtained from this analysis found that the head ratio of income poor people increased by 2 points after time adjustment, and confirmed a tradeoff relation between money and time.
However, using a compensation approach, Merz and Rathjen (2014) found an important fraction of time poor people who are unable to substitute their time deficit by income.
Therefore, in chapter 4, using the CES well-being function, we found some new multiple poverty situations defined as interdependent multidimensional poverty given by Merz and Rathjen (2014). This study revealed that households with very young children are multidimensionally poor because they cannot compensate poverty in one dimension by the other above poverty situation. The contribution of this study is to find more severe poverty situations by considering both income and time. This study provides more valuable policy implications for Japan’s government.
Based on the results obtained from Chapter 4, the study in Chapter 5 undertakes consideration of how we should go about fighting poverty. Chapter 5 examines the potential impact of higher education on interdependent multiple poverty. The contribution of this analysis is to highlight the importance of accessing higher education because it can help young people grow into a person capable of escaping from the multifarious poverty that the person can expect to confront in the future. In Chapter 6, this dissertation suggests and discusses several policy implications that promise to be more successful in helping governments and policymakers decide to invest in human capital, which is the best solution for reducing poverty in Japan.
17
Figure 1-1: Income inequality in OECD countries Gini Coefficient, Mid-1980s and 2014
Note: “Little change” in inequality refers to a change of less than 2 percentage points.
Source: OECD (2011a) p.24.
OECD Database on Household Income Distribution and Poverty.
Figure 1-2: Trend of extreme poverty (Headcount ratio) by region [1990–2013].
Source: World Bank (2016) p.39.
Countries where inequality widened
0.15 0.20 0.25 0.30 0.35 0.40 0.45 0.50
Increasing inequality
Decreasing inequality Little
change in inequality
0 10 20 30 40 50 60 70
1990 1993 1996 1999 2002 2005 2008 2011 2013
South Asia East Asia & Pacific
Europe & Central Asia Latin America & Caribbean Middle East & North Africa Sub-Saharan Africa World
Poverty headcount ratio (%)
18
Figure 1-3: Relative poverty rate in OECD (2012 or latest available year).
Source: OECD (2016b) OECD Factbook 2015–2016, p.57.
Entire population
Rank
Children (age 0-17)
Rank
Working-age population (age 18-65)
Rank
Retirement- age population
(over 65) Rank
Australia 14% 9 13% 14 11% 13 34% 2
Austria 10% 20 10% 21 9% 22 11% 13
Belgium 10% 17 11% 19 10% 17 11% 14
Canada 12% 14 14% 13 12% 12 - -
Denmark 5% 33 3% 34 7% 31 5% 26
Finland 7% 31 3% 33 7% 30 9% 17
France 8% 28 11% 19 8% 27 4% 28
Germany 8% 24 7% 31 8% 24 9% 15
Greece 15% 7 21% 5 16% 3 7% 22
Iceland 6% 32 8% 29 6% 32 3% 31
Israel 18% 2 25% 2 15% 5 21% 6
Italy 13% 12 18% 9 12% 10 9% 15
Japan 16% 6 16% 11 14% 6 19% 8
Korea 15% 8 9% 24 10% 14 49% 1
Luxembourg 8% 24 13% 17 8% 28 3% 30
Mexico 19% 1 23% 4 16% 2 27% 3
Netherlands 8% 30 10% 23 8% 24 2% 33
New
Zealand 10% 19 13% 15 9% 21 8% 19
Norway 8% 28 6% 32 10% 17 4% 27
Poland 10% 17 13% 16 10% 14 8% 19
Portugal 13% 11 18% 8 13% 9 8% 21
Spain 14% 9 21% 6 14% 7 7% 24
Sweden 9% 23 8% 27 9% 20 9% 17
Switzerland 9% 22 8% 30 6% 32 23% 4
Turkey 18% 4 26% 1 14% 8 17% 9
United
Kingdom 11% 15 10% 21 10% 16 13% 11
United
States 18% 3 21% 6 16% 1 21% 5
OECD 11% 13% 10% 13%
Relative poverty rates (50% median income)
19
Figure 1-4: Childcare costs in the OECD countries.
Note: figure shows out-of-pocket costs for full-time care at a typical childcare center:
i) a single parent with full-time earnings of 67% of average earnings, and ii) a couple with full-time earnings of 100+67% of average earnings.
“AW” stands for average wage. The OECD average is unweighted.
Source: OECD (2016c) p.30
Figure 1-5: Causes of the rising wage inequality in Japan.
Source: Added to Uni (2008) p.81.
0 15 30 45
60 Cost in % of family net income, 2012
Single parent, 67% of AW Couple, 100% + 67% of AW (↗) cost in %
cost in %
Reforms of the wage system
Non-regularization of employment
Demend shift towards skilled labor Population ageing IT revolution Globalisation
Skill-biased technological change
Outsourcing Changes in relative factor prices by trade
Rise in income inequality
Uni(2008b) Ota(2005) Ohtake(2003)
Cabinet Office(2006) Sakurai(2000,2004)
20
Figure 1-6: Average labour hours per person in all employment (in years).
Source: OECD (2016a) p.233 (Table L) (https://data.oecd.org/emp/hs-worked.htm)
Figure 1-7: Trends in work hours per week (per full-time employee).
Source: Kuroda (2010) p.489, Table 2.
1000 1200 1400 1600 1800 2000 2200
1980 1985 1990 1995 2000 2005 2010 2014
Canada France Germany
OECD Japan United states
0 10 20 30 40 50 60
1976 1981 1986 1991 1996 2001 2006 2011 All samples Male Female
21
Table 1-1: Dimensions, indicators, deprivation cutoffs and weights of the MPI
Source: Alkire et al. (2016) p.5
Education 1/6
1/6
Health 1/6
1/6
Living Standard 1/18
1/18
1/18
1/18 1/18 1/18 Flooring The household has a dirt, sand, dung or 'other'
(unspecified) type of floor
The household cooks with dung, wood or charcoal The household does not own more than one radio, TV, telephone, bicycle, motorbike or refrigerator and does not own a car or truck
Any school-aged child is not attending school up to the age at which he/she would complete class 8
The household's sanitation facility is not improved (according to MDG guidelines), or it is improved but shared with other households
The household does not have access to improved drinking water (according to MDG guideline) or safe drinking water is at least a 30-minute walk from home, roundtrip
Improved Drinking Water Improved Sanitation
Cooking Fuel Assets ownership Child School Attendance
Any child has died in the family in the five-year period precceding the survey
Any adult under 70 years of age, or any child for whom there is nutritional information is
undernourished in terms of weight for age The household has no electricity
Electricity Nutrition Child Mortality Dimension of
poverty Weight
No household member aged 10 years or older has completed five years of schooling
Deprived if Indicator
Years of Schooling
22
Figure 1-8: Identification of multidimensional poverty with intersection, union, and compensation approach.
(Two-dimensional case)
Note: Shaded area represents multidimensional poverty; x1 and x2 are dimension quantities, whereas z1 and z1 are poverty dimension thresholds
Source: Merz and Rathjen (2014) p.455
Figure 1-9: Framework of the paper.
Intersection Approach Union Approach (Weak Focus)
Compensation Approach (Weak Focus)
Reform labor conditions Child care support policies
Support for higher education
Income poverty
Social exclusion
Time poverty IS
IT ST
IST
Chapter 2
Subjective well-being (SRH、K6...)
Daily recreational activities Health related activities Factors
of Multiple poverty
Working conditions Household categories
Number of children Age
Educational background
...
Chapter 4 Findings
of IMD poverty
Chapter 5 Higher education and IMD poverty Impact
23
Chapter 2: Effects of multidimensional poverty on health indicators in Japan: income, living time, and social inclusion
2.1 Introduction
The measurement of multidimensional poverty has been developed and improved recently. An origin of the multidimensional poverty approach, Sen’s capabilities approach, proposed the characterization of poverty from the viewpoint of the degree of freedom that people can achieve (Sen, 1992). Based on the capabilities approach, many studies measured deprivation on widely diverse dimensions such as access to education, living standards, social relations, and health conditions, rather than merely examining income.
In terms of the methodology for identification, Atkinson (2003) discussed a ‘counting approach’ that summarizes the number of dimensions on which people are deprived.
In recent work, Alkire and Foster (2011a) provided a multidimensional approach (hereafter, AF method) that embodied Sen’s capabilities theory and which was motivated by Atkinson’s ‘counting method’ of measuring deprivation. The poverty measurement by AF method can be conceptualized as the following two main steps: identification of who is poor, and aggregation of information related to poverty across society (Alkire and Santos, 2013). For the identification of poverty, both the indicators’ cutoffs zj on each dimension and the poverty cut-off k, which is the number of weighted deprivations required to be considered multidimensionally poor, are considered. For that reason, the AF methodology is said to follow a dual cut-off method of identification (Alkire and Santos, 2013). For measurement of the aggregated poverty indicator, most FGT measures can reflect the width and depth of deprivation from multiple dimensions.
Actually, AF method has been applied to multidimensional poverty analysis to assess various trends of poverty over time in countries and regions throughout the world (Batana, 2013; Battiston et al., 2013; Santos, 2013; Yu, 2013). In these studies, researchers selected important dimensions for measuring poverty based on (1) human psychological needs (e.g., food and water, educational attainment, housing conditions, security) and (2) philosophical human value (e.g., income and wealth, well-being, social inclusion, skills) (Alkire, 2002). However, few such studies have drawn attention explicitly to the time dimension. Capabilities toward poverty reduction that Sen emphasized are defined as individual freedom and opportunities to achieve the kind of life that they have reason to
24
value (Sen, 1992). In this context, securing living hours for the realization of various opportunities should be regarded as a candidate poverty dimension. Time is a finite resource along with money. It can play a salient role in fulfilling basic needs of life (Vickery, 1977).
Previous reports of the relevant literature have specifically described situations of time poverty. They have demonstrated that not a few people or groups nowadays are adversely affected by a lack of time. For example, Harvey and Mukhopadhyay (2007) reported a high time-poverty rate for single-parent households in Canada. After analyzing conditions in Japan, Ishi and Urakawa (2014) showed that not only single-parent households but also double earner (both full-time employed) couples with small children are greatly deprived of time resources.
Importantly, the measurement of poverty incorporating the viewpoint of living hours is expected to complement government efforts at health improvement of people. From European data, Nolan and Marx (2009) observed that low income alone is insufficient to predict who is experiencing poor health and access to health services. Rather, recent studies have demonstrated clear correlation between time poverty and health. For example, Bittman (2002), using Time Use Survey in Australia, demonstrated that women who have less discretionary time are more likely to have poor health.1 These studies fundamentally addressed income and time dimensions. They did not compare the independent effects of respective dimensions and the composite effects multiple dimensions. Regarding relations between health and multidimensional poverty, Oshio and Kan (2014) investigated them in Japan using AF methodology and found that multidimensional poverty is more useful for predicting poor self-rated health and high psychological distress. However, this analysis was conducted on a single-year basis. It did not treat the time dimension.
In Japan, the lack of leisure hours caused by long working and commuting time and other factors is regarded as strongly related to severe health problems (Iwasaki et al., 2006). As represented by the term ‘Karoshi,’ much Japanese research shows an association between working hours and cerebrovascular/ cardiovascular disease (Ohtsu et al., 2013). To ascertain the determinants of health more clearly, an analysis incorporating the viewpoint of the securing a minimum amount of leisure hours should be conducted. Therefore, in this study using Japanese micro-panel data, we examine how multi-dimensional poverty, including that of the time dimension, is associated with health.
1 However, Kalenkoski et al. (2011) showed a positive relation between time poverty and subjectively evaluated health levels using the American Time Use Survey. Regarding this result, they pointed out that it is likely attributable to the fact that employed people have, on average, better health status than those who are not employed, and are also more likely to be time-poor.
25
2.2 Data and Measurement
2.2.1 Data
Data used for this study were obtained from the Japanese Study of Stratification, Health, Income, and Neighborhood (J-SHINE) conducted by University of Tokyo. J- SHINE is an ongoing longitudinal panel data originally intended for about 4000 adults, aged 20–55 years, who were selected randomly from urban and suburban municipalities in the greater Tokyo metropolitan area in Japan2. J-SHINE, which included various fields of questions such as income, employment status, living hours, and health conditions, was conducted to clarify complex associations between socioeconomic factors and health.
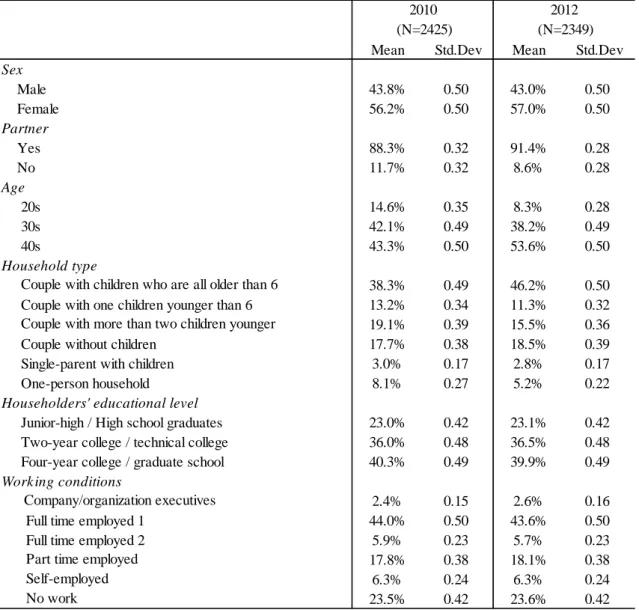
From the study, we excluded students and limited respondents to the samples who answered both questionnaires in 2010 and 2012. The final estimation samples comprised 2425 individuals in 2010 and 2349 individuals in 2012. We mainly addressed six household categories to assess circumstances of multidimensional poverty.
・ Couples with children who are all older than 6
・ Couples with one child younger than 6
・ Couples with two or more children younger than 6
・ Couples without children
・ Single parent with children
・ One-person household
Table 2-1 presents the demographic structures of samples in 2010 and 2012. The ratios of respective household types in the data were presented as follows: Couples with children who are all older than 6 [38.3% in 2010, 46.2% in 2012], Couples with one child younger than 6 [13.2% in 2010, 11.3% in 2012], Couples with two or more children younger than 6 [19.1% in 2010, 15.5% in 2012], Couples without children [17.7% in 2010, 18.5% in 2012], Single parent with children [3.0% in 2010, 2.8% in 2012], and One- person households [8.1% in 2010, 5.2% in 2012].
Regarding academic background, about 40% of the householders were respondents who had graduated from a four-year college or graduate school. Regarding employment status, about 50% were engaged in work as full-time employed, where Full time employed 1 means regular employees and Full time employed 2 means contract or dispatched full time but limited-term workers.
2 Regarding the detailed characteristics of J-SHINE data, refer to Takada et al. (2014).
26
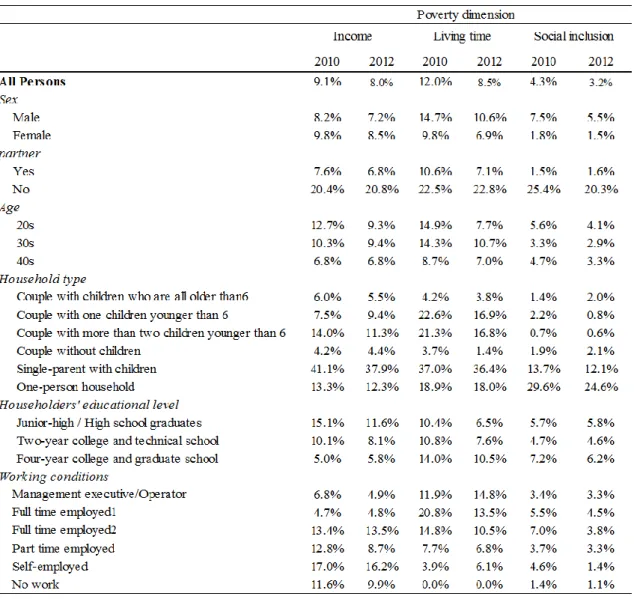
2.2.2 Poverty dimension
Our poverty measure in this paper followed the multidimensional methodology reported by Alkire and Foster (2011a). The AF methodology consists of an identification step and an aggregation step. At the identification step, we selected dimensions (indicators) and two cutoffs to identify who poor people using a ‘dual cutoff’ method. At the aggregation step, we mainly addressed the headcount ratio. For simplicity, all weights were assigned equally to each dimension.
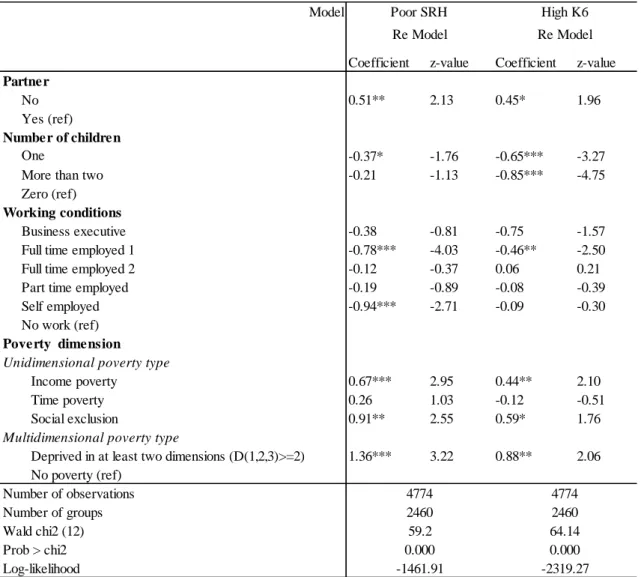
We specifically examined three dimensions of poverty: 1. income, 2. living time and 3. social inclusion. Then we investigated the effects on two indicators of health: self-rated health (SRH) and psychological distress (K6). By assessing poverty from three dimensions of income, living time, and social inclusion, we clarified the following: (1) What households are likely to fall into time and other dimensions of poverty? (2) Does multiple poverty that includes a time concept prevent people from achieving good health conditions? (3) Are there any gender differences in the effects of multidimensional poverty on health?
In applying a dual cutoff approach, let D(∙) denote the number of deprivations in poverty dimensions. The three union sets were defined as D(1)=1 indicating income poverty, D(2)=1 indicating time poverty, and D(3)=1 denoting social connection poverty.
The full intersection set, D(1,2,3)=3 includes individuals who were deprived in all three poverty dimensions. In addition, D(1,3)=2 denotes individuals who have both income poverty and social connections poverty. Therefore, multidimensional poverty was defined as D(1,2,3)≥k, where k=1, 2 or 3. Here, k represents the number of deprivations necessary to be judged multidimensionally poor. An individual was regarded as multidimensional poor if the person’s D(∙) was above a certain aggregated level of cutoff. For example, D(1,2,3)≥2 denotes individuals who were deprived in at least two of three poverty dimensions. The dual cutoff set also includes unidimensional poverty (if k=1) and full intersection set (if k=3). Indicators and the certain level of cutoff for three dimensions were defined as described below.
(i) Dimension 1: Household income
The poverty line of income can be chosen in two ways: an absolute level and a relative level. OECD defines relative income poverty by measuring the ratio of the number of people who fall below the poverty line. The poverty line was set as half of the median of equivalent household income of the total population. According to this definition of income poverty, the average poverty rate of Japan for entire population was