The development of English listening ability of Japanese high school students : A longitudinal study
117
0
0
全文
(2) ACKNOWLEDGEMENTS. This dissertation is the product of my three years of teaching in my ownclassrooms at Ariake National College of Technology and studying at the Graduate School of Education, Hiroshima University. I am deeply grateful to my supervisor Dr. Toshiaki Ozasa, who accepted me four years ago and guided me to the research field of Second Language Acquisition. I was particularly fortunate that I learned part of his profound knowledge of English education. I will bear in mind his advice to make this final destination of the doctoral course the commencementas an independent researcher. I am also grateful to Professor Shogo Miura, who gave me insightful and encouraging comments on my research. With great appreciation I wish to acknowledge Professor Yoshiyuki Nakao for his invaluable comments as a linguist. I also wish to express my gratitude to Professor Toshiaki Mori for his crucial advice on statistics. I offer an appreciative thank you to Professor Yoshinori Nuibe, who always read my writing very carefully and gave me practical suggestions, I would like to express my gratitude to Dr. Malcolm J Benson at Hiroshima Shudo University for reading and commenting on an earlier draft of this dissertation. As my tutor at MA Course at the University of Birmingham, and even after the course, he generously read every paper I wrote. Without his editor's eye and practical help, I couldn't have completed this dissertation. I wish to express my sincere gratitude to Dr. Seiji Fukazawa for giving us reading lessons on Saturday mornings for these two years. His attitude toward teaching and research impressed meas an ideal example. I would like to say my special thanks to Ms. Noriko Kotani, the department secretary, for her care and efforts to offer me a comfortable research environment. I am grateful to Dr. Tatsuo Ozaki, Principal of Ariake National College of Technology, and Dr. Kaoru Yamafuji, the former Principal, for having given me the opportunity to study at postgraduate school and accomplish my dissertation. I am also indebted to all my colleagues for their cooperation to my research. I wish in particular to thank Mr. Fumitoshi Sakanishi for his vital assistance from the very beginning of the current research. He made mea computer program, which enabled me to collect substantial data and analyze them efficiently throughout the three years. I thank all the seventy one students who participated in this longitudinal study. Interviewing them, I was impressed not only with their progress in language use but with their mental maturity during these three years. They taught me morethan I taught them..
(3) And thanks to my course mates, Koji Uenishi, Yoshio Hosaka and Hettiarachchige Ranjan Chandra Kumare, and my seniors of the course Kiyomi Watanabe and Mariko Sakamoto. Sharing knowledge and experiences with them on and off campus in Japan, Sri Lanka and China was a constant source of energy. Finally my biggest gratitude goes to my parents who willingly let me study in Hiroshima away from home. N.A.. January,. 2005. Hiroshima. ll.
(4) i. TABLE OF CONTENTS. TABLE OF CONTENTS. iii. LIST OF FIGURES AND TABLES. vi. CHAPTER 1 INTRODUCTION 1.1 Purpose of the Present Study. 1 1. 1.2 Background... 2. 1.2.1 English. listening. and its component variables. 2. 1.2.2 English 1.2.3 English. listening listening. and English proficiency and LI transfer. 3 4. 1.2.4 English. listening. and metacognitive. abilities. 6. OVERALL RESEARCH DESIGN. 8 8. CHAPTER 2 2.1 Objective 2.2 Method... 8. 2.2.1 Participants 2.2.2 Instruments 2.2.2.1 English 2.2.2.2 English 2.2.2.3. Japanese. 8 listening test tests excluding. English. listening. 9 9 10. test. tests.... 2.2.2A Questionnaire. 11. on metacognitive. abilities. in listening. 2.2.3 Procedure CHAPTER 3 PRELIMINARY 3.1 Test Results 3.2 Questionnaire Results 3.3. Factor Analysis Results. 11 12. STATISTICALANALYSIS. 3.3.1 English factors 3.3.2 Japanese factors.... OF THE RESULTS...15 15 17 20 20 24. Ill.
(5) CHAPTER4 STUDY 1 4.1 Research Questions 4.2 Method 4.3 Results 4.3.1 Multiple regression analysis 4.3.2 Path analysis results 4.4 Summary of Findings. 29 29 29 30 30 30 33. results. CHAPTERS STUDY2. 5.1 Research Questions 5.2 Method 5.3 Results 5.3.1 Multiple regression analysis results (English tests) 5.3.2 Path analysis results (English tests) 5.3.3 Multiple regression analysis results (Japanese tests) 5.3.4 Path analysis results (Japanese tests) 5.4 Summary of Findings. 34 34 34 34 34 35 38 38 41. CHAPTER6 STUDY3 6.1 Research Questions 6.2 Method 6.3 Results 6.3.1 Multiple regression. 42 42 43 43 43. analysis. results. (English. 6.3.2 Path analysis results (English factors) 6.3.3 Multiple regression analysis results (Japanese 6.3.4 Path analysis results (Japanese factors) 6.4SummaryofFindings.... CHAPTER? 7.1 Research. STUDY4. ,. factors). 44 46 47 47. ,. 49. Questions. 49. 7.2 Method 7.2.1. factors). ,. 49. Participants. 49. 7.2.2 Procedure. 49. 7.3 Results. 50. 7.4 Summary of Findings. 51. IV.
(6) CHAPTER S CONCLUSION 8.1 Overall Discussion 8.2 Major Findings 8.3 Pedagogical Implications 8.4 Limitations and Directions. for Future Research. REFERENCES APPENDIX APPENDIX APPENDIX APPENDIX. A Test Questions and Questionnaire Items B Two-year English Education for the Participants C A Replication Analysis D Follow-up Study. 53 53 56 57 58 59 ...64 86 94 96.
(7) page. FIGURES Figure Figure Figure Figure Figure Figure Figure Figure Figure Figure Figure Figure Figure. 4.1 4.2 4.3 5.1 5.2 5.3 5.4 5.5 5.6 6.1 6.2 6.3 6.4. 1st Year Path Model for English 2nd Year Path Model for English 3rd Year Path Model for English 1st Year Path Model for English 2nd Year Path Model for English 3rd Year Path Model for English 1st Year Path Model for English 2nd Year Path Model for English 3rd Year Path Model for English 1st Year Path Model for English 2nd Year Path Model for English 3rd Year Path Model for English 1st Year Path Model for English. Listening Listening Listening Listening Listening Listening Listening Listening Listening Listening Listening Listening Listening. and Four Categories of Abilities and Four Categories of Abilities and Four Categories of Abilities and English Sub-Skills and English Sub-Skills and English Sub-Skills and Japanese Abilities and Japanese Abilities and Japanese Abilities and English Factors and English Factors and English Factors and Japanese Factors. 32 32 32 36 36 36 40 40 40 44 45 45 47. TABLES Table Table Table Table Table Table Table Table. 2. 1 3. 1 3. 2 3. 3 3. 4 3. 5 3. 6 3. 7. Overall Experimental Design Descriptive Statistics for English and Japanese Tests Repeated Measures ofANOVAand Tukey's Test Results Test Score Gain Between Years English Listening Questionnaire Results Japanese Listening Questionnaire Results English Metacognitive Factors in the First Year English Metacognitive Factors in the Second Year... Table Table Table Table Table Table Table. 3. 8 English Metacognitive Factors in the Third Year 3. 9 Japanese Metacognitive Factors in the First Year 3.10 Japanese Metacognitive Factors in the Second Year 3.ll Japanese Metacognitive Factors in the Third Year 3.12 Descriptive Statistics for English and Japanese Factors 3.13 Descriptive Statistics for Four Categories of Abilities 4. 1 Multiple Regression Analysis Results (Four Categories of Abilities). Table 5. 1 Multiple Table 5. 2 Multiple. Regression Analysis Results (English Tests) Regression Analysis Results (Japanese Tests). VI. 13 15 16 16 18 19 21 22 23 25 26 27 28 28 30 35 38.
(8) Table 6. 1 Multiple Table 6. 2 Multiple. Regression Analysis Regression Analysis. Results (English Factors) Results (Japanese Factors). 43 46. Table 7. 1 Test Score Gain in the Upper and Lower Groups. 50. Table 7. 2. Multiple. Regression Analysis. Results (English. 50. Table 7. 3. Multiple. Regression Analysis. Results (Japanese. Table 8. 1 Explanatory Table 8. 2 Table 8. 3. Variables. of English. Listening. Test Score Gain) Test Score Gain). (Study. 1). Significant Explanatory Variables of English Listening (Studies Causal Variables of English Listening Test Score Gain. Vll. 51 53 2 & 3). 54 56.
(9) CHAPTER 1. 1.1 Purpose of the Present Study In English language education in Japan, the development of communicative abilities has been more and more stressed on. In response to the present situation in which insufficient communicative abilities in English give Japanese people disadvantages in the global society, the Ministry of Education, Culture, Sports, Science and Technology (MEXT) formulated an action plan in 2003 to cultivate "Japanese with English Abilities." To this aim, the plan proposes the following seven specific actions: 1. improvement of English classes; 2. improving the teaching ability of English teachers and upgrading the teaching system; 3. improving motivation for learning English; 4. improvement in the evaluation system for selecting school and university applicants; 5. support for English conversation activities in elementary schools; 6. improvement of Japanese language abilities; and 7. promotion of practical research. To promote these seven actions, various measures were proposed. The cultivation of Japanese people with a good commandof English has nowbecomean urgent project at a national level. Listening comprehension is an essential ability for communication in English, and in the new Course of Study implemented since 2002, the cultivation of listening ability, as well as speaking ability, is focused on as the goal at the junior high school level, and both are expected to be integrated with reading and writing at the high school level. English listening ability is regarded as partially independent and partially made up of other skills, rather than one unitary ability. In order to create an effective training method to improve Japanese learners' English listening ability, it is essential to know what linguistic and nonlinguistic constituents make up their English listening ability. Therefore, the main purpose of this dissertation is the analysis of the explanatory variables of Japanese high school students' English listening ability. The results will provide basic data on how Japanese high school students develop their English listening ability, and the better understanding of the process will contribute to the improvement of English education in Japan. At the same time the result is expected to add some new insight to the studies of.
(10) Second Language Acquisition (SLA). The relationship between English listening ability and its explanatory variables vary according to their developmental stages, from novice to advanced levels. This process may have some similarity to the concept of interlanguage. Interlanguage is a systematic knowledge of a second language (L2), independent of both the first language (LI) and the target language, that learners are considered to have. It is restructured at various stages of development, by replacing LI features with L2 features in grammar,phonology and strategies, and a series of these changes from LI towards a complete system of L2 proficiency over time is called a restructuring continuum (Ellis, 1994). The analysis of explanatory variables of Japanese learners' English listening performance and their diachronic changes will illustrate part of their restructuring continuum. The full path of their development over time will be made possible only by a longitudinal study, in which the same participants are observed over a period of time. Unfortunately, there are very few longitudinal studies focusing on the development of junior or high school students studying L2 in the classrooms, probably because of the time and institutional constraints. The scrutiny of the past ten years' issues of the leading SLA journals, Language Learning, Studies of Second Language Acquisition and Modern Language Journal, showed that their longitudinal studies collected data from a limited number of young children or adult learners in ESL settings. Therefore, a longitudinal data from adolescent learners in EFL settings will provide informative study results for SLA.. In order to find possible component variables of English listening studies are overviewed in the following section.. ability,. previous. 1.2 Background 1.2.1 English listening and its component variables The process of listening comprehension is comprised of plural stages. It is regarded as two-phase (perception and comprehension) or three-phase (perception, parsing and utilization) processing. In the two-phase processing, in the perception stage sounds are input into the mental processing system, and in the comprehension stage, phonological representation is processed simultaneously in terms of vocabulary, grammar, semantics, context, and schema. By doing so, the incomplete phonological representation is compensated for by some other elements and will lead to appropriate semantic representation (Kadota & Tamai, 2004). On the other hand, in the three-phase processing following the first stage in which English sounds are perceived, in the parsing stage the sounds are analyzed making use of listeners' lexical and grammatical knowledge, and finally in the utilization stage the message is interpreted (O'Malley et al.,1989; Anderson,.
(11) 1995). In either of the two models, the aural recognition of spoken language is expected to play a crucially important role in the first stage. What comes in the following stage(s) is the component skills in English, including lexical and grammatical knowledge, and reading ability. It is possible that in addition to English proficiency, Japanese proficiency and metacognitive abilities have direct or indirect influences on listening performance. In the subsequent sections, previous studies on each of the three component variables will be reviewed.. 1.2.2 English listening and English proficiency Several studies on the relationship between listening ability and component skills of Japanese learners emphasize the importance of word recognition. Nishino (1992) examined 84 university students' English listening performance and its relevance with six component skills including speech perception, vocabulary recognition and grammatical knowledge. The result of multiple regression analysis suggests that, among the six component variables, listeners' success depends largely upon their lexical knowledge relevant to the message. His listening comprehension test consisted of three short stories on social problems such as the current energy problems, and the vocabulary test questions were picked out from the listening test passages. Using the words irrelevant of listening test passage as one of the independent variables, Takashima (1998) also found by regression analysis that the accuracy of word recognition was the only predictor of English listening performance of Japanese university students. Ellis et al. (1994) showed how interactionally modified input is useful to listeners by comparing the English listening test scores of two different groups of Japanese high school learners. One group was allowed to solve the lexical problems by the interaction with the speaker (interactionally modified input) and the other group was not allowed to do so (premodified input). The first group outscored the latter group, which suggests that lexical knowledge can facilitate listening comprehension. This crucial importance of word recognition may derive from the difficulty of word recognition for Japanese learners whose LI is quite different from English language in phonological representation. Kadota & Noro (2001) attribute Japanese learners' deficiencies in listening performance to the gap between the sound that listeners expect to hear and the one they do hear. This may prevent them from comprehending English. For example, even a most basic word like "apple" may sound like an unfamiliar word to listeners who expect to hear "appuru" as the Japanese often pronounce it. This kind of failure often happens in Japanese classrooms where learners do not study spoken language first as native speakers of English do, and have few chances of communicating in English..
(12) Besides the importance of word recognition, the effect of the reaction time of lexical retrieval on listening comprehension has been focused on recently. Yamaguchi (2001) reports the positive effect of quick lexical retrieval in listening comprehension. She gave speed-up training in lexical retrieval for her less skilled listeners. She contrasts the success with the ineffective result of the rapid decoding training in reading by Fleisher et al. (1979), and suggests the uniqueness of listening activities as its cause. In listening activities sounds disappear the instant they are uttered, while printed letters can be read over and over. Another study focusing on listening speed is Hirai (1999). This study, based on the finding by Carver (1982) that learners' optimal reading rate and listening rate are almost the same, investigated Japanese university learners' listening and reading rates. The results show that Carver's ideas apply only to more skilled Japanese learners, and less skilled learners' listening rates were too slow to measure. She insists that slow listening rate, caused by mainly slow phonological processing as well as insufficient lexical and grammatical knowledge, may prevent progress of reading performance, because of the transfer of listening performance to reading performance. She suggests that less skilled learners be exposed to listening comprehension training at the early stage of their English learning.. In spite of the use of different sensory organs, spoken English and written English share commonvocabulary and grammar. In listening comprehension, the sound directly associates with meaning, and in reading, visual information is interpreted by way of phonological processing, rather than immediately connecting with meaning (Kadota & Noro, 2001).. To sumup, the ability of word recognition with quick information processing and reading ability are considered to be two key factors in the successful listening performance of Japanese learners. 1.2.3 English listening and LI transfer As another major component variable of English listening ability, learners' ability in their native languages cannot be overlooked. Among the measures in the action plan for "Japanese with English Abilities" by MEXT cited earlier is the improvement of Japanese language abilities, which is regarded as "the basis of all intellectual activities." They add that, "The acquisition of English is greatly related to the students' abilities in their mother tongue, Japanese" (p. 1 8). LI transfer to L2 writing and reading abilities have been studied by several researchers and a positive transfer of LI writing performance to corresponding L2 ability has been revealed..
(13) Raimes (1 985), comparing the characteristics of written work by the unskilled LI writers, found that both parties have a lot in common. They spent less time in planning or revising, and paid more attention to linguistic features such as grammatical and lexical correctness than to the content of their composition. One example from the studies on Japanese EFL learners is Sasaki & Hirose (1996), in which good writers of English have higher English proficiency and also in Japanese writing ability, paying more attention to the overall organization of the text. Concerning LI reading proficiency's links to the corresponding L2 ability, Motooka (2001) studied Japanese EFL learners at university andjunior college level. She insists that, although English proficiency, especially vocabulary, is the most important to less skilled readers, in the case of good readers, Japanese proficiency and metacognitive abilities are of more importance. It is only after the English abilities go beyond the threshold level that L I proficiency plays a significant role to English reading performance. Yamashita (2002) compared strategies in LI (Japanese) and L2 (English) reading reported by four groups of different combination of reading abilities in LI and L2. She concludes that metacognitive strategies were not affected by differences in languages (Japanese or English) or readers' abilitites in the two languages, whereas other kinds of strategies were subject to these factors. Based on these previous studies are Snelling et al. (2002), Shoonen et al. (2003) and Stevenson et al. (2003), which are part of a longitudinal study in the Netherlands called NELSON, with an official title "Transfer of higher-order skills and processes in reading and writing in Dutch and English." They provide informative analysis results on the relationship between L1/L2 and FL (foreign language) of approximately 300 participants' reading and writing proficiency from grade 8 (ages 13-14) to grade 10 (15-16), shifting their research focus from language skills to process, and to strategies. They regard the speed of low order processing, such as lexical retrieval in writing and word recognition in reading, as a key to successful transfer of LI to L2. As far as writing proficiency's transfer from LI to L2 is concerned, they found that L2 writing proficiency turned out to be highly correlated with LI writing proficiency, more than with either L2 linguistic knowledge or the accessibility of this knowledge. Do these findings of preceding studies on LI and L2 interplay apply to listening comprehension? Listening comprehension in LI is different from writing and reading in LI, in that even if it is in LI, writing and reading is demanding and students learn how to write better or read better at school. However, how to listen better in LI is rarely taught at school, because almost anyone naturally develops high listening comprehension without any formal instruction as they grow up in the miliue of their native language spoken by the people around them..
(14) Feyten (1991) emphasizes the latent power that listening ability has on other language skills. She studied the relationship between LI listening ability and FL language proficiency. By analyzing data from students learning Spanish and French as a foreign language in a university program, she discovered that statistically significant relationships exist between listening ability and overall FL proficiency, between listening ability and FL listening comprehension skills, and also between listening ability and FL oral proficiency skills. Her findings suggest a close relationship between listening ability and foreign language acquisition. The positive transfer oflearners' LI ability to English proficiency is also regarded as a language factor that contributes to English listening. The effect is naturally expected, especially when the native tongue has a considerable linguistic similarity to English. Nation (2001) regards the similarity of LI and L2 as an important facilitating factor to foreign language listening. He discusses that "Learners' ability to chunk the spoken form of a word into meaningful segments which in turn depends on LI and L2 similarity and the learners' level of proficiency in L2" (p.41). English is regarded as a syllable-timed language with stressed rhythm, while Japanese is a mora-timed language in which the same stress and the same length are given to one mora. In the two studies cited above, the participants' LI (Finish and English) had a close similarity with their target languages (English and Spanish or French, respectively). In spite of the big typological difference between the English and Japanese languages, there are several studies supportive of a positive transfer of the Japanese language ability to English proficiency. Although not sufficient research has been done concerning the relationship between Japanese listening ability and its English counterpart, Yoshida et al. (1990) discovered a certain degree of interrelation between Japanese junior high school students' English listening ability and their Japanese proficiency. They insist that this interrelation is due to the comprehension ability that both English and Japanese proficiency require in common. Takefuta (1984) also regards LI and L2 listening as the same process, which basically needs concentration and good memoryin addition to language proficiency. Their ideas are supportive of the action plan by MEXT which aims to promote Japanese language abilities, regarding them as "the basis of all intellectual activities." 1.2.4 English listening and metacognitive abilities Oxford (1990) defines "metacognitive" as beyond, beside, or with the cognitive, and "metacognitive strategies" as actions which go beyond purely cognitive devices, and which provide a way for learners to coordinate their own learning process. One of the metacognitive strategies is self-monitoring. It allows listeners to monitor their own language performance, to check whether they correctly understand the meaning of the.
(15) message or whether they are concentrated or not, to guess unfamiliar words they encounter, and to correct any misinterpretations as they move ahead. A similar process occurs in reading as well. Readers also often skim or scan, making guesses about what will come next, and modifying their guessing if necessary. Several studies reported that self-monitoring is more frequently used by effective listeners. O'Malley et al. (1989) compared the strategies used by listeners of different levels in the three stages of listening processing, perceptional processing, parsing and utilization. Their main finding was that more skilled listeners used metacognitive strategies including self-monitoring and top-down approach more frequently than less skilled listeners. The same type of difference amonglisteners in different developmental stages was also studied by Goh (2000), which investigated learners' awareness of problems in English listening. Based on Anderson's (1995) three-phase listening model, she categorized the problems reported by her Chinese EFL learners. She concluded that the problems reported by advanced listeners belonged to the utilizing stage, while low-level listeners often had problems perceiving English. Vandergrift (2003) studied learners of French and the different strategies used by more skilled and less skilled listeners, and found that skilled listeners used more metacognitive strategies than less skilled listeners. Less skilled listeners depended more on translation, which led to bottom-up processing, a passive approach. On the other hand, more skilled listeners employed a more dynamic interactive approach of top-down and bottom-up processing. With this background in view, the present study attempts to reveal the explanatory variables of English listening performance based on longitudinal data from the viewpoints of English proficiency, Japanese proficiency and metacognitive abilities..
(16) CHAPTER 2. OVERALL RESEARCH DESIGN. In this chapter, overall research design of the present study is presented. 2.1 Objective. From the findings and insight offered by the preceding studies reviewed in the previous chapter, it may be possible to think that a holistic picture of Japanese learners' listening abilities is drawn from the perspective of the relationship with the following aspects: L2 (English) ability, LI (Japanese) ability, metacognitive abilities in LI and L2. The objective of the present study is to clarify the explanatory variables of English performance, and the diachronic change of the relationship between English listening performance and the component variables, and amongthe component themselves, (1) focusing on the language proficiency and metacognitive abilities in LI and L2; (2) focusing on the individual language skills ofLI and L2; (3) focusing on the metacognitive factors of LI and L2; (4) focusing on the improvement of test scores in LI and L2. 2.2 Method 2.2.1 Participants. The participants were 71 students at a Japanese technical high school, with 39 boys and 32 girls. They were 15-16 years old at the onset of this longitudinal study. After a five-year education at this school, they are expected to work as practical engineers without going on to university. Therefore, they are not taught exam-oriented English as manyJapanese high school students are, nor do most of them study English independently outside the classroom. Their main academic interest is in science and technology, and their motivation in learning English is generally low. They study English as one of the compulsory subjects at school. Their English proficiency level was low in the first year, and according to the gradations of the STEP (The Society for Testing English Proficiency) Test, they were between the fourth and the third grades, and in the third year their level was.
(17) low-intermediate and somewherebetween the pre-second and the second grades. They had studied English as a foreign language for three years before they entered this school. In the first year of this school they had five 50-minute English classes a week, with one class for a listening lesson and four for reading. In the listening lessons, they had listening comprehension training using materials concerning young people's life in the United States, by questions and answer activities, dictations and pair activities. In the lessons for reading, they studied using high school English textbooks, reading the texts and learning vocabulary and target grammatical structures. In the second year they had six 50-minute English classes a week, with one class for listening and five for reading. In the listening lesson, they used a listening training material for TOEIC (Test of English for International Communication), in which they listened to the same types of test questions as TOEIC, including the descriptions of photos of various scenes of people's life and short dialogues. In the lessons for reading, they studied a high school English textbook, read English stories, studied grammar and vocabulary. For further information on the participants' educational backgrounds for English including curriculum and textbooks, see Appendix B. 2.2.2 Instruments The following tests and questionnaires Aprovides full test questions and questionnaire. were administered items.. in the study.. Appendix. 2.2.2.1 English listening test As the material for this test, the Benesse English Communication Test was used. The participants listened to the tape and answered 40 questions in 20 minutes. The test consists of four parts, Parts A to D, and the participants, listening to the tape, chose the appropriate answers from amongthe multiple choices. In Part A, the participants were requested to listen to one or two English sentences to describe pictures and to choose the appropriate pictures. In Part B, the participants listened to the one-sentence questions such as "Who did you meet?" and chose the appropriate answers from multiple choices. In this part, to be successful, it was essential to catch the very first few words including interrogatives. In Part C, the participants listened to short dialogues between a Japanese student staying with an American family and his or her family members or school teachers there. Following the dialogues, a question was asked, and the participants chose the appropriate picture as an answer. Part D also offered dialogues, but they were a little longer than in Part C. This listening test checks the listeners' basic communication abilities in English and is appropriate for the participants of the present study as the beginners. of English..
(18) 2.2.2.2 English tests excluding English listening test (a) Aural word recognition test (50 questions in 1 5 minutes) In this test, the participants' accurate aural processing of word recognition was tested. The participants wrote Japanese equivalents on the answer sheet as soon as they heard English words. For example, whenthey heard "stone," they had to write "W/H"in Japanese. The word selection was based on Negishi (1999), and these junior high school level words were expected to be visually familiar to the participants, even though they failed to recognize them aurally. (b) English reading test (16 questions in 30 minutes) The reading test of the Benesse English Communication Test was used. The participants read two English passages and were requested to answer comprehension questions and choose correct statements about the story. One of the passages had 219 words on the topic of snowboarding, and the other story about the deserts had 232 English words. In order to activate the readers' background knowledge, illustrations were given to each of the passages. For the first passage, a snowboarder was illustrated, for the second story a camel in the desert was illustrated, which facilitated the readers' understanding even if some of them had lexical problems about "snowboarding" or "desert.". (c) English. cloze test (20 questions in 20 minutes) A cloze test is considered to measure the participants' overall ability. The test questions are made by deleting every nth word in a passage, leaving blanks, requiring the test participants to replace the original words. In predicting the missing words, the participants make use of the abilities that underlie all their language performance, including lexis, grammatical and idiomatic knowledge, and background knowledge. The test passage of the present study was taken from "Hello Kitty" in Taniguchi (1998), whose topic was familiar to the participants. With first two sentences unmodified, every seventh word of the passage was deleted from the passage. After a trial test the participants filled the blanks, making use of their language ability. (d) English vocabulary test (25 questions in 1 5 minutes) In this test the questions at junior high school level were chosen from Hill (1982). The participants chose one out offour words to make a plausible sentence. In order to get good marks on this test, not only lexical knowledge but appropriate interpretation of the sentence wasrequired. (e) English grammartest (25 questions in 1 5 minutes) The multiple choice questions of this test were chosen from Hill (1982). The participants were requested to choose correct forms of verbs, pronouns, comparatives, and so forth. The author very carefully chose basic questions to check the participants' 10.
(19) grammatical. knowledge mainly at the junior. 2.2.2.3 Japanese. high school level.. tests. (a) Japanese listening test (1 6 questions in 1 5 minutes) For the measurement of Japanese listening ability, the test questions were picked out from Matsumoto & Hoshino (1996), training material for the Japanese Language Proficiency Test for Foreigners. The participants listened to dialogues or short speeches in Japanese, and chose correct answers or statements from three or four multiple choices. (b) Japanese reading test (1 6 questions in 1 5 minutes) The questions for this test were picked out from Oniki & Saiyama (1 994), training material for Japanese Language Proficiency Test for Foreigners. The test passages comprised articles and conversations in Japanese. The participants chose the correct statements or plausible conclusion of the passage or guessed the social relationship between the interlocutors. The questions mainly checked the participants' understanding of information written in the passages. (c) Japanese cloze test (20 questions in 1 0 minutes) The test passage was taken from Kurihara (1997), a Japanese textbook of junior high school. The questions were made in the same way as an English cloze test. With the first two sentences unmodified, every seventh smallest unit of the Japanese was deleted from the passage. After a trial test, the participants filled in the gaps in the passage. 2.2.2.4 Questionnaire on metacognitive abilities in listening (a) Questionnaire on English metacognitive abilities (22 questions in 10 minutes) The questionnaire was administered immediately after the English listening test in order to find out to what extent the listeners were awareof their listening performance. The questionnaire items were picked out from Motooka (2001), originally designed for reading, and modified for the present study. The questions asked how the listeners generally evaluated their listening performance, what strategies they used to facilitate their listening, or their awareness of what washindering their listening, and the participants answered with a 5-point Likert scale in which a strong agreement 5 and strong disagreement was 1. (b) Questionnaire on Japanese metacognitive abilities (22 questions in 1 0 minutes) The questionnaire was again administered immediately after the Japanese listening test. The question items were almost the same as the one for English listening, except "English" was replaced by "Japanese." For example, a question item, "I couldn't keep up with the speed of English," was transformed into "I couldn't keep up with the speed of Japanese," in the Japanese version.. ll.
(20) 2.2.3. Procedure. The tests and questionnaires were administered in a classroom or multi-media roomby the author during class hours within two weeks in June 2001, 2002 and 2003. The data of the students who participated in all the tests and questionnaires in all the three times werecomputed. As for the questionnaire results, exploratory factor analyses were performed, and metacognitive factors of LI and L2 listening were extracted, and the scores of each factor were computed. After that, as the basic data analysis, the scores, means and standard deviations of all the tests and factors extracted were computed. The results of these analyses will be listed in the next chapter as Preliminary Statistical Analysis of the Results. The answers to the objective of the present study are offered from the products of multiple regression analyses and path models. Path models in which all component variables were simultaneously related to English listening performance were presented on the basis of the results of a series of multiple regression analyses with different component variables as the dependent variable. By comparing the models for the first to the third years, the diachronic change of relationship among component variables is clarified, and will be presented in Chapters 4 to 7. There are four separate data analysis phases. Wefirst need to know the general relationship between English listening performance and other language and metacognitive abilities. Therefore, the first procedure of multiple regression analyses were given with the English listening test scores as the dependent variable and the following four scores as independent variables: the total scores of English tests, Japanese tests, English factors, and Japanese factors. The relationship between the dependent variable and independent variables and also the reciprocal relationship within component variables and their change over time will be illustrated by path models. The products of these analyses will be presented in Chapter 4 as Study 1. Once the general idea of the relationship between English listening performance and other abilities is clarified, as the second step, exploration will go into different specific areas. For the exploration of the relationship between English listening performance and language abilities in LI and L2, multiple regression analyses were repeated two times. In the first procedure, the English test scores excluding English listening test were independent variables, and in the second procedure, Japanese test scores. The diachronic change of path models will strengthen the understanding of the relevance of English listening performance and particular skills in LI and L2. The products of these analyses will be presented in Chapter 5 as Study 2. The third step goes onto the contribution to English listening performance that metacognitive abilities in LI and L2 make. Along with the multiple regression analysis 12.
(21) results, path models will show the relevance of English listening performance and its component variables in a diachronic perspective. The analysis results will be reported in Chapter 6 as Study 3. In Studies 1 to 3, the major explanatory variables of English listening performance in each year, along with the reciprocal relationship among the component variables will be clarified. However, it is not yet known what language skills or factors in LI and L2 caused the development of English listening performance. Therefore, the causal variables of the diachronic improvement of English listening test scores are finally focused on. This is in order to investigate which test score excluding English listening contributed to the gain of the test scores in English listening test. The analysis results will be presented in Chapter 7 as Study 4. The overall experimental design is summarized below in Table 2.1. All the analyses were performed with a statistical package SPSS 12.0 and Amos4.0. Table 2.1 Overall Analyzed Items CHAPTER 4 STUDY 1. English. Design. Statistical Multiple. listening. Methods. regression. analysis. Dependent variable =English listening test scores. vs.. Four categories. CHAPTER 5 STUDY 2. Experimental. of abilities:. L2 proficiency,. Independent variables. LI proficiency,. =Total scores ofLI and L2 language. L2 metacognitive. ability,. LI metacognitive. ability. English. tests and factors. Path analysis. listening. Multiple. regression. analysis. Dependent variable. vs.. Language skills. in LIand. L2. ^English listening Independent. test scores. Variables. =Languagetest scores in LI and L2. CHAPTER 6 STUDY 3. English. Path analysis Multiple regression. listening. analysis. Dependent variable. vs.. ^English listening. Metacognitive factors inLI andL2. Independent. test scores. variables. =Factor scores in LI and L2. Path analysis. (table continues). 13.
(22) Table 2.1 (continued). Statistical. Analyzed Items CHAPTER 7 STUDY 4. The improvement of English listening vs.. The improvement of language skills in LI and L2. 14. Multiple. regression. Methods analysis. Dependent variable =Thegain of English listening Independent. test scores. variables. = Thegain of other test scores in LI and L2.
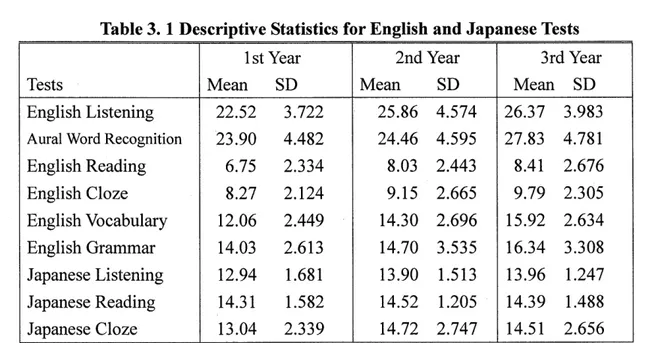
(23) CHAPTER 3. PRELIMINARY STATISTICAL ANALYSIS OF THE RESULTS. In this chapter, a preliminary statistical analysis of the results Further analyses will be presented in Studies 1 to 4 in Chapters 4 to 7.. is presented.. 3.1 Test Results Table 3. 1 Descriptive. Statistics. for English. 1 st Y e ar T ests. M ea n. and Japanese Tests. 2 n d Y e ar. SD. M ean. SD. 3 rd Y ear M ean. SD. E n g lish L iste n in g. 22 .52. 3 .72 2. 2 5 .86. 4 .5 74. 2 6 .3 7. 3 .9 83. A ural W ord R ecogn ition. 2 3 .9 0. 4 .4 8 2. 2 4 .4 6. 4 .5 9 5. 2 7 .8 3. 4 .7 8 1. E n g lish R ead in g. 6 .7 5. 2 .3 34. 8 .0 3. 2 .4 4 3. 8 .4 1. 2 .6 7 6. E ng lish C lo z e. 8 .2 7. 2 .124. 9 .15. 2 .6 6 5. 9 .7 9. 2 .3 0 5. E n glish V o cab u lary. 12 .0 6. 2 .4 4 9. 14 .3 0. 2 .6 9 6. 15 .9 2. 2 .6 34. E n glish G ram m ar. 14 .0 3. 2 .6 13. 14 .7 0. 3 .5 3 5. 16 .3 4. 3 .3 0 8. Jap a n ese L isten in g. 12 .9 4. 1.6 8 1. 13 .9 0. 1.5 13. 13 .9 6. 1.2 4 7. Jap an ese R ea d in g. 14 .3 1. 1.5 8 2. 14 .5 2. 1.2 0 5. 14 .3 9. 1.4 8 8. Jap an ese C lo z e. 13 .0 4. 2 .3 3 9. 14 .7 2. 2 .7 4 7. 14 .5 1. 2 .6 5 6. Table 3.1 lists the test score averages and the standard deviations for each year. Excluding Japanese reading and cloze tests, the test scores increased every year. In order to examine whether or not the score difference over time in each of the nine tests was statistically significant, repeated measuresof one-wayA NOVA wereperformed,and when appropriate post hoc tests were conducted using Tukey's multiple comparison test. The results are shownin Table 3.2. As indicated in Table 3.2, the scores of all the tests, except those of Japanese reading test, show statistically significant increases. In the right column of the table, the years whenthe statistically significant changes occurred were specified by Tukey's tests. 15.
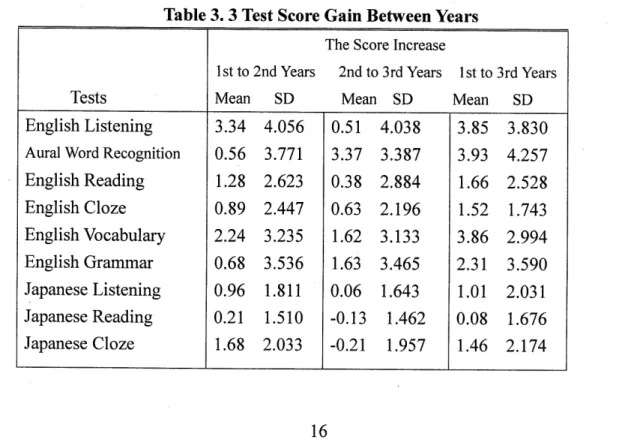
(24) AmongEnglish skills, listening and reading performance first developed, followed by the linguistic features such as aural word recognition and grammar. The scores of the English cloze test, regarded as the comprehensive ability of English, showed no remarkable change between any two years. Table 3.2. Repeated. T e sts. Measures ofANOVA and Tukey's Test Results. 0. F. p. T h e Y ea rs w ith S ig n ifica n t D iffe re n c e. E n g lish L is te n in g. 2. 1 8 .3 5 6. .0 0 0 * * *. 1 st Y e a r < 2 n d - 3 rd Y e a r s. A u ral W o rd R e c o g n itio n. 2. 1 5 .0 1 3. .0 0 0 * * *. 1 st - 2 n d Y e a r s < 3 rd Y e a r. E n g lish R e a d in g. 2. 8 .6 9 3. .0 0 0 * * *. 1 s t Y e a r < 2 n d - 3 rd Y e a rs. E n g lish C lo z e. 2. 7 .3 4 5. .0 0 1 * * *. 1 s t Y e a r - 2 n d - 3 rd Y e a r s, 1 s t Y e a r < 3 rd Y e a r. E n g lish V o c a b u lar y. 2. 3 9 .5 9 6. E n g lish G ra m m a r. 2. 9 .9 2 5. .0 0 0 * * * .0 0 0 * * *. J a p a n e se L iste n in g. 2. 1 0 .3 7 1. 000 ***. 1 s t Y e a r < 2 n d - 3 rd Y e a rs. J a p a n e se R e a d in g. 2. .3 9 0. .6 7 7. 1 st Y e a r - 2 n d Y e a r - 3 rd Y e a r. J a p a n e s e C lo z e. 2. 8 .8 4 2. .0 0 0 * * *. 1 st Y e a r < 2 n d - 3 rd Y e a r. ***. 1 s t Y e a r < 2 n d Y e a r < 3 rd Y e a r 1 s t - 2 n d Y e a rs < 3 r d Y e a r. '/K0.005. The test score gain from the first to the second years, fromthe second to the third years, and also from the first to the third years was computed,and the average scores of gain and their standard deviations are presented in Table 3.3. Table 3. 3 Test Score Gain BetweenYears T h e S core Increase 1stto 2n d Y ears. 2n d to 3rd Y ears. T e sts. M ean. SD. M ean. E n g lish L isten in g. 3 .3 4. 4 .0 56. A u ral W ord R ecog nition. 0 .5 6. E n g lish R e ad in g. lst to 3rd Y ears. SD. M ean. SD. 0 .5 1. 4 .0 3 8. 3 .8 5. 3 .8 3 0. 3 .7 7 1. 3 .3 7. 3 .3 8 7. 3 .9 3. 4 .2 5 7. 1 .2 8. 2 .6 2 3. 0 .3 8. 2 .8 8 4. 1 .6 6. 2 .52 8. E n g lish C lo ze. 0 .8 9. 2 .4 4 7. 0 .6 3. 2 .19 6. 1 .5 2. 1 .74 3. E n g lish V o ca b u lary. 2 .2 4. 3 .2 3 5. 1.6 2. 3 .13 3. 3 .8 6. 2 .9 94. E n g lish G ram m ar. 0 .6 8. 3 .5 3 6. 1.6 3. 3 .4 6 5. 2 .3 1. 3 .59 0. Jap an ese L isten in g. 0 .9 6. 1.8 11. 0 .0 6. 1 .64 3. 1.0 1. 2 .0 3 1. Jap an ese R ead in g. 0 .2 1. 1.5 10. -0 .13. 1 .4 6 2. 0 .0 8. 1.6 7 6. Jap an e se C lo z e. 1.6 8. 2 .0 3 3. -0 .2 1. 1 .9 5 7. 1.4 6. 2 .17 4. 16.
(25) As for Japanese abilities, the decrease of the raw scores in the third year, although not statistically significant, shows that the Japanese language ability remained static. 3.2 Questionnaire Results The questionnaire results are shown in Tables 3.4 and 3.5. When the participants strongly agreed with the item, they chose 5, and for strong disagreement they chose 1. The comparison of average scores in the LI and L2 listening questionnaires offers some informative differences. The participants' general evaluation of their successful listening performance in LI and unsatisfactory performance in English are shown in the average scores of the first question in Tables 3.4 and 3.5. The average scores of the second question in English and Japanese listening may indicate that they tried to continue to listen to both English and Japanese even when they failed to comprehend several parts, but in listening toEnglish, more participants were occupied with the parts they missed. An interesting finding in the third and fourth questions is that whereas the participants' English listening comprehension can be characterized by "speed" and "lexical knowledge," their LI listening comprehension depended on "message of the whole passage." The third question was what strategies the participants used for effective listening comprehension. In the first year English listening, the most frequent use was "14. I tried to concentrate myself in order to keep up with the speed of English," and the second choice was "10. I tried to understand the meaning of each word." These choices may indicate that the first year students tried very hard to recognize words, following the rapid stream of spoken English. In the second year, their first choice was again "concentration", but the second was "ll. I tried to understand the message of the whole passage." Instead of the sound of each word, they may have begun to pay more attention to the content of the passage. Finally, in the third year, the order was reversed and "message" came first, followed by "concentration." This combination of "message and concentration" exactly matches the choices made in Japanese listening in Table 3.4. This diachronic change may suggest that the participants' L2 listening strategies came to be closer to those of LI listening after two years of English study. However, as seen in the frequent choices of "19. I cannot keep up with the speed of English," and "17. I don't know the meanings of words," their inability to follow the speed of spoken English and the lexical knowledge remained the biggest problems. In contrast, in listening to LI , they regarded as their biggest problem "21. 1 cannot understand the message of the whole passage." Therefore, by following English with quick information processing and also by overcoming lexical problems, the participants may then be able to focus on the message of the whole passage, as they do in listening to Japanese. 17.
(26) Table 3.4 English. Listening. Questionnaire. Results A v e rag e. Q u estio n Ite m s. 1st Y e ar. S c o re s. 2 n d Y e ar. 3 rd Y e a r. W h at d o y o u th in k a b o u t y o u r liste n in g c o m p reh en sio n d u rin g th e te st? 1. W h ile listen in g , I u n d e rsto o d th e d ev e lo p m e n t o f th e sto ry .. 2 .5 9. 2 .8 3. 3 .18. 2 . 1 k e p t u p w ith th e sp e e d o f E n g lish .. 2 .0 8. 2 .4 4. 2 .0. 3 . 1 u n d ersto o d w h a t p ro n o u n s w ere re fe rrin g to .. 2 .6 5. 2 .4 9. 2 .8 0. 4 . M y k n o w le d g e a b o u t th e to p ic h elp ed m e u n d e rsta n d. 2 .8 9. 3 .3 7. 3 .6 2. 2 .5 4. 3 .2 3. 3 .3 7. 6 . 1 k ep t o n listen in g , p ay in g n o a tten tio n to th e p a rt I m issed .. 3 .7 9. 3 .5 4. 3 .7 6. 7 . 1 c o u ld n 't liste n to th e n ex t p art, th in k in g o f th e p art I. 3 .4 1. 3 .0 6. 3 .3 4. 2 .1 5. 1 .89. 2 .3 1. 2 .7 6. 2 .3 5. 2 .8 2. 10 . 1 trie d to u n d e rsta n d th e m e an in g o f e ac h w o rd .. 3 .5 5. 3 .4 1. 3 .4 8. 1 1 . I tried to u n d e rsta n d th e m e ssag e o f th e w h o le p a ssa g e .. 3 .5 2. 3 .7 2. 3 .7 7. 1 2 . 1 p a id a tten tio n to g ra m m atic a l stru ctu re s.. 2 .7 2. 2 .6 2. 2 .7 0. 13 . 1 trie d to rem e m b er w h a t I k n e w a b o u t th e to p ic .. 2 .8 3. 2 .6 9. 3 .0 0. 14 . I trie d to c o n c e n trate m y se lf in o rd e r to k e e p u p w ith th e. 4 .13. 3 .8 9. 3 .7 3. 1 5 . 1 ca n 't c atc h th e so u n d o f in d iv id u a l w o rd s.. 2 .0 6. 3 .8 2. 3 .5 6. 1 6 . 1 ca n 't p ro n o u n c e w o rd s co rrec tly .. 2 .9 9. 2 .6 3. 3 .0 4. 1 7 . 1 d o n 't k n o w m e a n in g s o f w o rd s.. 3 .3 4. 3 .9 9. 3 .8 5. 1 8 . 1 ca n n o t u n d e rsta n d g ra m m atica l stru c tu res .. 3 .<. 3 .4 4. 3 .3 7. 1 9 . 1 ca n n o t k ee p u p w ith th e sp ee d o f E n g lish .. 4 .4 4. 4 .1 7. 3 .8 2. 2 0 . 1 h av e little k n o w le d g e a b o u t th e to p ic .. 3 .1 3. 2 .5 8. 3 .0 1. 2 1 . 1 c an n o t u n d e rsta n d th e m e ssag e o f th e w h o le p assa g e .. 3 .5 2. 3 .5 1. 3 .6 3. 2 2 . 1 ca n n o t u n d e rsta n d th e stru ctu re s o f th e w h o le p assa g e .. 3 .6 2. 3 .4 1. 3 .5 6. w h at w a s sa id . 5 . 1 u n d ersto o d th e p a ssa g e as a w h o le . W h at d id y o u d o w h e n y o u fa ile d to c o m p reh en d th e p a ssag e ?. m isse d . 8 . I sto p p e d listen in g to E n g lish . W h a t d id. you. do. in. o rd er to. co m p reh e n d. th e p as sa g e. e ffe ctiv e ly ? 9 . I p ro n o u n c ed so m e w o rd s in m y m in d .. sp e e d o f E n g lish . W h a t h as p rev e n te d y o u r listen in g c o m p reh en sio n ?. 5=strongly. agree, 4=agree, 3=neither. agree nor disagree,. 18. 2=disagree,. l=strongly. disagree.
(27) Table 3.5 Japanese Listening. Questionnaire. Results A v e ra g e. Q u e stio n Item s. S c o re s. 1 st Y ea r. 2 n d Y ea r. 3 rd Y ea r. 1 . W h ile liste n in g , I u n d e rsto o d th e d e v e lo p m e n t o f th e sto ry .. 4 .0 7. 3 .9 4. 4 .ll. 2 . 1 k ep t u p w ith th e sp ee d o f J ap a n e se .. 4 .5 2. 4 .2 3. 4 .3 4. 3 . 1 u n d e rsto o d w h at p ro n o u n s w e re re ferrin g to .. 4 .3 1. 3 .9 6. 4 .2 0. 4 . M y k n o w le d g e ab o u t th e to p ic h elp e d m e u n d e rstan d w h at w a s. 3 .8 3. 3 .6 9. 3 .9 0. 4 .4 5. 4 .2 5. 4 .4 2. 6 . 1 k ep t o n liste n in g , p ay in g n o atte n tio n to th e p art I m isse d .. 3 .3 7. 3 .3 9. 3 .4 6. 7 . 1 co u ld n 't listen to th e n e x t p a rt, th in k in g o f th e p a rt I m isse d .. 2 .3 1. 2 .2 0. 2 .3 8. 8 . 1 sto p p e d listen in g to Jap an e se .. 1 .8 0. 1 .6 1. 2 .0 8. 2 .2 3. 2 .2 1. 2 .2 5. 1 0 . 1 trie d to u n d erstan d th e m e a n in g o f ea ch w o rd .. 3 .4 1. 2 .9 4. 2 .7 7. 1 1 . I trie d to u n d erstan d th e m e ssa g e o f th e >v h o le p ass ag e .. 4 .3 9. 4 .0 0. 3 .8 5. 1 2 . 1 p a id atte n tio n to g ra m m a tica l stru c tu res .. 3 .3 8. 3 .0 6. 3 .4 2. 13 . 1 trie d to re m e m b e r w h a t I k n o w a b o u t th e to p ic .. 3 .14. 2 .9 9. 3 .2 1. 14 . I trie d to c o n c en tra te m y self in o rd e r to k e ep u p w ith th e sp e e d. 3 .7 5. 3 .4 9. 3 .5 1. W h a t d o y o u th in k a b o u t y o u r listen in g c o m p re h en sio n d u rin g th e te st?. sa id . 5 . 1 u n d e rsto o d th e p a ssag e as a w h o le . W h a t d id y o u d o w h e n y o u fa ile d to c o m p re h e n d th e p a ssa g e ?. W h at d id y o u d o in o rd e r to c om p reh en d th e p a ssag e e ffe ctiv ely ? 9 . I p ro n o u n c e d so m e w o rd s in m y m in d .. o f Jap an e se . W h at h a s p re v e n te d y o u r liste n in g co m p re h e n sio n ? 15 . 1 c an 't ca tch th e so u n d o f in d iv id u al w o rd s .. 1 .6 8. 1 .9 2. 2 .2 7. 16 . 1 c an 't p ro n o u n c e w o rd s c o rre ctly .. 1 .7 6. 1 .8 3. 2 .0 7. 17 . 1 d o n 't k n o w m e an in g s o f w o rd s .. 1 .8 6. 2 .2 1. 2 .3 5. 1 8 . 1 c an n o t u n d ersta n d g ra m m atic a l stru ctu re s.. 1 .9 2. 2 .2 8. 2 .5 4. 19 . 1 c a n n o t k e e p u p w ith th e sp e e d o f Jap an ese .. 1 .9 3. 2 .2 5. 2 .6 1. 2 0 . 1 h av e little k n o w le d g e ab o u t th e to p ic .. 2 .3 0. 2 .2 3. 2 .5 4. 2 1 . 1 c a n n o t u n d e rsta n d th e m es sag e o f th e w h o le p a ssag e .. 1 .8 9. 2 .7 5. 2 .8 5. 2 2 . 1 c a n n o t u n d ersta n d th e stru c tu res o f th e w h o le p a ssa g e .. 5=strongly. agree, 4=agree, 3=neither. agree nor disagree,. 19. 2=disagree,. 1 .9 7. l =strongly. 2 .7 0. disagree. 2 .7 5.
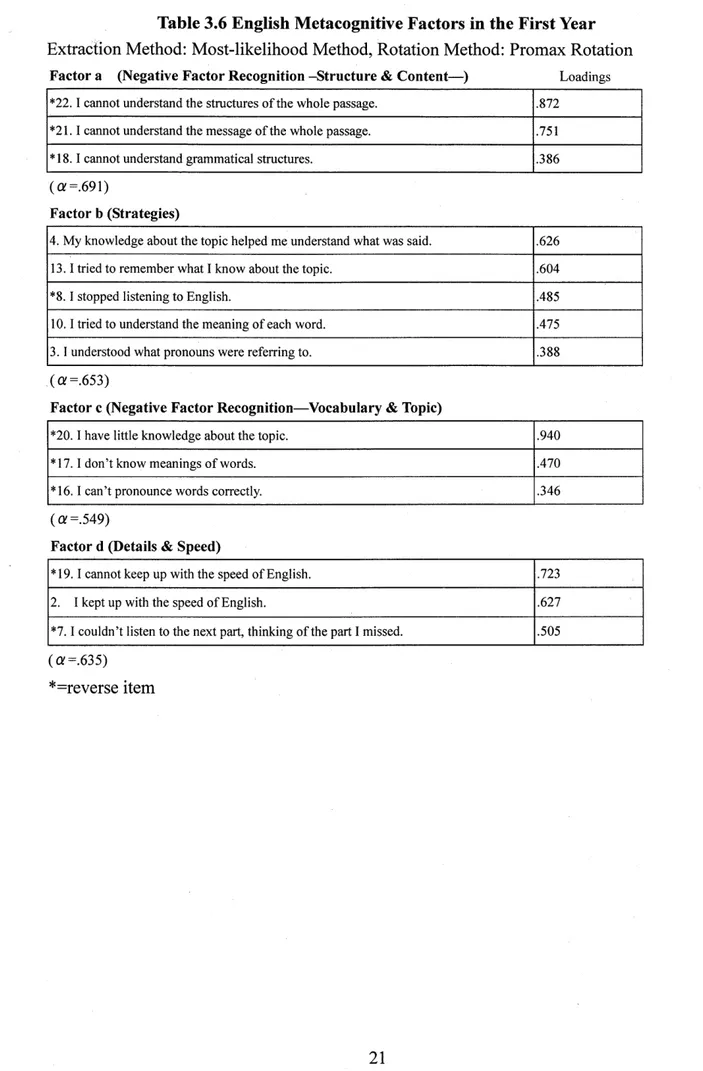
(28) 3.3. Factor Analysis Results 3.3.1 English factors Exploratory factor analyses (Matsuo & Nakamura, 2002; Oshio, 2004) were conducted to extract factors from the questionnaire results of LI and L2 listening. In the case of reverse items, the 5-point Likert scale was calculated in a diverted way. From the English questionnaire results in the first year, four factors were extracted using the maximumlikelihood analysis method, followed by promax rotation. Factor (a) was named "Negative factor recognition -structure & content-", which showed the participants' awareness of the negative factors especially in terms of structures and the content of the passage. Factor (b) was the "Strategies" factor to indicate the listeners' strategy use. Factor (c), named "Negative factor recognition-vocabulary & topic" again concerns the participants' recognition of what prevented their listening comprehension especially in vocabulary and topic of the passage. Factor (d) named "Details and speed" shows the listeners' careful attention to the details of the passage in the rapid stream of spoken English. Items 1, 5, 6, 7, 9, ll, 12, 14, 15 were eliminated because of their low loadings or isolation as one factor. The Cronbach's alpha indices were.691 to.549. As shown in Table 3.6, the results of the second year questionnaire analysis yielded five factors, accounting for 41.501 percent of variance. Five factors were extracted by the principal factor analysis method and varimax rotation. They were (a) Negative factor recognition, (b) Concentration on the content, which shows listeners' concentration on the content of the passage without focusing on individual words, (c) Strategies, (d) Details and speed, and (e) Focus on words, which shows the listeners' attempt to catch individual words in the chunk of spoken English. The Cronbach's alpha indices. were.785. to.322.. In the third year, five factors accounting for 46.251 percent of variance were extracted by principal factor analysis method and varimax rotation, as shown in Table 3.7. They were Factor (a) "Understanding the outline," (b) Negative factor recognition Vocabulary and outline -", (c) Negative factor recognition -details -", (d) "Strategies," and (e) "Focus on the outline." The Cronbach's alpha indices were.746 to.499. Question item 8 was eliminated because of its low loadings.. 20.
(29) Extraction. Table 3.6 English Metacognitive Factors in the First Year Method: Most-likelihood Method, Rotation Method: Promax Rotation. Factor a (Negative. Factor Recognition. -Structure & Content-). Loadings. * 2 2 . 1 c a n n o t u n d e rsta n d th e stru c tu re s o f th e w h o le p a ss a g e .. .8 7 2. * 2 1 . 1 c a n n o t u n d e rsta n d th e m e ss a g e o f th e w h o le p a ssa g e .. .7 5 1. * 1 8 . 1 c a n n o t u n d e rsta n d g ra m m a tic a l stru c tu r e s.. .3 8 6. <a=691). Factor b (Strategies) 4 . M y k n o w le d g e ab o u t th e to p ic h e lp e d m e u n d e rsta n d w h a t w a s sa id .. .6 2 6. 1 3 . 1 tr ie d to re m e m b e r w h at I k n o w a b o u t th e to p ic .. .6 0 4. * 8 . 1 sto p p ed liste n in g to E n g lish .. .4 8 5. 1 0 . 1 trie d to u n d e r stan d th e m e a n in g o f e a c h w o rd .. .4 7 5. 3 . 1 u n d e rsto o d w h a t p ro n o u n s w e re r efe rr in g to .. .3 8 8. (a=653). Factor c (Negative. Factor Recognition-Vocabulary. & Topic). *2 0. 1 hav e little kn ow led ge ab o ut the top ic.. .9 4 0. * 17. 1 do n 't kn ow m ean in gs o f w ord s.. .4 7 0. * 16 . 1 can 't pro no un ce w ord s correctly.. .34 6. ( a=.549). Factor d (Details. & Speed). * 1 9 . 1 c a n n o t k e ep u p w ith th e sp e e d o f E n g lish .. .7 2 3. 2.. .6 2 7. I k e p t u p w ith th e s p e e d o f E n g lish .. * 7 . 1 c o u ld n 't liste n to th e n ex t p art, th in k in g o f th e p a rt I m iss e d .. (a=.635). *=reverse item. 21. .5 0 5.
(30) Table3.7 English Metacognitive Factors in the Second Year Extraction Method: Principal Factor Analysis Method, Rotation Method: VarimaxRotation Factor a (Negative. Factor Recognition). Loadings. * 2 2 . I c an 't u n d e rs ta n d th e stru ctu r e o f th e w h o le p a ss ag e .. .7 7 6. * 2 1 . I c an 't u n d e rs ta n d th e m e s sa g e o f th e w h o le p a ss a g e .. .7 6 0. * 1 6 . I c an 't p ro n o u n c e th e w o rd c o rre ctly .. .6 2 0. * 2 0 . I h a v e little k n o w le d g e ab o u t th e to p ic .. .5 8 2. * 1 8 . I d o n 't u n d e rs ta n d g ra m m a tic a l stru ctu r e .. .5 2 3. * 1 5 . 1 c a n 't c a tc h th e so u n d o f in d iv id u a l w o rd s .. .3 8 3. * 1 7 . 1 d o n 't k n o w m e an in g s o f w o r d s .. .3 7 6. * 1 9 . 1 c a n 't k e e p u p w ith th e sp e e d .. .3 7 3. (the proportion. of variance. Factor b (Concentration. explained^13.428%,. (X=.785). on the Content ). 1 4 . I trie d to c o n c e n tr ate m y se lf in o rd er to k e ep u p w ith th e sp e e d o f E n g lish .. .7 6 0. * 8 . I s to p p e d listen in g to E n g lis h .. .5 4 2. 1 1 . I trie d to u n d e rsta n d th e m e s sa g e o f th e w h o le p a s sa g e .. .5 1 5. (the proportion. of cumulative variance explained=20.843%,. a =.602). Factor c (Strategies) M y k n o w le d g e a b o u t th e to p ic h e lp e d m e u n d er sta n d w h a t w a s s a id .. .6 0 2. 5 . 1 u n d e rsto o d th e p a ss a g e a s a w h o le .. .4 7 4. 1 3 . 1 tr ie d to re m e m b er w h a t I k n e w a b o u t th e to p ic .. .4 6 8. 1 2 . 1 p a id a tte n tio n to g r a m m atic a l str u c tu re s .. .3 6 3. 1 . W h ile lis te n in g , I u n d e rsto o d th e d e v e lo p m en t o f th e sto ry .. .3 6 0. (th e p rop ortio n o f cu m u lativ e v arian c e ex p lain ed ^ ? .86 0% , Oi = .6 53 ) F a cto r d (D eta ils & S p e e d ) 2 . 1 kept u p w ith th e spee d o f E n g lish .. .49 4. 6 . 1 kept o n listenin g , p aying n o atten tion to th e part I m issed.. -.4 19. 3. 1 un dersto od w h at th e p ron ou ns referred to .. .3 75. (th e p rop o rt io n o f cu m u la tiv e v arian c e ex p lain ed = 3 4 .84 3 % , a = .7 8 5 ) F a cto r e (F o c u s o n W o rd s) 9 . I p ron ou nced som e w ord s in m y m in d .. .64 8. *7 . I cou ldn 't listen to th e n ext p art , th in king of th e part I m issed.. -.52 4. 10 . 1 tried to u nd erstand the m ean in g of each w ord .. .5 22. (th e p ro p o rtio n o f c u m u la tiv e va rian c e ex p la in e d ^ 1 .5 0 1% , a = .5 8 0 ) * = re v e rs e ite m. 22.
(31) Table 3.8 English Metacognitive Factors in the Third Year Extraction Method: Principal Factor Analysis Method, Rotation Method: Varimax Rotation Factor a (Understanding the Outline) Loadings 1 . W h i le l is t e n in g , I u n d e r s t o o d t h e d e v e lo p m e n t o f t h e s to r y. .7 5 9. 2 . 1 k e p t u p w it h t h e s p e e d o f E n g l is h. .7 0 8. 4 . M y k n o w le d g e a b o u t th e t o p ic h e l p e d m e u n d e r s t a n d w h a t w a s s a i d .. .6 9 9. 5 . 1 u n d e rsto o d th e p a s sa g e a s a w h o le. .4 6 6. 1 4 . I t r ie d t o c o n c e n tr a t e m y s e l f in o r d e r t o k e e p u p w it h t h e s p e e d o f E n g li s h .. .4 5 3. 3 . 1 u n d e rsto o d w h at th e p ro n o u n s re ferr e d to .. .4 0 0. (the. variance. explained=l. Factor b (Negative. 5.979%,. Oi =.746). Factor Recognition-Vocabulary. & Outline-). * 17 . 1 d o n 't k n o w m e an in g s o f w o rd s .. .7 5 9. * 19 . 1 ca n 't k e e p u p w ith th e sp e e d .. .6 5 1. * 1 5 . 1 ca n 't c atc h th e s o u n d o f in d iv id u a l w o rd s .. .6 5 1. * 2 1 . I c a n 't u n d er sta n d th e m e s s ag e o f th e w h o le p a s sa g e .. .3 9 3. 10 . 1 trie d to u n d e rsta n d th e m e a n in g o f e ac h w o rd .. -.3 6 6. (the proportion. of cumulative variance explained=29.498%,. Factor c (Negative. Oi =.7 12). Factor Recognition-Details-). * 1 6 . I c a n 't p ro n o u n c e th e w o rd c o rre c tly .. .7 10. * 1 8 . I d o n 't u n d e rsta n d g ra m m a tic a l stru c tu re .. .6 9 7. * 2 0 . I h a v e little k n o w le d g e a b o u t th e to p ic .. .5 2 4. * 2 2 . I c a n 't u n d e rsta n d th e stru c tu re o f th e w h o le p a s sa g e .. .4 4 1. (the proportion. of cumulative variance explained=36.5. 1 9%, Qt =.702). Factor d (Strategies) * 7 . I c o u ld n 't liste n to th e n e x t p a rt, th in k in g o f th e p a rt I m is se d .. -.5 9 9. 12.. I p a id a tte n tio n to g ra m m atic a l stru c tu re s .. .5 6 5. 13.. I trie d to re m e m b e r w h a t I k n e w a b o u t th e to p ic .. .4 9 9. 9 . I p ro n o u n c e d s o m e w o rd s in m y m in d .. .4 5 2. (the proportion of cumulative variance explamed=42.034%, Factor e (Focus on the Outline). (X=.565). 6 . 1 k e p t o n liste n in g , p a y in g n o a tte n tio n to th e p a rt I m is se d .. .5 7 3. 1 1 . I trie d to u n d e rs ta n d th e m e s sa g e o f th e w h o le p a ss ag e .. .5 6 3. (the proportion of cumulative variance explained=46.25 *=reverse item. 23. 1%, a =.499).
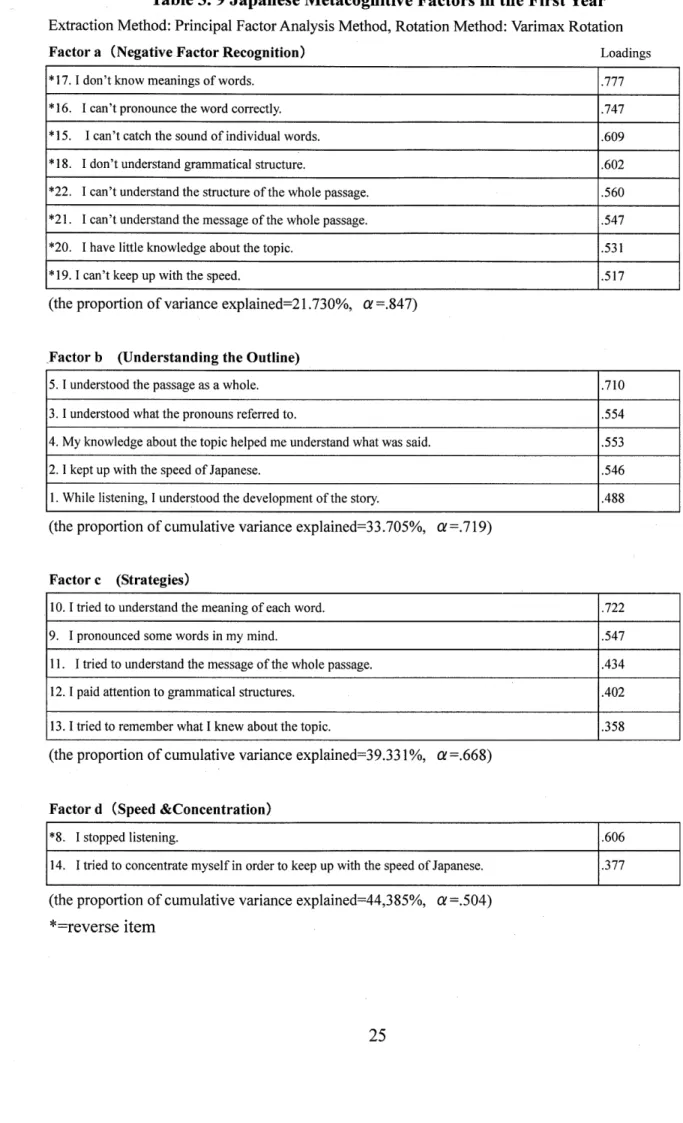
(32) 3.3.2 Japanese factors Japanese factors were extracted by the principal factor analysis method, followed by varimax rotation. The first three factors wee the same in each year. The first factor common to the three times was "Negative factor recognition," the second "Understanding the outline," and the third "Strategies." This result may indicate that the participants answered in the same way across the three times of research, because they had already established efficient listening ability of LI, and were able to monitor their LI listening performance more clearly than in English. In the first year, in addition to the three factors described above, another factor "Speed and concentration" was extracted. The proportion of variance explained was 44.385 percent and the Cronbach's alpha indices were from.847 to.504, as shown in Table 3.8. Items 6 and 7 were eliminated because of their low loadings. With regard to the second year analysis, along with two more factors, the five factors explained 52.364 percent of variance. The Cronbach's alpha indices were between.852 and.509. In the third year, the three factors extracted explained 55.336 percent of variance and the Cronbach's alpha indices were between.834 and.805. Item 6 was excluded because of its low loadings.. 24.
(33) Table 3. 9 Japanese Metacognitive Factors in the First Year Extraction Method: Principal Factor Analysis Method, Rotation Method: Varimax Rotation Factor a (Negative Factor Recognition) Loadings * 1 7 . 1 d o n 't k n o w m e a n in g s o f w o rd s.. .7 7 7. * 1 6 . I c a n 't p ro n o u n c e th e w o rd c o rr e ctly .. .7 4 7. * 15.. .6 0 9. I c an 't c atc h th e so u n d o f in d iv id u a l w o rd s.. * 1 8 . I d o n 't u n d e rsta n d g ra m m a tic a l stru c tu r e .. .6 0 2. * 2 2 . I c a n 't u n d e rsta n d th e stru c tu re o f th e w h o le p a ssa g e .. .5 6 0. * 2 1 . I c a n 't u n d e rsta n d th e m e ss a g e o f th e w h o le p a ssa g e .. .5 4 7. * 2 0 . I h a v e little k n o w le d g e a b o u t th e to p ic .. .5 3 1. * 1 9 . 1 c a n 't k e e p u p w ith th e s p e e d .. .5 1 7. (the proportion. Factor b. of variance explained^1.730%,. (Understanding. 01 =.847). the Outline). 5 . 1 u n d e r s t o o d t h e p a s s a g e a s a w h o le .. .7 1 0. 3 . 1 u n d er sto o d w h a t th e p ro n o u n s r efe rr e d to .. .5 5 4. 4 . M y k n o w le d g e a b o u t th e t o p ic h e lp e d m e u n d e r s t a n d w h a t w a s s a i d .. .5 5 3. 2 . 1 k e p t u p w ith t h e s p e e d o f J a p a n e s e .. .5 4 6. 1 . W h i le l is t e n in g , I u n d e r s t o o d t h e d e v e lo p m e n t o f t h e s to r y .. .4 8 8. (the proportion. of cumulative. variance explained=33.705%,. Oi=.719). Factor c (Strategies) 1 0 . 1 trie d to u n d e rsta n d th e m e a n in g o f e a c h w o rd .. .7 2 2. 9 . I p ro n o u n c e d so m e w o rd s in m y m in d .. .5 4 7. 1 1 . I tr ie d to u n d e rs tan d th e m e s sa g e o f th e w h o le p a ss ag e .. .4 3 4. 1 2 . 1 p a id a tte n tio n to g ra m m a tic a l stru ctu r e s.. .4 0 2. 1 3 . 1 trie d to re m e m b e r w h a t I k n e w a b o u t th e to p ic .. .3 5 8. (the proportion. of cumulative. variance explained=39.33. 1%, Oi=.668). Factor d (Speed &Concentration) * 8 . I s to p p e d li s t e n in g .. .6 0 6. 1 4 . I t r ie d to c o n c e n t r a t e m y s e l f in o r d e r t o k e e p u p w it h t h e s p e e d o f J a p a n e s e .. .3 7 7. (the proportion. of cumulative. variance explained=44,385%,. *=reverse item. 25. Oi=.504).
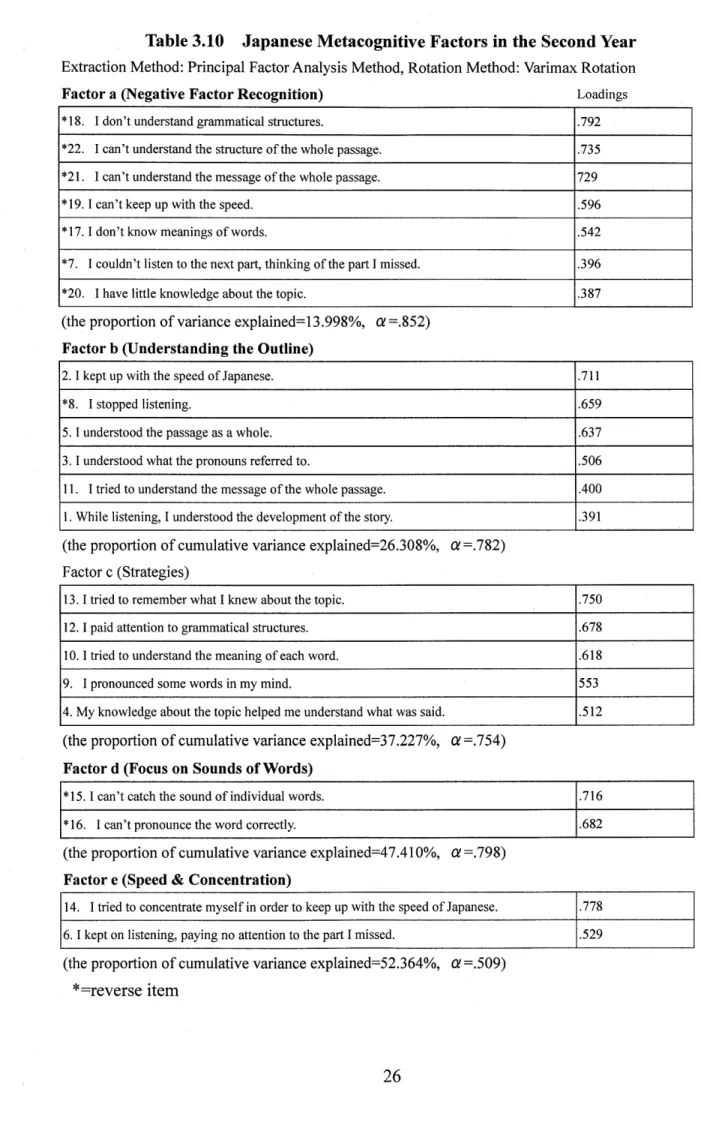
(34) Table 3.10 Japanese Metacognitive Factors in the Second Year Extraction Method: Principal Factor Analysis Method, Rotation Method: Varimax Rotation Factor a (Negative Factor Recognition) Loadings * 1 8 . I d o n 't u n d er stan d g ra m m atic a l s tru c tu re s .. .7 9 2. * 2 2 . I c a n 't u n d e r sta n d th e stru c tu re o f th e w h o le p a ss a g e .. ,7 3 5. * 2 1 . I c a n 't u n d e r stan d th e m e s sa g e o f th e w h o le p a s sa g e .. 729. * 19 . 1 ca n 't k e e p u p w ith th e sp e e d .. .5 9 6. * 17 . 1 d o n 't k n o w m e a n in g s o f w o rd s .. .5 4 2. * 7 . I co u ld n 't listen to th e n ex t p a rt, th in k in g o f th e p a rt I m isse d .. .3 9 6. * 2 0 . I h av e little k n o w le d g e a b o u t th e to p ic .. .3 8 7. (the proportion. of variance explained=l3.998%,. Factor b (Understanding. Of=.852). the Outline). 2 . 1 k e p t u p w ith th e sp e e d o f J ap a n e se .. .7 1 1. * 8 . I sto p p e d liste n in g .. .6 5 9. 5 . 1 u n d er sto o d th e p a s sa g e a s a w h o le .. .6 3 7. 3 . 1 u n d er sto o d w h a t th e p ro n o u n s re fe rre d to .. .5 0 6. 1 1 . I trie d to u n d e rs ta n d th e m e s sa g e o f th e w h o le p a ss ag e .. .4 0 0. 1 . W h ile liste n in g , I u n d e r sto o d th e d e v e lo p m e n t o f th e s to ry .. .3 9 1. (the proportion. of cumulative variance explained=26.308%,. (X=.782). Factor c (Strategies) 1 3 . 1 trie d to re m e m b e r w h a t I k n e w ab o u t th e to p ic .. .7 5 0. 1 2 . 1 p a id atten tio n to g ra m m a tic a l stru c tu re s .. .6 7 8. 1 0 . 1 trie d to u n d e r sta n d th e m e a n in g o f e a c h w o rd .. .6 1 8. 9 . I p ro n o u n c e d so m e w o rd s in m y m in d .. 55 3. 4 . M y k n o w le d g e ab o u t th e to p ic h e lp e d m e u n d e rsta n d w h a t w a s sa id .. .5 1 2. (the proportion. of cumulative. variance explained=37.227%,. (X=.754). Factor d (Focus on Sounds of Words) * 1 5 . 1 c an 't c atc h th e s o u n d o f in d iv id u a l w o rd s .. .7 1 6. * 16 . I c a n 't p r o n o u n c e th e w o rd c o rre c tly .. .6 8 2. (the proportion. of cumulative variance explained=47.41. 0%, Oi=.798). Factor e (Speed & Concentration) 14 . I tried to con centrate m y self in ord er to k eep up w ith th e speed of Jap anese.. .7 78. 6. 1 kep t o n listening , p ay ing n o atten tio n to th e p art I m issed .. .5 29. (the proportion. of cumulative. variance explained=52.364%,. *=reverse item. 26. 01 =.509).
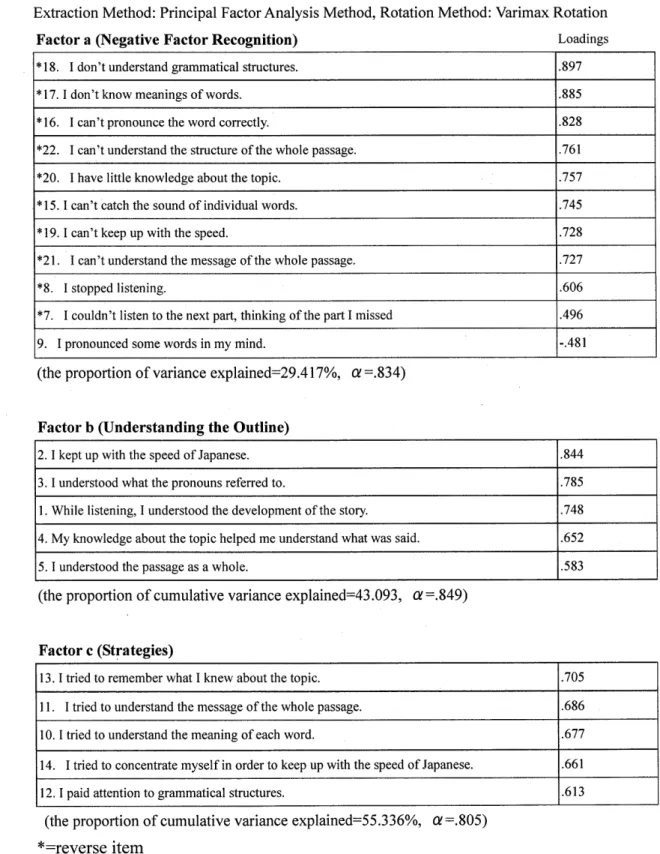
(35) Table 3.ll Japanese Metacognitive Factors in the Third Year Extraction Method: Principal Factor Analysis Method, Rotation Method: Varimax Rotation Factor a (Negative Factor Recognition) Loadings * 1 8 . I d o n 't u n d e rsta n d g ra m m a tic a l stru ctu r e s.. .8 9 7. * 1 7 . 1 d o n 't k n o w m e a n in g s o f w o rd s .. .8 8 5. * 1 6 . I c an 't p ro n o u n c e th e w o r d c o rre c tly .. .8 2 8. * 2 2 . I c a n 't u n d e rs ta n d th e stru ctu re o f th e w h o le p a ss a g e .. .7 6 1. * 2 0 . I h av e little k n o w le d g e a b o u t th e to p ic .. .7 5 7. * 15 . 1 c a n 't c atc h th e s o u n d o f in d iv id u a l w o r d s .. .7 4 5. * 19 . 1 c an 't k e e p u p w ith th e sp e e d .. .7 2 8. * 2 1 . I c a n 't u n d e rstan d th e m es s ag e o f th e w h o le p a s sa g e .. .7 2 7 .6 0 6. I sto p p e d liste n in g . * 7 . I c o u ld n 't liste n to th e n e x t p a rt, th in k in g o f th e p a rt I m iss e d. .4 9 6. 9 . I p ro n o u n c e d s o m e w o rd s in m y m in d .. - .4 8 1. (the proportion. of variance explained=29.417%,. Factor b (Understanding. a =.834). the Outline). 2 . 1 k e p t u p w ith t h e s p e e d o f J a p a n e s e .. .8 4 4. 3 . 1 u n d e rsto o d w h a t th e p ro n o u n s re ferr e d to .. .7 8 5. 1 . W h i le l is t e n in g , I u n d e r s t o o d t h e d e v e lo p m e n t o f t h e s to r y .. .7 4 8. 4 . M y k n o w le d g e a b o u t th e t o p ic h e l p e d m e u n d e r s t a n d w h a t w a s s a i d .. .6 5 2. 5 . 1 u n d e r s t o o d th e p a s s a g e a s a w h o l e .. .5 8 3. (the proportion. of cumulative. variance explained=43.093,. QL=.849). Factor c (Strategies) 13 . 1 trie d to re m e m b e r w h a t I k n e w a b o u t th e to p ic .. .7 0 5. 1 1 . I tried to u n d e rsta n d th e m e ss a g e o f th e w h o le p a ssa g e .. .6 8 6. 1 0 . 1 trie d to u n d e rsta n d th e m e an in g o f e a c h w o r d .. .6 7 7. 14 . I trie d to c o n c e n tra te m y se lf in o rd e r to k e e p u p w ith th e sp e e d o f Ja p a n e se .. .6 6 1. 1 2 . 1 p a id a tte n tio n to g ra m m a tic a l stru ctu re s.. .6 1 3. (the proportion. of cumulative. variance explained=55.336%,. *=reverse item. 27. a =.805).
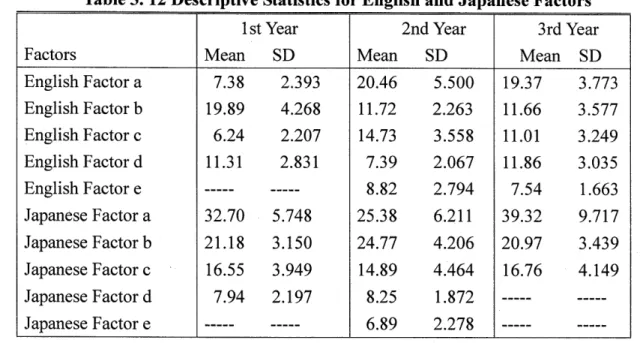
(36) The average scores and standard deviations. of Japanese factors were computed. and are shown in Table 3. 12.. Table 3. 12 Descriptive. Statistics. for English. 1 st Y e ar F actors. M ean. and Japanese Factors. 2 n d Y e ar. SD. M ean. 3 rd Y ear. SD. M ean. SD. E n glish F ac to r a. 7 .3 8. 2 .3 9 3. 2 0 .4 6. 5 .5 0 0. 19 .3 7. 3 .7 7 3. E n glish F ac to r b. 19 .8 9. 4 .2 6 8. l l.7 2. 2 .2 6 3. ll .66. 3 .5 7 7. E n g lish F ac to r c. 6 .2 4. 2 .2 0 7. 14 .7 3. 3 .5 5 8. ll .0 1. 3 .24 9. E n g lish F ac to r d. ll.3 1. 2 .8 3 1. 7 .3 9. 2 .0 6 7. ll .86. 3 .0 3 5. 8 .82. 2 .7 94. 7 .5 4. 1 .6 6 3. E n g lish F ac to r e Jap an e se F a cto r a. 32 .7 0. 5 .74 8. 2 5 .3 8. 6 .2 1 1. 3 9 .3 2. 9 .7 17. Jap an e se F a cto r b. 2 1 .18. 3 .15 0. 2 4 .7 7. 4 .2 0 6. 2 0 .9 7. 3 .4 3 9. Jap an e se F a cto r c. 16 .5 5. 3 .94 9. 14 .89. 4 .4 64. 16 .7 6. 4 .14 9. Jap an e se F a cto r d. 7 .94. 2 .19 7. 8 .2 5. 1.8 7 2. 6 .89. 2 .2 7 8. Jap an e se F a cto r e. For further analysis in Study 1, the total scores of English tests, Japanese tests, English factors and Japanese factors were calculated. Their meanscores and standard deviations werecomputedand are presented in Table 3. 1 3. Table 3. 13 Descriptive Statistics. for Four Categories of Abilities. 1 st Y e a r. 2 n d Y e ar. 3 rd Y e ar. T e sts. M e an. SD. E n g lish T ests. 6 5 .0 0. 7 .9 0 7. 7 0 .6 5. 1 0 .6 6 9. 7 8 .2 8. l l .19 2. J ap a n e se T ests. 4 0 .3 0. 3 .6 6 6. 4 3 .14. 3 .5 4 7. 4 2 .8 6. 3 .8 2 2. E n g lish F ac to rs. 4 4 .8 2. 7 .0 4 9. 6 3 .1 3. 9 .4 9 0. 6 1.4 4. 7 .8 2 8. J ap a n e se F a cto rs. 7 8 .3 8. 9 .5 4 9. 80 .1 8. l l .2 8 5. 7 7 .0 6. l l .2 8 1. M ean. 28. SD. M ean. SD.
(37) CHAPTER. 4. STUDY 1. 4.1 Research Questions As the first stage of analysis, Study 1 aims generally to examine the relationship between English listening performance and four component variables: LI language proficiency, L2 language proficiency, LI metacognitive abilities and L2 metaeognitive abilities. Then further exploration of its relevance to specific language skills and metacognitive factors is done. Multiple regression analyses and path models will reveal English listening's major explanatory variable and the reciprocal relationship among the four categories. In this chapter, the following research questions were addressed: 1. Which contributes most to high school students' English listening performance, English proficiency, Japanese proficiency, English metacognitive abilities or Japanese metacognitive abilities? 2. Is there any change in the strongest contributor to listening performance over time? 3. Is there any diachronic change of relationship among English listening and the four component variables listed above? 4.2 Method. In order to identify explanatory variables of the participants' English listening performance, multiple regression analyses were performed, in which the dependent variable was the scores of the English listening test and the independent variables were the following four component variables: the total scores of English tests, Japanese tests, English factors and Japanese factors. Furthermore, in order to clarify the relevance amongcomponent variables, a series of multiple regression analyses were repeated with each of the component variables as the dependent variables and the rest as independent variables. The analysis results were presented in path models. (For the information of the participants, tests and questionnaires, see Chapter 2.). 29.
図

+7

関連したドキュメント
We hope that foreign students in middle and high school will find this glossary useful and become fond of math.. Moreover, in order to improve the usefulness of this glossary, we
Standard domino tableaux have already been considered by many authors [33], [6], [34], [8], [1], but, to the best of our knowledge, the expression of the
An example of a database state in the lextensive category of finite sets, for the EA sketch of our school data specification is provided by any database which models the
In this, the first ever in-depth study of the econometric practice of nonaca- demic economists, I analyse the way economists in business and government currently approach
Then it follows immediately from a suitable version of “Hensel’s Lemma” [cf., e.g., the argument of [4], Lemma 2.1] that S may be obtained, as the notation suggests, as the m A
Section 3 is first devoted to the study of a-priori bounds for positive solutions to problem (D) and then to prove our main theorem by using Leray Schauder degree arguments.. To show
This paper presents an investigation into the mechanics of this specific problem and develops an analytical approach that accounts for the effects of geometrical and material data on
While conducting an experiment regarding fetal move- ments as a result of Pulsed Wave Doppler (PWD) ultrasound, [8] we encountered the severe artifacts in the acquired image2.
