1 ISASE 2020
A Study on Evaluation of Healing Level Using Brainwave Stimulated by
Tourist Spot Image
Isao Nakanishi *, Soushi Uchida ** and Yoshiaki Sindo ***
* Faculty of Engineering, Tottori University, 4-101 Koyama-minami, Tottori-shi, Tottori 680-8552, Japan [email protected]
** School of Engineering, Tottori University, 4-101 Koyama-minami, Tottori-shi, Tottori 680-8552, Japan [email protected]
*** Graduate School of Sustainable Sciences, Tottori University, 4-101 Koyama-minami, Tottori-shi, Tottori 680-8552, Japan [email protected]
Abstract: Healing is an emotion that even the person himself is hard to notice. In this paper, healing levels of tourist spots are evaluated using brainwaves stimulated by tourist spot images. Healing level is estimated by a ratio of the sum of spectral elements in waveband to that in waveband. From an experiment using eight subjects, it is found that tourist spots in white- and gray-colored images are evaluated as being healed since the visual perception of human beings is greatly influenced by color.
Keywords: Emotion, Healing, Brainwave, Tourist spot, Color
1. INTRODUCTION
In 2019, a company’s survey showed that “Tottori” prefecture where our university has located was ranked first as a place where foreign travelers should visit in Japan. Tourism is essential for regional developments. In addition, it is important to quantitatively figure out what consumers need in a modern society where the consumers’ interests and actions are diversified.
“Healing” is one of the important elements of tourist attractions. However, the healing is an emotion that even the person himself is hard to notice. It is difficult to express and quantify how much the person is healed. There have been proposed several methods for emotion evaluation [1-4]. In this paper, we evaluate healing levels of tourist spots, which are in Tottori prefecture, Japan, based on the relaxed state of experimental subjects using their brainwaves stimulated by tourist spot images. 2. EVALUATION OF HEALING LEVEL USING BRAINWAVE
2.1 Brainwave
Electrical changes from many synapses (neurons) in the cerebral cortex are accumulated and then detected as a brainwave (Electroencephalogram: EEG) on the scalp by using an electrode. As typical patterns, (0.5-3Hz), (4-7Hz), (8-13Hz), and (14-30Hz)are well known
and detectable when human beings are during deep sleep, getting sleepy, being relaxed, and some mental activity, respectively. The brainwaves are utilized not only in medical and physiological fields but also in psychological and engineering fields.
2.2 Estimation of Healing Level
In conventional researches of emotion evaluation using the brainwave, there have been proposed to use spectrum analysis [1], Russell’s circumplex model [2], fractal dimension [3], and neural networks [4].
The purpose of this study is to confirm whether healing levels of tourist spots can be evaluated using brainwaves stimulated by tourist spot images. Therefore, we introduce a simple method, which has been proposed to estimate the relaxed state (RS) of human beings using the following definition [5].
(1) In this paper, we regard this relaxed state as healing level. 2.3 Evaluation of Estimation Method of Healing Level
First, we evaluated the introduced estimation method of healing levels using the image database: OASIS [6], in which each image is categorized by two dimensions, one is positive/negative emotion, and another is its intensity. In addition, a two-dimensional domain, which is
Sum of spectral elements in waveband Sum of spectral elements in waveband
RS
2 constructed by the two dimensions, is divided into three regions, “positive”, “neutral”, and “negative”. In this paper, we selected a positive image that feels healed and a negative image that feels stressed from the database. Figure 1 shows the positive image.
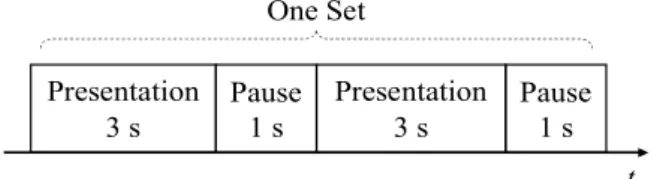
These two images were presented to experimental subjects. Using a video-player, the positive image was first presented for 3 seconds, and then after a pause of 1 second, the negative image was presented. Before the next presentation, a pause of 1 second was inserted. The presentation of two images with the pauses was treated as one set, and it was repeated ten times for each subject.
The number of experimental subjects was ten and they were 22 years old and healthy. The distance between a subject and a display that presented the images to the
subject was 1 m and the measurement of EEG was conducted in a simplified darkroom as shown in Fig. 3.
The subjects were required to keep quiet and measured their EEGs while watching the images (display). As a brainwave sensor, Epoc+ produced by Emotive Co., Ltd., which has fourteen electrodes defined by 10% method and of which sampling frequency was 256 Hz.
Since presenting images and measuring brainwaves were not synchronized in this measurement, the following process was performed at each measurement. Video-player software for controlling the presentation of images and software for controlling the brainwave sensor was installed on the same computer, and their operating times were simultaneously displayed on the computer. Thus, the presentation of images always started after the start of measuring brainwaves. Then, the display image where the operating times of both types of software were displayed was captured by a digital camera. After each measurement, time--distance between operating times was calculated by using the captured image, and it was regarded as a time-lag of synchronization. By subtracting the sampled data corresponding to the time lag from the initiation site of the measured EEG data, EEG synchronization to the image presentation was achieved.
After this synchronization, the measured EEG signal was passed through a band-pass filter of which bandwidth was 4~43 Hz. Then, sampled data for 3 seconds which corresponded to the interval of presenting each image were extracted. From the data, an amplitude spectrum was calculated by fast Fourier transform (FFT) and then RS was obtained. In this study, visual stimulation is applied; therefore, we focus RSs from the electrodes: O1 and O2 on the back of the head, where the visual cortex is located.
Averaged RS values in O1 and O2 from all subjects are summarized in Table 1.
Table 1: Averaged RSs form ten subjects when presenting positive and negative images
Subject A B C D E Positive 1.33 0.81 0.73 0.67 0.73 Negative 0.72 0.81 0.59 0.59 0.62 Subject F G H I J Positive 1.48 1.24 2.88 0.56 0.71 Negative 1.01 1.06 2.47 0.78 0.69 RS values when presenting a positive image were almost larger than those when presenting a negative one; therefore, it is confirmed that healing levels could be estimated using the proposed method. On the other hand, RS values of subject “B” and “I” when presenting a
Figure 1: A positive image in OASIS database [6]
Presentation 3 s Pause 1 s Presentation 3 s Pause 1 s One Set t
Figure 2: A presentation set of two images
3 positive image are smaller than those when presenting a negative one. In this study, it is not purposed to establish a universal method for estimating healing levels, which is adaptable to all human beings. Thus, the subjects: “B” and “I” were excluded in the following evaluations.
3. ESTIMATION OF HEALING LEVEL USING BRAINWAVE
In this section, we evaluate healing levels of tourist spots using brainwaves stimulated by the tourist spots’ images, which were represented in Tottori prefecture, Japan. The number of the images was twenty and they were shown in Fig. 4.
A video data for successively presenting twenty images to subjects was created as illustrated in Fig. 5, where one cycle consists of successive 3 seconds for presenting an image and 1 second for a pose, and this cycle is repeated twenty times as one set.
This video was presented ten times per subject while
randomly changing the order of twenty images.
The number of subjects was eight excluding subjects: “B” and “I”. RS values were obtained in the same way as described in Sect. 2.2. Detailed RS values are omitted for lack of space but scores of 20 to 1 were assigned to each image in descending order of the RS values every subject, and ranking was performed using a total score of each image for all subjects.
Figure 6 (a) shows the top two images in the ranking while (b) shows the bottom two images.
In studies on a relation between color and brainwaves, there is a report that brainwaves in waveband were activated when people watch white or gray color while brainwaves in waveband were activated when people watch blue or yellow color [7]. It is certain that the top two images contain white and gray colors and the right side of the bottom two images contains blue and yellow colors. RS value used depends on spectral elements in and wavebands; therefore, it is considered that the white- and gray- colored images were evaluated as being healed while blue- and yellow-colored images were evaluated as not being healed.
4. CONCLUSIONS
We evaluated healing levels of tourist spots using a ratio of waveband spectral elements to waveband spectral elements in brainwaves stimulated by the tourist spots’ images. As a result, tourist spots in white- and gray-colored images were evaluated as being healed since the visual perception of human beings is greatly
Figure 4: Twenty images used in evaluation
1 One Set t One cycle 2 20 3 s 1 s
Figure 5: Presentation cycles for presenting twenty images
4 influenced by color. Therefore, it might be expected to introduce other estimation methods of healing levels, which are independent of color. However, it is meaningless to estimate healing levels using gray images of tourist spots. Color is certainly important for healing people. On the other hand, it is questionable whether the healing levels could be evaluated only by visual sense. The healing is felt by the five senses including vision. It is necessary to evaluate healing levels of tourist spots by using brainwaves measured in actual places.
REFFERENCES
[1] T. Musha, H.Terasaki, H. Haque and G. Ivanitsk; Feature extraction from EEGs associated with emotions, Artificial Life and Robotics, pp. 15-19, 1997.
[2] J. A. Russell; A circumplex model of affect,Journal of Personality and Social Psychology, Vol. 36, pp. 1161-1178, 1980.
[3] T. Maruyama, K. Hashimoto, S. Ueda, and M. Nakagawa; Emotional Measurements Method on the basis of Fractal Dimension of EEG - Consider the Use of Refreshing Shampoo -, Journal of Japan Society for Fuzzy Theory and Intelligent Informatics, Vol. 24, No. 6, pp. 1137-1153, 2012.
[4] A. Subasia and E. Erçelebib; Classification of EEG Signals Using Neural Network and Logistic Regression, Computer Methods and Programs in Biomedicine, Vol. 78, Issue 2, pp. 87-99, 2005. [5] H. Taguchi; “The Secret to Healthy Long Life”
Decrease in Oxidative and Mental Stress (in Japanese), Foods & Food Ingredients J. Jpn., Vol. 217, No.1, pp. 76-89, 2012.
[6] B. Kurdi, S. Lozano, and M. R. Banaji; Introducing the Open Affective Standardized Image Set (OASIS), Behavior Research Methods, Vol. 49, No. 2, pp. 457-470, 2017.
[7] K. Mishima, and E. Fujii; Fundamental Studies on the Characteristics of Electroencephalogram inspecting Several Colors (in Japanese), Zouenzasshi, Vol. 54, No. 5, pp. 108-113, 1990.