INTRODUCTION
Autism is defined solely based on the nature of its characteristic behavior : impairment of social action, communication, and imagination. Several studies on
ORIGINAL
Findings of brain
99mTc-ECD SPECT in high-functioning autism
- 3-dimensional stereotactic ROI template analysis of brain
SPECT-Hiromichi Ito
1), Kenji Mori
1), Toshiaki Hashimoto
2), Masahito Miyazaki
1), Ayuko Hori
3),
Shoji Kagami
1), and Yasuhiro Kuroda
1)1)
Department of Pediatrics, Institute of Health Biosciences, The University of Tokushima Graduate School, Tokushima, Japan ;2)
Department of Education for the Disabled, Faculty of School Education, Naruto University of Education, Naruto, Japan ; and3)
Department of Radiologic Technology, School of Health Science, The University of Tokushima, Tokushima, Japan
Abstract : The aim of this study is confirmation of an abnormal regional cerebral blood flow (rCBF) pattern in high-functioning autism (HFA). Confirmation of an abnormal rCBF pattern in HFA may be useful for elucidate of its pathophysiology and a differential diagnosis, such as with attention-deficit / hyperactivity disorder (AD / HD). Brain99mTc-ECD SPECT was performed in 16 cases of HFA. The HFA group consisted of 16 cases of HFA. They were all male, with an IQ of 76∼126. They had normal brain MRI findings, and had an age of 9∼14 years. We examined abnormal rCBF in HFA by comparing the results to those in the control group. The control group consisted of 1 male and 4 females cryptogenic epilepsy patients with normal intelligence. They have no problems in learning at school or mental or behavioral traits. They had normal brain MRI or SPECT findings, and had an age of 7∼15 years. 3-dimensional stereotactic ROI template (3DSRT) was used to analyze SPECT data. We calculated the ‘relative rCBF (%)’ (RI count of each segment×100 / Sum of RI count of the corresponding hemisphere), and compared the values between the two groups. We found a significantly low ‘relative rCBF (%)’ in the left temporal region in the HFA group. We also calculated the ‘L/R ratio’ (the ‘relative rCBF (%)’ of a segment on the left side / the ‘relative rCBF (%)’ of the corresponding segment on the right side), and compared the value for each segment between the two groups. There were no significant differences in any segments between the two groups. We also checked for differences in the ‘relative rCBF (%)’ between segments on the right side and corresponding segments on the left side in both the HFA and control groups. We found significant right<left perfusion in the angular region and significant left<right perfusion in the pericallosal, thalamus, and hippocampus region in the HFA group. We also found significant right<left perfusion in the temporal region in the control group. Significant hypoperfusion in the left temporal region due to an unidentified underlying brain pathology and abnormal laterality in the angular, temporal (lack of right<left perfusion), pericallosal, thalamus, and hippocampus regions may influence the symptoms of autism. J. Med. Invest. 52 : 49-56, February, 2005
Keywords :99mTc-ECD SPECT, high-functioning autism, rCBF, 3DSRT
Received for publication August 19, 2004 ; accepted November 30, 2004.
Address correspondence and reprint requests to Hiromichi Ito, Department of Pediatrics, Institute of Health Biosciences, The University of Tokushima Graduate School, Kuramoto-cho, Tokushima 770-8503, Japan and Fax : +81-88-631-8697.
The Journal of Medical Investigation Vol. 52 2005
autism have been conducted using various brain imaging techniques, including magnetic resonance imaging (MRI), single photon emission computed tomography (SPECT), and positron emission tomography (PET). While there have been various reports on brain MRI in autism (1-3), we consider that specific brain lesions have not yet been fully clarified. In autism who do not show abnormal brain MRI findings, brain SPECT may be useful for detecting latent impaired lesions. While there have been various studies at rest regarding brain SPECT in autism (including mentally retarded autism) (4-9), there is still some controversy regarding abnormal regional cerebral blood flow (rCBF). There have been few reports on abnormal brain regions in high-functioning autism (HFA) using PET at rest (10, 11) and there has been no previous report using SPECT at rest in HFA. In this report, HFA is defined as autism as diagnosed by DSM-Ⅳ but with an intelligence quotient (IQ) of over 70 (IQ≧70) by the WISC-Ⅲ, Tanaka-Binet, or Suzuki-Binet test, while low-functioning autism (LFA) is defined as autism with an IQ of under 70 (IQ<70). Asperger syndrome is diagnosed by DSM-Ⅳ. Generally, As-perger syndrome is HFA without retarded speech de-velopment. The symptom is influenced by mental re-tardation (MR) in LFA, but not in HFA. Therefore, it is thought that research on impaired brain regions should be performed in HFA rather than LFA. Con-firmation of an abnormal rCBF pattern in HFA may be useful for elucidate of its pathophysiology and a differential diagnosis, such as with attention-deficit / hyperactivity disorder (AD/HD). Therefore, in this study, we examined rCBF using brain technetium-99m-ethyl cysteinate dimer SPECT (99m
Tc-ECD SPECT), and compared the findings in 16 cases of HFA (HFA group) to those in 5 cryptogenic epilepsy patients with normal intelligence (control group) to detect abnormal rCBF patterns in HFA. The analysis of brain SPECT was performed using 3-dimensional stereotactic region of interest (ROI) template (3DSRT)(12). 3DSRT analysis of brain SPECT offers several advantages : [1] 3DSRT is fully automated whole brain ROI analysis software, and there is no dispersion derived from differences in the subject, observer, or facility. The reproducibil-ity is very good. Therefore, an objective visual and quantitative assessment is possible for each segment. [2] Analysis requires only a few minutes. 3DSRT is available within a short period at any facility. This is the first report on SPECT findings in HFA using 3 DSRT.
PATIENTS AND METHODS
The data were reported as mean±standard devia-tion (SD) of several experiments. Differences between mean±SD were considered to be statistically signifi-cance at a value of p<0.05.
The HFA group consisted of 16 cases of HFA (excluding Asperger syndrome). They were all male, with an IQ of 94.7±14.4(range 76 to 126). They had normal brain MRI findings, and had an age of 11.7±1.8(range 9 to 14) years. The control group consisted of1male and 4 females cryptogenic epilepsy patients with normal intelligence. They have no problems in learning at school or mental or behavioral traits. They had normal brain MRI or SPECT findings, and had an age of 9.80±3.3 (range 7 to 15) years. There were no significant differ-ences in the age between the two groups using Stu-dent’s t-test or welch’st-lest. After we obtained informed consent regarding SPECT examination from the subject and the subject’s parents, we examined brain99m
Tc-ECD SPECT in both the HFA and control groups.
SPECT DATA ACQUISITION
After an intravenous drip infusion line was intro-duced, subjects were given an intravenous injection of99m
Tc-ECD, 296∼740MBq, while resting in the su-pine position with their eyes open. SPECT images were acquired 10 minutes after injection using a PRISM 3000(Picker, Ohio, USA) equipped with high-resolution fan-beam collimators. For data acquisition, we used a 64×64 matrix for 24 steps of 120 degrees. The acqui-sition time was 10 seconds per step. A low-pass filter was used for SPECT image reconstruction. Attenuation correction was performed using Chang’s method.
RESULTS
Regarding SPECT data analysis using 3DSRT, the first step in this process is normalization. In normali-zation, the patient’s brain data are combined with those in Talairach’s stereotactic brain atlas. Second, the auto-mated ROI template is placed on the brain. Third, a radioisotope (RI) count is determined for each ROI and each segment, where each segment consists of many ROIs. The template ROI used in 3DSRT is shown in Fig. 1 (12). It consists of 318 ROIs segmented 12 area (A : callosomarginal, 53 ROIs ; B : precentral, 43 ROIs ; C : central, 28 ROIs ; D : parietal, 28 ROIs ; E : angular, 8 ROIs ; F : temporal, 35 ROIs ; G : posterior, 40 ROIs ; H. Ito et al. Brain SPECT in high-functioning autism
Fig. 1. 3DSRT template. The segments are defined as follows: A: callosomarginal, B: precentral, C: central, D: parietal, E : angular, F: temporal, G: posterior, H: pericallosal, I: lenticular nucleus, J: thalamus, K: hippocampus, L: cerebellum. From the inferior right to superior left sections in the Figure correspond to the cranial to caudal horizontal sections in the subject. The left side in the Figure correspond to the right side of horizontal sections in the subject.
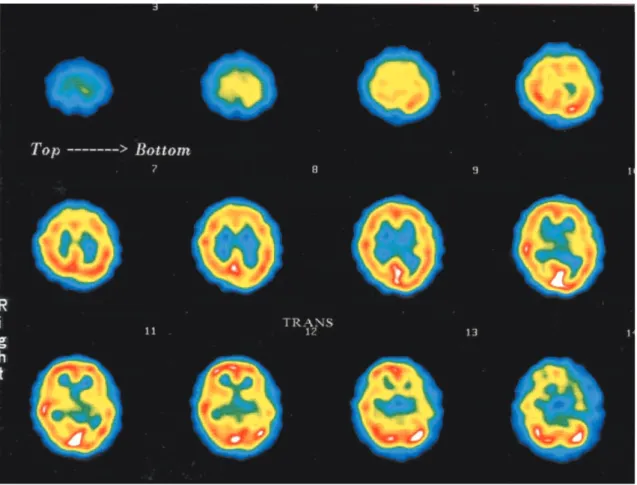
Fig. 2. Example of SPECT data in HFA. These data were obtained from a 13-year-old male. From the superior left to inferior right sections in the Figure correspond to the cranial to caudal horizontal sections in the subject. The left side in the Figure correspond to the right side of horizontal sections in the subject. It looks like left temporal lobe is hypoperfusion relatively, but those are not responsible.
H : pericallosal, 31ROIs ; I : lenticular nucleus, 14ROIs ; J : thalamus, 10 ROIs ; K : hippocampus, 15 ROIs ; L : cerebellum, 13ROIs) on each side, with reference to Brodmann’s area and brain vessel perfusion area. From the inferior right to superior left sections in the Fig.1 correspond to the cranial to caudal horizontal sections in the subject. The left side in the Fig.1 cor-respond to the right side of horizontal sections in the subject. We calculated the ‘relative rCBF (%)’ (RI count of each segment×100 / Sum of RI count of the corre-sponding hemisphere), and compared this value be-tween the two groups (For example, the ‘relative rCBF (%)’ of LC (Left central) was (RI count of LC×100 / Sum of RI count of LA∼LL)). We also calculated the ‘L/R ratio’ (the ‘relative rCBF (%)’ of a segment on the left side / the ‘relative rCBF (%)’ of the corresponding seg-ment on the right side), and compared the value for each segment between the two groups. Furthermore, to detect interhemisphere differences in total rCBF, we calculated the ‘L/R ratio of the whole brain’ (sum of RI count on the left hemisphere/sum of RI count on the right hemisphere), and compared the values be-tween the two groups.
Examples of SPECT data in HFA are shown in Fig. 2, 3. These data were obtained from a 13-year-old male. Regarding Fig. 2, from the superior left to inferior right
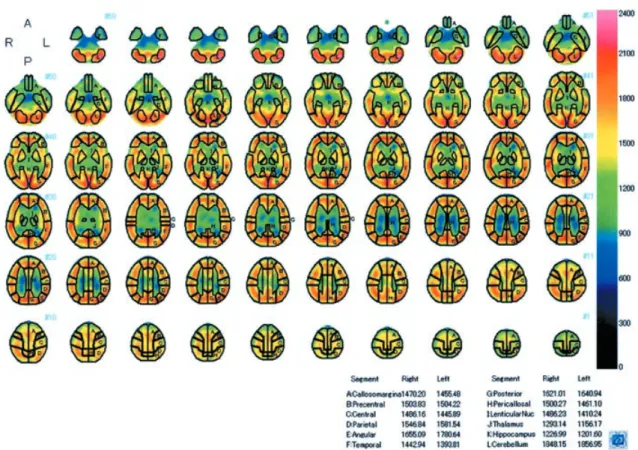
sections in the Figure correspond to the cranial to caudal horizontal sections in the subject. The left side in the Figure correspond to the right side of horizontal sections in the subject. It looks like left temporal lobe is hypoperfusion relatively, but those are not responsible. Regarding Fig. 3, Figure is SPECT data using 3DSRT. From the inferior right to superior left sections in the Figure correspond to the cranial to caudal horizontal sections in the subject. The left side in the Figure cor-respond to the right side of horizontal sections in the subject. Both RI count imaging and RI count of each segment are shown. For example, the ‘relative rCBF (%)’ in LF (left temporal) is 7.79%.
Fig. 4 shows the ‘relative rCBF (%)’, which is the percentage (%) of each segment’s rCBF to the cor-responding hemisphere’s cerebral blood flow. We found a significantly low ‘relative rCBF (%)’ in LF (left temporal) in the HFA group (7.99±0.22%) compared to the control group (8.25±0.23%) using Student’s t-test (p=0.03). Fig. 5 shows the ‘L/R ratio’ and ‘L/R ratio of the whole brain’. There were no significant differ-ences in any segments or in the ‘L/R ratio of the whole brain’ between the two groups using Student’s t-test or Welch’s t-test. We also checked for differences in the ‘relative rCBF (%)’ between segments on the right side and corresponding segments on the left side in
Fig. 3. Example of SPECT data in HFA using 3DSRT. These data were obtained from the same subject as in Fig. 2. From the inferior right to superior left sections in the Figure correspond to the cranial to caudal horizontal sections in the subject. The left side in the Figure correspond to the right side of horizontal sections in the subject. Both RI count imaging and RI count of each segment are shown. For example, the ‘relative rCBF (%)’ in LF (left temporal) is 7.79%.
H. Ito et al. Brain SPECT in high-functioning autism
Fig. 4. Graph of the ‘relative rCBF (%)’ for each segment. The X-axis shows each segment and the Y-axis shows the ‘relative rCBF (%)’. The graphs on the right and left show the mean±SD in the HFA and control groups, respectively. We found a significantly low ‘relative rCBF (%)’ in LF (left temporal) in the HFA group (p=0.03).
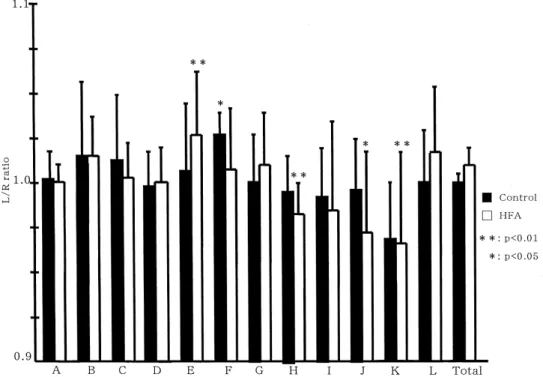
Fig. 5. Graph of the ‘L/R ratio’ for each segment and ‘L/R ratio of the whole brain’. The X-axis shows each segment and the Y-axis shows the ‘L/R ratio’ and ‘L/R ratio of the whole brain’. The graphs on the right and left show the mean±SD in the HFA and control groups, respectively. There were no signifi-cant differences in any segments or in the ‘L/R ratio of the whole brain’ between the two groups using Student’s t-test or Welch’s t-test. However, we also found that the ‘relative rCBF (%)’ was significantly lower in RE (right angular) than in LE (p<0.01), significantly lower in LH (left pericallosal) than in RH (p<0.01), significantly lower in LJ (left thalamus) than in RJ (p=0.01), and significantly lower in LK (left hippocampus) than in RK (p<0.01) in the HFA group, while in the control group, the ‘relative rCBF(%)’ in LF (left temporal) was significantly higher than that in RF (p=0.02) using paired t-test.**and*means p<0.01 and p<0.05, respectively.
each of the HFA and control groups using paired t-test. The ‘relative rCBF (%)’ was significantly lower in RE (right angular)(9.35±0.34%) than in LE (9.60±0.29%) (p<0.01), significantly lower in LH (left pericallosal) (8.40±0.19%) than in RH(8.53±0.16%)(p<0.01), sig-nificantly lower in LJ (left thalamus)(6.54±0.31%) than in RJ(6.75±0.41%)(p=0.01), and significantly lower in LK (left hippocampus)(6.43±0.32%) than in RK(6.67±0.25%)(p<0.01) in the HFA group, while in the control group, the ‘relative rCBF (%)’ in LF (left temporal)(8.25±0.23%) was significantly higher than that in RF (8.06±0.23%)(p=0.02). Furthermore, to detect differences in total rCBF between the left and right hemispheres, we compared the sum of the RI count in the left hemisphere with that in the right hemisphere using paired t-test. There were no significant differences in both the HFA and control groups.
DISCUSSION
Various brain SPECT studies at rest have been re-ported in autism. One rere-ported all region are normal in autism(4), but others reported blood flow decrease in autism at the right lateral temporal and frontal lobes (5), the cerebellar hemisphere and thalamus (6), the laterotemporal and dorso-medio-lateral frontal areas (7), the bilateral frontal, frontotemporal, temporal and temporooccipital regions (8).Thus, there is still some controversy regarding abnormal rCBF in autism. These reports included both LFA (IQ<70) and young autism. Controversy of reported abnormal rCBF in autism may be due to difference of subjects, methods, or technical ground of SPECT data analysis. Recently, bilateral hy-poperfusion in the temporal lobes has been reported in autism using Statistical Parametric Mapping soft-ware (SPM)(9, 13).
A few PET studies at rest have been reported in HFA. One reported left>right anterior rectal gyrus asymmetry with regard to regional cerebral metabolic rate in HFA, as opposed to the normal right>left asymmetry(10). Others reported HFA had a significantly smaller right anterior cingulate gyrus in relative volume on MRI and the bilateral anterior cingulate gyri were metabolically less active(11). However, there is still no information available regarding brain SPECT findings in HFA at rest.
In the present study, we found significant left tem-poral hypoperfusion in the HFA group compared to the control group. However, we found significant left> right perfusion in the temporal region in the control group. Left temporal hypoperfusion in the HFA group
might be due to impairment of the left temporal region or a lack of left>right perfusion in the temporal region. In general, there is a tight correlation between neuron activity and rCBF (14, 15). rCBF decreases with a de-crease in neuron activity, since necessity of regional glucose and its metabolite is decreased. It has been suggested that left temporal hypoperfusion is related to a pathophysiology of the brain in autism. We think that left temporal hypoperfusion is caused by an un-derlying pathology that is also responsible for autistic symptoms. The superior temporal cortex shows ana-tomical connectivity between the frontal lobe, limbic system, parietal lobe, auditory cortex, and visual cortex. Thus, the impairment of neural circuits between the temporal lobe and these connected regions, due to im-pairment of the temporal lobe, may be related to the presence of autism (16). The auditory center (Heschl’s gyrus) (Brodmann’s area41) processes the recognition of sounds and language. Wernicke’s area (Brodmann’s area 22) processes language comprehension. If impair-ment of the auditory center and Wernicke’s area in the dominant hemisphere exists, the perception and recognition of sound and language might also be im-paired, which results in the symptoms of autism, es-pecially impaired communication. The temporal lobe also plays a role in the processing of visual information. One reported that the posterior superior temporal sulcus was activated during viewing of biological motion (17). Others reported that perception of face identity was me-diated more by regions in the inferior occipital and fusi-form gyri, and perception of eye gaze was mediated more by regions in the superior temporal sulci (18). It has been suggested that autism is not good at the percep-tion of face and eye gaze.
In the present study, there were no significant dif-ferences in the ‘L/R ratio’ and ‘L/R ratio of the whole brain’ between the two groups. On the other hand, the HFA group had significant right<left perfusion in the angular region and significant left<right perfusion in the pericallosal, thalamus, and hippocampus region. These results may indicate the abnormal laterality of neural network. High function of brain is due to asso-ciation of multiple brain area through neural network. For example, concerning the angular region, it shows anatomical connectivity between contiguous regions, such as the visual area and Wernicke’s area, andis thought to play a role in the analysis or integration of informa-tion from these regions. Impairment of parietal region in minor hemisphere can cause simultagnosia and prosopagnosia, and the same area also play a role in the perception of eye gaze(18). Significant right<left perfusion in the angular region may be related to bi-H. Ito et al. Brain SPECT in high-functioning autism
ased perception, which results in the symptoms of autism.
The present study was limited in that there were only 5 cases in the control group, which consisted of 1 male and 4 female patients with cryptogenic epilepsy for ethical reasons. With regard to controls in a SPECT study, normal controls are difficult to obtain for ethical reasons. Controls in previous SPECT studies on LFA have included language disorder(4), AD/HD and MR (7, 8). However, in a brain SPECT study in HFA, a good potential control would seem to be a normal subject. For a more rigorous study of brain SPECT findings in HFA, we should probably use normal volunteers. Our results suggest that significant hypoperfusion in the left temporal region due to an unidentified un-derlying brain pathology and abnormal laterality in the angular, temporal (lack of right<left perfusion), peri-callosal, thalamus, and hippocampus regions may in-fluence the symptoms of autism. Even though HFA had normal brain MRI findings, brain SPECT using 3DSRT could easily show these results.
ACKNOWLEDGEMENTS
We thank Kan-ichi Kino of Daiichi Radioisotope Laboratory for his technical support regarding 3DSRT, and Kazuo Sato, Akihiko Fujita, and Yamato Kunikane for their assistance with SPECT.
REFERENCES
1. Abell F, Krams M, Ashburner J, Passingham R, Friston K, Frackowiak R, Happe F, Frith C, Frith U: The neuroanatomy of autism: a voxel-based whole brain analysis of structural scans. Neuroreport 10 : 1647-1651, 1999
2. Hendren RL, De Backer I, Pandina GJ : Review of neuroimaging studies of child and adolescent psychiatric disorders from the past 10 years. J Am Acad Child Adolesc Psychiatry 39 : 815-828, 2000
3. Courchesne E, Karns CM, Davis HR, Ziccardi R, Carper RA, Tigue ZD, Chisum HJ, Moses P, Pierce K, Lord C, Lincoln AJ, Pizzo S, Schreibman L, Haas RH, Akshoomoff NA, Courchesne RY: Un-usual brain growth patterns in early life in patients with autistic disorder: an MRI study. Neurology 57 : 245-254, 2001
4. Zilbovicius M, Garreau B, Tzourio N, Mazoyer B, Bruck B, Martinot JL, Raynaud C, Samson
Y, Syrota A, Lelord G : Regional cerebral blood flow in childhood autism : a SPECT study. Am J Psychiatry 149 : 924-930, 1992
5. George MS, Costa DC, Kouris K, Ring HA, Ell PJ : Cerebral blood flow abnormalities in adults with infantile autism. J Nerv Ment Dis 180 : 413-417, 1992
6. Ryu YH, Lee JD, Yoon PH, Kim DI, Lee HB, Shin YJ : Perfusion impairments in infantile autism on technetium-99m ethyl cysteinate dimer brain single-photon emission tomography : comparison with findings on magnetic resonance imaging. Eur J Nucl Med 26 : 253-259, 1999
7. Hashimoto T, Sasaki M, Fukumizu M, Hanaoka S, Sugai K, Matsuda H : Single-photon emission computed tomography of the brain in autism : effect of the developmental level. Pediatr Neurol 23 : 416-420, 2000
8. Kaya M, Karasalihoglu S, Ustun F, Gultekin A, Cermik TF, Fazlioglu Y, Ture M, Yigitbasi ON, Berkarda S : The relationship between
99m- Tc-HMPAO brain SPECT and the scores of real life rating scale in autistic children. Brain Dev 24 : 77-81, 2002
9. Ohnishi T, Matsuda H, Hashimoto T, Kunihiro T, Nishikawa M, Uema T, Sasaki M : Abnormal regional cerebral blood flow in childhood autism. Brain 123 : 1838-1844, 2000
10. Siegel BV Jr, Asarnow R, Tanguay P, Call JD,
Abel L, Ho A, Lott I, Buchsbaum MS : Regional cerebral glucose metabolism and attention in adults with a history of childhood autism. J Neu-ropsychiatry Clin Neurosci 4 : 406-414, 1992 11. Haznedar MM, Buchsbaum MS, Metzger M,
Solimando A, Spiegel-Cohen J, Hollander E : Anterior cingulate gyrus volume and glucose metabolism in autistic disorder. Am J Psychiatry 154 : 1043-1045, 1997
12. Takeuchi R : Fully automated ROI analysis
soft-ware for the brain ; 3 DSRT. Nippon Hoshasen Gijutsu Gakkai Zasshi 59(in Japanese) : 1462-1474, 2003
13. Zilbovicius M, Boddaert N, Belin P, Poline JB,
Remy P, Mangin JF, Thivard L, Barthelemy C, Samson Y : Temporal lobe dysfunction in child-hood autism : a PET study. Am J Psychiatry 157 : 1988-1993, 2000
14. Rapoport SI, Ohata M, London ED : Cerebral
blood flow and glucose utilization following open-ing of the blood-brain barrier and duropen-ing matu-ration of the rat brain. Fed Proc 40 : 2322-2325, 1981
15. Kaiser MG, During MJ : Combining laser Doppler
flowmetry with microdialysis : a novel approach to investigate the coupling of regional cerebral blood flow to neuronal activity. J Neurosci Methods 60 : 165-173, 1995
16. Boddaert N, Zilbovicius M : Functional
neuroi-maging and childhood autism. Pediatr Radiol 32 : 1-7, 2002
17. Grossman ED, Blake R : Brain activity evoked
by inverted and imagined biological motion. Vision Res 41 : 1475-1482, 2001
18. Hoffman EA, Haxby JV: Distinct representations
of eye gaze and identity in the distributed human neural system for face perception. Nat Neurosci 3 : 80-84, 2000
H. Ito et al. Brain SPECT in high-functioning autism