Original
(
J
Tokyo Wom Me吋d U凶 84 (Extra 3羽)E389~ E396 (ρ2014) JChanges i
n
Body C
o
m
p
o
s
i
t
i
o
n
a
f
t
e
r
G
a
s
t
r
e
c
t
o
m
y
:
Comparison between D
i
s
t
a
l
Gastrectomy and T
o
t
a
l
Gastrectomy
Ryusuke Y AMAGUCHI,
Akiyoshi SESHIMO,
Kunitomo MIY AKE,
Motonobu SAITO and Shingo KAMEOKA
Department of SurgeryII, Tokyo Women's Medical University (Accepted October 14,2014)
“Sarcopenia" refers to a loss of muscle mass with aging, and can occur with decreased nutritional status after gastrectomy. This study measured body composition in 145 patients using bioelectrical impedance analysis (BIA) after distal gastrectomy (DGR group, n
=
108) or tota1gastrectomy (TGR group, n=
37) for gastric cancer. Evalu -ated parameters included pre-and postoperative body weigh,tfat mass, and body cell mass (BCM), which reflects nutritional status and correlates with skeletal muscle. In addition, patients with postoperative follow-up<
24 months were defined as“early-term", while those with follow-upと24months were “latter-term". Body weight decreased after gastrectomy, decreasing more after TGR than after DGR.BCM was also lower in both DGR and TGR groups than in healthy controls, but tended to be even lower in the TGR group. In the TGR group, BCM tended to be lower in the latter-term group, and patients with low BCM were also significantly more frequent.In addition, fat mass was lower than in healthy controls, but remained significantly higher in the latter-term group. In the DGR group, BCM and fat mass did not differ significantly between early-and latter-term groups. These re -sults suggest that sarcopenia may more readily progress long-term after TGR than after DGR.Key W ords: bioelectrical impedance analysis (BIA), nutritional status, gastrectomy, BCM, sarcopenia
Introduction
Sarcopenia has become a common term in refer -ring to the loss of musc1e mass that occurs with ag -ing. The European W orking Group on Sarcopenia in Older People (EWGSOP)ll in 2010 c1assified sarco -penia into primary sarcopenia, associated with ag -ing, and secondary sarcopenia, due to causes such as malignant tumors, organ dysfunction, and malnu
-trition. Decreased nutritional status after gastrec -tomy is a well-known problem, but measurement of body composition as a method of assessment has not been fully investigated. Bioelectrical impedance analysis (BIA) measures electrical resistance in the body and offers a convenient and noninvasive method for evaluating body composition. Research with BIA started during the 1960s2ll3, and now with the development of multifrequency and multipolar tactile-electrode impedance methods, measurement accuracy has improved dramatically4l-6l. The pre
-sent study measured the body cell mass (BCM) and fat mass of postgastrectomy patients using the BIA method and investigated di妊'erencesin body com-position characteristics after distal gastrectomy (DGR) and total gastrectomy (TGR).
Materials and Methods
A retrospective investigation of 145 patients who had undergone gastrectomy for gastric cancer at our department and who underwent body composi -tion analysis between September 2012 and
J
anuary 2013 during postoperative follow-up was conducted. Patients were divided into a distal gastrectomy group (DGR group, n=
108) and a total gastrectomy group (TGR group, n=
37), and the groups were compared. Body composition analysis was per -formed using an InBody 720 system (Biospace,Tokyo,
J
apan). This body composition analyzer fea -tures multifrequency analysis, body segment meas-uremen,tand eight-point tactile electrodes, and itTable 1 BCM and fat mass in healthy controls (Data provided by Biospace Co.) Women 20s (n=327) 30s (n=201) 40s (n = 200) 50s (n = 151) 60s (n = 273) 70s + (n = 191) Fat mass (kg) 14.8土4.86 16.0:t5.34 18.1:t5.18 20.3:t5.36 21.2:t5.91 19.3:t6.41 BCM (kg) 25.8:t2.45 25.5:t2.64 25.5:t2.49 24.8:t2.85 23.5:t2.58 22.2:t2.36 Men 20s (n=441) 30s (n = 343) 40s (n=288) 50s (n= 164) 60s (n = 116) 70s +(n=71) Fat mass (kg) 11.9:t6.10 15.0:t5.79 16.3:t5.07 16.2:t4.44 16.7土5.46 15.8:t5.12 BCM (kg) 37.8士5.07 37.1 :t4.38 36.5:t4.21 34.4:t4.14 33.1:t4.15 29.5:t3.77 Binog dyan cIonmBpOo〈sitionby sex and age in healthy East Asian controlsas measured by bioelectうvriicaatiloinm-pedance analysis us -dy720 body composition analyzer. Data are presented as mean:tstandard de delivers highly accurate and reproducible body composition measurements7 )8).The InBody720 uses BIA to obtain quantitative data for five compo-nents: intracellular water, extracellular water, pro -tein, fat, and mineral conten
t
.
The BCM is calcu -lated based on body weight minus extracellular components, in other words, as protein plus intra -cellular water conten.
t
The present study investi -gated body weight before and after surgery, as well as fat mass and BCM measurements obtained from body composition analysis. BCM is a concept pro -posed by Moore et aL involving regulation of body metabolism, and it reflects the nutritional status of the body 9). Since body composition is affected byage and sex, statistical analyses in the present study were based on BCM and fat mass values for each patient calculated as proportions of the mean values for healthy controls (Table 1) by age and sex. Patients with aと5%reduction in the BCM from that in healthy controls were defined as having a “low BCM" and were added to the analysis. In addi -tion, patients with postoperative follow-up
<
24 months were defined as the“short-term group,while those with follow-up三24months were the “long-term group"; these groups were also com-pared. Statistical analysis was performed using JMP Ver. 10.0.2, and the Wilcoxon signed-rank test or Chi-square test were used for comparisons be -tween the DGR and TGR groups and between the short- and long-term groups. Comparison with healthy controls was performed using Student's
t
-test with the healthy control data in Table 1 fitted to a normal distribution. Significance was set at p<
0.05. The study was approved by the ethics reviewboard of the university (Approval No. 2826-R), and
verbal consent for participation was obtained from all patients. No patients declined to participate.
Results
1.Preoperative/ postoperative changes in body weight
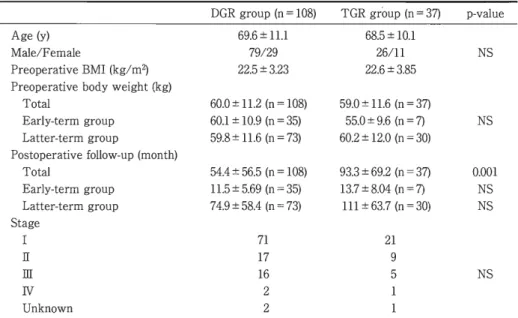
Table 2 summarizes patient characteristics. Pa -tient age, sex, preoperative body weigh preopera,t 聞 tive B M,Iand gastric cancer stage did not differ sig -nificantly between the TGR and DGR groups. Post -operative follow-up was significantly longer in the TGR group, but after classification into short-and long-term groups, the duration of postoperative follow-up did not differ significantly between the TGR and DGR groups.
Table 3 shows postoperative changes in body weigh
t
.
A comparison of pre-and postoperative body weights showed a significant decrease in body weight after surgery in both the TGR and DGR groups. The percentage reduction in body weight was significantly larger in the TGR group than in the DGR group.2. BCM and fat mass
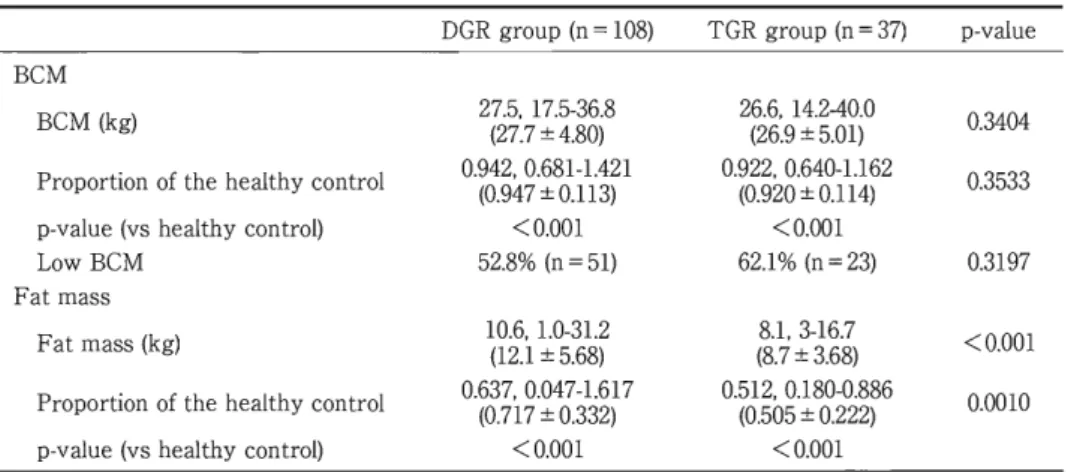
Table 4 shows the results of body composition analysis. The mean BCM as a proportion of the healthy control mean BCM was 0.947:t0
.
1
13 in the DGR group and 0.920:t0.
1
14 in the TGR group. Both were significantly lower than in healthy con -trols. The percentage of patients with a low BCM was more than half in each group, at 52.8% in the DGR group and 62.
1
%
in the TGR group. The pro -portion with a low BCM tended to be higher in the TGR group, but no significant difference was seen between surgical procedures. Fat mass was signifi-Table 2 Characteristics ofthe 145patients DGR group (0 = 108) TGR group (0 = 37) Age (y) 69.6:t11.1 68.5:t10.1 Male/Female 79/29 26/11 Preoperative BMI (kg/m2) 22.5:t3.23 22.6:t3.85 Preoperative bodyweight(kg) Total 60.0:t11.2 (0 = 108) 59.0:t11.6 (0 = 37) Early-term group 60.1:t10.9 (0 = 35) 55.0:t9.6 (0 = 7) Latter-term group 59.8:t11.6 (0 = 73) 60.2:t12.0 (0 = 30) Postoperative follow-up (mooth) Total 54.4:t56.5 (0 = 108) 93.3:t69.2 (0 = 37) Early-term group 11.5 :t5.69 (0 = 35) 13.7土8.04(0=7) Latter-term group 74.9:t58.4(0= 73) 111:t63.7 (0 = 30) Stage I 71 21 E 17 9 E 16 5 N 2 Uokoowo 2 p-value NS NS 唱 EA
o
s
s
ω N N NS Comparisooof the patieots'characteristicsfor the TGR aodDGR groupsshows00sigoificaot differences regarding patientage, sex, preoperative bodyweight.preoperative BMI.aod gas -triccancer stage.Postoperativefollow-upissignificantlylonger io the TGR group, butafter classifyiog patieots ioto early-andlatter-termgroups, duration of postoperative follow-up did oot differ significaotly between the TGR and DGR groups.Table 3 Comparison of body weight between the DGR and TGR groups Pre-operation Post-operatioo p-value Body weight(kg) DGR group 5(96,1.0.03:4t.18-1.824).1 53(.559.,13:2t.51-0.758).6 <0.001 TGR group 58(.592., 03:8t.21-1.846).5 50(.550..731:t.19-.70)3.4 <0.001 DGR TGR p-va1ue Perceotage reduction 93.5:t11.4% 85.7:t12.9% <0.001 Data are expressedasmediao, mioimum-maximum (and mean :tSD). Postoperative body weight is sigoificaotly decreased in both the TGR aod DGR groups. Furthermore, the percentage reductioo in body weightissig -oificaotlygreaterintheTGR group than in the DGR group.
cantly lower in the TGR group than in the DGR group. Fat mass, as a proportion of mean healthy control values, was 0.717:t0.332in the DGR group and 0.505:t0.222in the TGR group. Fat mass in the TGR group was about half that in healthy controls.
3. Comparison of short-and long-term groups Table 5 summarizes the comparisons between the short-and long-term groups for each surgical procedure. For the DGR group, a comparison be -tween short-and long-term groups showed no sig -nificant differences in body weigh,t fat mass, or
BCM. However, inthe TGR group, although the comparison between short-and long-term groups found no significant difference in body weigh,tfat mass was significantly higher in the long-term group. In addition, BCM, as a proportion of the healthy control mean, tended to be lower in the long-term group (0.909:t0.120) than in the short -term group (0.967:t0.070). The proportion of pa -tients with low BCM was significantly higher in the long-term group (70.0%)than in the short-term group (28.6%).
Table 4 Comparison of BCM and fat mass between theDGR and TGR groups DGR group (n = 108) TGR group (n = 37) p-value BCM BCM (kg) 27(.275. .7 1:7t.54.-3806).8 26(.266. 1.9 :4t.52-.0410).0 0.3404 Proportion of the healthy control 0.(904.29. 470.:6t801.-11.134)21 0.9(02.2.9 020.6:t400.1・1.114)62 0.3533 p-value (vs healthy control) <0.001 <0.001 LowBCM 52.8% (n = 51) 62.1 % (n = 23) 0.3197 Fat mass Fat mass (kg) 1(01.26..1 1:.t05-.3168.)2 (88,1..73-16.7 <0.001 土3.68) Proportion of the healthy control 0.(603.77,170.047-1.617 0.512. 0.180・0.886 0.0010 :t0.332) (0.505:t0.222) p-value (vs healthy control) <0.001 <0.001
Data are expressed as median. minimum-maximum (and mean :tSD). Body composition analysis shows that BCM and fat mass are significantly lower in both the TGR and DGR groups com -pared to healthy controls. BCM tends to be lower in the TGR group than in the DGR group. al -though this di旺erenceis not significant.Fat mass is significantly lower in the TGR group.
Table 5 Comparison of early-and latter-term groups
early司termgroup latter-term group p町value DGR n=35 n=73 Body weight (kg) 5(4.575..440:t.49-.5783).6 63(.547..932:t.51-17.30).8 0.997 Fat mass (proportion of the healthy control) 0.5(705..65 09.1:t709.-13.084)13 0.(608.574, 50.:0t407.-13.426)17 0.198 BCM (proportion of the healthy control) 0.9(06.59.530.:7t803.-108.31)52 0.9(03.29.405.681-1.424 0.414 土0.126) Low BCM 42.9% (n = 15) 57.5% (n = 42) 0.153 TGR n=7 n=30 Body weight (kg) 46(.459..5 43:.t38-.2650).7 52(51.2.. 301.1-73.4 0.485 土9.28) Fat mass (proportion of the healthy control) 0.3(01.63. 230.179-0.599 0.556. 0.180-0.886 0.015 :t0.136) (0.548:t0.2189) BCM (proportion of the healthy control) 0.9(074.9.6 07.852-1.045 0.912. 0.640-1.162 0.201 :t0.070) (0.909土0.120) LowBCM 28.6% (n=2) 70.0% (n = 21) 0.042 Data are expressed as median. minimum-maximum (and mean :tSD). In the DGR group. no significant di旺erencesare observed between the early-and latter-term groups for any parameters. Conversely. in the TGR group. fat mass is significantly higher. and there are significantly more low-BCM patients in the latter-term group.
Discussion
1.Body cell mass
dard range had a higher risk of serious infections and death post-transplan
t
.
The usefulness of BCM measurements has also been reported in many con -ditions. such as head and neck cancer, gastrointesti -nal disease, chronic renal failure, and obesityll)-16).BCM measurements are conventionally based on total body potassium, and BCM can also be meas-ured by
4
0
K radioisotope counting. However. BIA, which delivers superior convenience, noninvasive由ness, and speed. has come into use in recent years. BCM reflects nutritional status and has recently
been reported as a useful parameter for assessing various diseases. Kawaguchi et al10
) reported that
BCM as a percentage of body weight was about
60%
in healthy adults. but only5
4
.
3
%
:t6
.
9
%
in pa-tients with chronic gastrointestinal disease and5
0
.
9
%
:t4
.
5
%
in patients with liver cirrhosis. Kaido et alll) reported tha,tin liver transplant patients.
-2
.
Postgastrectomy changesThe present study showed that body weight de -creased after gastrectomy. In particular, body weight decreased more after TGR than after DGR. BCM was also lower in both the DGR and TGR groups than in healthy controls, but tended to be even lower in the TGR group. This indicates that malnutrition is more likely after TGR.In addition, fat mass was significantly lower in the TGR group. Malnutrition and reduced fat mass are known to oc -cur after TG,Rprimarily due to decreased gastric reservoir function. According to N oguchi e抗taF
ペ
7 tary caloric intakes in postoperative gastric cancer patients are1
,3
2
6
:t4
4
2
kcal/ day and1
,0
2
0
:t3
9
1
kcal/ day in DGR and TGR patients, respectively. These values, particularly in TGR patients, are lower than normal values in healthy adults. Body fat provides a stored energy source within the body; therefore, when caloric intake decreases, fatsare consumed, and body fat mass consequently de
-creases. Changes in ghrelin levels have recently been proposed as another cause of postgastrectomy malnutrition and reduced fat mass. Ghrelin is a hor -mone that stimulates the appetite and promotes fat accumulation; however, serum ghrelin levels are low from the early postoperative stage in postop -erative gastric cancer patients81)l9).Meanwhile, ghre -lin decreases are modest in DGR patients compared to TGR patients20 Thus.) , TGR patients are thought to be particularly susceptible to malnutrition and reduced fat mass. The present findings were consis -tent with those of previous reports.
3
.
Long-term changes In the present study, in the TGR group, BCM tended to be lower in the long-term group, and the proportion of patients with low BCM was also sig -nificantly higher in the long-term group. In addition, fat mass was lower than in healthy controls, but it was still significantly higher in the long-term group. On the other hand, in the DGR group, BCM and fat mass did not significantly differ between the short -and long-term groups. This finding suggests tha,t over a long period in the TGR group, fat mass, which causes obesity, again increased, whereas BCM, a nutritional marker, further decreased. In other words, body composition over a long-term pe -riod is more likely to show changes associated with malnutrition after TGR than after DGR. Although the present study was unable to inves -tigate the causes of this di旺erencein long-term body composition depending on gastrectomy type, there are two likely mechanisms: the effects of re岡 construction method, and increased intestinal pH.With Roux-en-Y reconstruction, which is commonly
used in TGR patients, duodenal bypass results in in -sufficient mixing of food with bile and pancreatic juices, and nutrient absorption decreases2山2).With regard to intestinal pH, the absence of gastric acid secretion after TGR causes intestinal pH to rise, which leads to overgrowth of enteric bacteria and changes in small intestinal mucosal function, impair -ing absorption23) 24) . By these mechanisms, absorption of essential nutrients is prevented in TGR patients, who are therefore more susceptible to long-term malnutrition than DGR patients.
The present study compared a short-term and a long-term group with less than 2 years or 2 or more years of follow-up, respectively, after gastrectomy for gastric cancer and investigated long-term changes in body composition. Although postgas開 trectomy body composition analyses using BIA have been reported却 す ) ,the majority of those stud -ies conducted measurements within 2 years after surgery, and few examined long-term changes after
2 years. To the best of our knowledge, no studies of postgastrectomy BCM have been conducted to date in or outside
J
apan, and the present study thus of -fers new insight regarding postgastrectomy nutri -tional status. The present study did not analyze preoperative body composition. Conventionally, comparisons of pre-and postoperative data are required when in -vestigating surgery-related changes; however, this necessitates an extensive study period. In the pre -sent study, existing values for healthy adults wereused as control values. The present method was also used by Nakahara et a128), who conducted a
comparative investigation of BMI measurements and blood test results in
1
0
3
patients with a history of gastrectomy classified into five groups based on1ength of time since surgery. With regard to post -gastrectomy patient characteristics, the present in -vestigation had sufficient va1idity. However, changes in postgastrectomy nutritiona1 status in the present study were not rigorous1y eva1uated. In addition, in terms of the background characteristics of the DGR and TGR group patients, postoperative follow-up was 10nger in the TGR group. This was at -tributed to a pro1onged observation period in the TGR group due to reasons such as more time being needed for postoperative recovery and 10ng-term ma1nutrition. In other words, there may have been se1ection bias between theDGR and TGR groups in the present study. Based on the above, a prospec -tive study in which the preoperative BCM is meas-ured and 10ng-term rates of change in BCM are measured is warranted in the future.
Sarcopenia has received increasing attention in recent years, and sarcopenia as proposed by Rosen-berg in
1
9
8
9
29) now has severa1 definitions. Sarco -penia as a concep,ta1though not unified, generally refers to a “10ss of muscle mass that occurs with ag -ing" in e1derly patients. In addition, Baumgartner in 2000described“sarcopenic obesity"30), which, in ad -dition to a 10ss of muscle mass. a1so includes an in -crease in fat mass. Sarcopenic obesity is included within the concept of sarcopenia, but indicates fur -ther progression of sarcopenia due to the influence of cytokines produced by fat tissue3032). Based on the present resu1ts, over a 10ng-term period after TG,R BCM tended to decrease. and fat mass tended to in -crease. Because BCM corre1ates strong1y with ske1eta1 muscle33), the present resu1ts suggest that sarcopenia may more readily progress 10ng-term af -ter TGR than after DGR.Given the increasing num-ber of e1derly postgastrectomy patients, further studies are needed.Conclusion
Measurement of body weight in patients after gastrectomy has traditionally been wide1y used to conveniently eva1uate postoperative nutritional status. However, the present study demonstrates that the changes in body composition occurring in postgastrectomy patients may be overlooked by re -1ying on changes in body weight a1one. To more ac
-curate1y eva1uate nutritiona1 status after gastrec -tomy, body composition must be measured and ana -1yzed. Long-term changes in body composition are 1ess 1ike1y after DG whereas body c,R omposition af -ter TGR is more 1ike1y to change over time, more readily 1eading to ma1nutrition after a 10ng period. BIA is superior in terms of convenience, noninva -siveness, and speed, and it appears usefu1 for eva1u -ating nutritiona1 status in postgastrectomy patients. The authors have no conflicts of interest to declare. References 1)Cruz-Jonetoft AJ, Baeyens JP, Bauer JM et al: Sarcopenia European consensus on definition and diagnosis: Report of the European Working Group on Sarcopenia in Older People. Age Ageing 39: 412 -423,2010 2) Thomasset A: Measurement of the extracellular fluid volume by the electro-chemical method. Biophsical significance of 1 kilocyc1e impedance of the human body. Lyon Med 214: 131-143, 1965 3) Hoffer EC, Meador CK, Simpson DC: Correlation of whole-body impedance with total body water volume. J Appl Physio127: 531-534,1969 4) Miyake N, Tanaka A, E郡lchiM et al: Reference Deta of Multi Frequencies Bioelectric Impedance Method in Japanese. Anti-Aging Med 6 (3): 10-14, 2009 5) Bedogni G, Malavolti M, Severi S et al: Accuracy of an eight聞point tactile-electrode impedance method in the assessment of total body water. Eur J Clin Nutr 56: 1143-1148,2002 6) Shafer KJ, Siders W A, J ohnson LK et a:lValidity of segmental multiple-frequency bioelectrical im -pedance analysis to estimate body composition of adults across a range of body mass index. Nutrition 25:25-32,2009 7)Ling CH, de Craen AJ, Slagboom PE et al: Accu -racy of direct segmental multi-frequency bioimped -ance analysis in the assessment of total body and segmental body composition in middle-aged adult population. Clin Nutr 30: 610-615, 20日 8) Jensky-Squires NE, Dieli・Conwright CM, Ros -suello A et al: Validity and reliability of body com -position analysers in children and adults. Br J Nutr 100:859-865,2008
9) Moore FD, Olesen KH, McMurray JD et al:The body cell mass and its supporting environment. In Body Composition in Health and Disease, pp173 -223, W.B.Saunders, Philadelphia (1963) 10) Kawaguchi T, Taniguchi E, Itou M et al: Body cell mass is a useful parameter for assessing malnu -trition and severity of disease in non-ascitic cir -rhotic patients with hepatocellular carcinoma or esophageal varices. Int J Mol Med 22: 589-594, 2008 11) Kaido T, Mori A, Oike F et al: Impact of pretrans
-plant nuturitional status in patients undergoing transplantation. Hepatogastroenterology 57 (104): 1489-1492,2010
12) Kaido T, Mori A, Ogura Y et a:lPre-and pe -rioperative factors a宜ectinginfection after living donor liver transplantation. Nutrition 28: 1104-1108, 2012 13) Bozzetti F: Nutrition support in patients with can -cer.InArtificial Nutrition Support in Clinical Prac -tice, pp639-680, Greenwich Medical Media, London, San Francisco (2001)
14) Malecka-Massalska T, Smolen A, Morshed K: Extracellular-to-body cell mass ratio and subjective global assessment in head-and-neck cancers. Curr Oncol 21: e62-e66, 2014
15) Friedrich AE, Damms・MachadoA, Meile T et al: Laparoscopic sleeve gastrectomy compared to a multidisciplinary weight loss program for obesity -effects on body composition and protein status. Obes Surg 23 (12): 1957-1965,2013
16) Hyun SH, Choi JY, Cho JH et al: Assessment of fluid and nutritional status using multifrequency bioelectrical impedance analysis in peritoneal dialy -sis patients. Blood Purif 37: 152-162,2014
17) No郡lchiY, Tsuburaya A, Makino T et al: Meta
-bolic alterations in totally gastrectomised patients -caloric intake and energy consumption. Asian J Surg 15: 97-102,1992
18) Seto Y, Miura H, Wada 1 et al: What is ghrelin for gastric cancer? J pn J Cancer Chemother 37 (8): 1429-1435,2010
19) Takachi K, Doki Y, Ishikawa 0 et al: Postoopera -tive ghrelin lebels and delayed recovery from body weight loss after distal or total gastrectomy. J Surg Res 130 (1): 1-7, 2006
20) Joen TY, Lee S, Kim HH et al: Changes in plasma ghrelin concentration immediately after gastrecto -myin patients with early gastric cancer. J Clin En -docrinol Metab 89: 5392-5396, 2004 21)Walthrer B, Clementsson C, Vallgren S et al: Fat malabsorption in patients before and after total gastrectomy, studied by the triolein breath test. Scand J Gastroentero124: 309-314,1989 22) Momose R: Study of bone metabolism, intestinal absorption and anemia in long course after total gastrectomy. Jpn J Gastroenterol Surg 24 (3): 779 -787,1991 23) Ishibashi Y, Kashiwagi H: Postgastrectomy meta -bolic bone disease. Clin Gastroentero124: 1457-1463, 2009 24) Tsujimono H, Ichikawa T: Nutrition disorders in postgastretcomy patients. Clin Gastroenterol 24: 1451-1456,2009
25) Abdiev S, Kodera Y, Fujiwara M et al: Nutritional recovery after open and laparoscopic gastrecto -mies. Gastric Cancer 14: 144-149,2011 26) Kiyama T, Mizutani T, Okuda T et al: Postopera -tive changes in body composition after gastrec -tomy. J Gastrointest Surg 9: 313-319, 2005 27) Hayashi M: Significance of bioelectrical impedance analysis (BIA) for gastrointestinal surgery. Med J Kinki Univ 20 (2): 211-222,1995
28) N akahara K, Kanetaka T, Adachi A et al: The nutritional e旺ectsof parietial gastrectomy more than 20 years after surgery. Teishin Igaku 43: 681 -685, 1991 29) Rosenberg IH: Summary comments. Am J Clin Nutr 50: 1231-1233, 1989 30) Baumgartner RN: Body composition in healthy ag -ing. Ann NY Acad Sci 904: 437-448, 2000 31)Kohara K: Sarcopenic obesity in aging population: current status and future directions for research. Endocrine 45 (1): 15-25, 2014 32) Vincent HK, Raiser SN, Vincent KR: The aging musculoskeletal system and obesity-related consid -erations with exercise. Aging Res Rev 11 (3): 361 -373,2012
33) Kaido T, Uemoto S: Direct segmental multifre -quency bioelectrical impedance analysis is useful to evaluate sarcopenia. Am J Transplant 13: 2506-2507,2013
胃切除後の体成分の変化一幽門側胃切除と胃全摘を比較してー 東京女子医科大学医学部外科学(第2)講座 ヤマグチ リュウスケ セ シ モ アキヨシ ミヤ ケ クニトモ サイトウ モトノプ カメオカ シ ン ゴ 山 口 隆 介 ・ 瀬 下 明 良 ・ 三 宅 邦 智 ・ 斉 藤 元 伸 ・ 亀 岡 信 悟 胃切除後に低栄養を認めることは,以前より知られている.また,加齢に伴う筋肉量の減少という「サルコペ ニア」の概念は,現在注目を集めている.今回我々は,当科で、胃切除を行った患者に対して生体電気インピーダ ンス法を用いた体成分分析を行い,胃切除後患者の体成分の特徴を検討した対象は胃癌に対して当科で幽門側 胃切除, もしくは胃全摘を施行した患者