The Creation and Initial Validation of a
Japanese Serial Nonword Recognition Test
Robert J. Kerrigan
要旨:
The purpose of this study was to validate a Japanese serial nonword recognition (SNWR) test to be used as a measurement for phonological short-term memory (PSTM). Previous researchers who have used such tests in their studies have rarely reported validation attempts, which call in to question whether such instruments accurately measure PSTM. In this study, 89 university students took Japanese and English versions of the SNWR test to determine whether they reliably measure the construct of PSTM and which of the two instruments is a more reliable instrument of PSTM. The data was analyzed using Rasch analysis. The results of the study revealed that neither instrument was a reliable indicator of PSTM in its current form. The biggest issue was ceiling effects in that many participants were answering many items correctly. Future versions of both instruments need to have more difficult-to-answer items to accurately validate the instruments, to determine whether these instruments accurately measure the construct of PSTM, and to be used in future studies.
キーワード:
Working memory, phonological short-term memory, serial nonword recognition test, Rasch analysis, instrument validation
The construct of working memory (WM) and one of its slave-systems, phonological short-term memory (PSTM) have long been associated with language learning. Many studies have used various instruments to capture and measure these constructs and use them to make conclusions about how people learn language. However, there have been few studies in English that have employed any PSTM instrument on Japanese participants. This study is an initial attempt at validating a recently created Japanese serial nonword recognition (SNWR) test and compare it to a well-established English version of the test. This paper will begin with a definition of WM and PSTM, followed by a description of the instruments and the context of the study, then proceed with the analysis of the results, and finish with a discussion of the results and future considerations for the instruments.
Working Memory and Phonological Short-term Memory
Prior to the conceptualization of WM, human memory systems were thought to be comprised of what is known as the modal model, which assumed that the processing and storage of information was a unidirectional process. Information would first be received into the short-term memory (STM), which is of limited capacity and depending on how long information spent in STM, would then be transferred to the long-term memory (LTM) (Atkinson & Shiffrin, 1968). However, studies on patients with neurological impairments exemplified the limited scope of the modal-model. One such study was that conducted with P.V. (Baddeley, Papagno, & Vallar, 1988; Vallar and Baddeley, 1984), an Italian native who had suffered a left-hemispheric stroke and showed signs of impairment in auditory memory span. Baddeley et al. conducted a series of experiments with PV using lists of nonwords and paired associates of words and nonwords. They found that PV was severely impaired for any of the nonword tasks, but she showed some instances of learning for known-word paired associates even though it was at a much slower pace than the control subjects. Furthermore, when presented with visual stimuli, PV showed no signs of impairment, which led Baddeley at al. to conclude that visual and aural material are stored separately in memory and the concept of STM is too limiting. These studies helped Baddeley (2000) to construct the modular model of WM.
Working memory should be considered as a cognitive function and not a memory system, as it is responsible not only for storage, but also processing information and integrating it with already stored knowledge (Juffs & Harrington, 2011; Ortega, 2009). Baddeley and Hitch’s (1974) original framework of WM consisted of three components: the central executive, the phonological loop, and the visuo-spatial sketchpad. Later, Baddeley (2000) added the executive buffer into the model. The central executive is responsible for organizing general WM operations, controlled processing through allocation of attentional and cognitive resources, controlling the shifts between the immediate task performance and retrieval processes for task completion, and integrating information from different WM slave systems (i.e. PSTM or visuo-spatial sketchpad) and long-term memory (Juffs & Harrington, 2011; Ortega, 2009. Service, 1992). The visuo-spatial sketchpad processes and stores visual information, whereas the phonological loop is responsible for the storage and processing of phonological and verbal information (Juffs & Harrington, 2011; Service, 1992). Finally, the episodic buffer temporarily stores and integrates information between the visuo-spatial sketchpad and the phonological loop so that it can be incorporated into LTM as a memory trace. It has also been shown to aid those with phonological loop deficits in producing language (Juffs & Harrington, 2011; O’Brien, Segalowitz, Freed, & Collentine, 2007).
The phonological loop, defined neurologically by Rost (2016, pp. 14-15) as “a specialized auditory-vocal sensorimotor circuit connecting posterior temporal areas with the inferior parietal lobe (Wernicke’s area) and the ventrolateral prefrontal cortex (Broca’s area), has allowed humans to increase our capacity to process oral language by allowing us to hold auditory input in our short-term memory capacity,” has an integral role in both first language (L1) and second language learning (L2). In fact, the phonological loop has received much more attention than the visuo-spatial sketchpad in language research, since phonological information is integral to all aspects of language learning, even for reading and writing (Juffs & Harrington, 2011; Yalçın, Çeçen, & Erçetin, 2016). For instance, children with a stronger PSTM produce utterances of greater length and narratives containing more grammatically and semantically complex language than children with a weaker PSTM (Juffs & Harrington, 2011). Furthermore, in terms of vocabulary learning, the phonological loop is necessary for the processing of unfamiliar lexis in that it aids in the learning of the phonological forms of words (Masoura & Gathercole, 1999). In this regard, the phonological loop has received much attention in the literature (Juffs & Harrington, 2011).
The phonological loop is comprised of an active rehearsal component, where aural and verbal information is rehearsed subvocally so that the information can be retained as a memory trace, and the passive phonological store also known as phonological memory (PM) or phonological short-term memory where phonological representations of the aural or verbal input are stored before it is rehearsed (Baddeley, Gathercole, & Papagno, 1998; O’Brien, Segalowitz, Collentine, & Freed, 2006; O’Brien et al., 2007; Rost, 2016; Service, 1992). It also appears that retention of information in PSTM lasts only approximately 2 seconds, and if it is not rehearsed in that time, it will fade (O’Brien et al., 2007; Service, 1992). However, if the material is rehearsed, it lasts longer in PSTM (O’Brien et al., 2006). Studies Investigating Working Memory and Phonological Short-term memory
Initial studies that implemented serial recognition tests tested their efficacy with L1 participants. Gathercole and Pickering (1999) gave a group of 29 children both serial recall and recognition tasks. Pearson partial correlations indicated that recall tasks containing phonemes of low-probability correlated strongly with word (r = .50) and nonword (r = 66) recognition tasks, indicating that the two measures tapped into the same construct of PSTM. In other words, those who did well in the recognition tasks also did well in the recall tasks. However, there was no association between performance on the recognition tasks and the participants’ lexical or phonotactic knowledge.
Other studies explored the effect of the use of nonwords compared to actual words. Gathercole, Pickering, Hall, and Peaker (2001) expanded on the Gathercole and Pickering (1999) study by conducting a series of experiments using word and SNWR and serial nonword recall tasks first on 8-year-old subjects and then on a group of adults and assessed whether lexicality and phonologically similar pairs influences performance. Gathercole et al. found that young learners with a small mental lexicon performed poorer than their more adept counterparts and phonologically similar stimuli cause disruption in memory performance in both recall and recognition tasks, which indicated that PSTM mediated memory performance in both types of tasks. Also, they discovered that serial recognition tasks were less susceptible to lexicality than serial recall tasks, as performances with nonwords were approximately 50% worse than with actual words. Gathercole et al. concluded that lexicality, as evidenced in serial recall tasks influence memory for item information, whereas phonological similarity impairs the item order retention.
Subsequent studies opted for the use of serial recognition tests with nonwords instead of actual words because of the threat of lexicality and used them to measure PSTM. O’Brien, Segalowitz, Collentine, and Freed (2006) looked at the role of PSTM, or phonological memory (PM) as it was referred to in this study, in speech production, particularly, its contribution in improving grammatical and syntactic complexity and developing abilities to produce narrative tasks. PM was measured through English SNWR tests taken from Gathercole et al. (2001). The results of the study suggested that those with a stronger PM had a tendency to use a wider variety of vocabulary, PM was not related to the development of vocabulary production but to vocabulary knowledge. PM was also found to have a relation with correct use of function words and subordinate clause use. O’Brien et al. (2006) inferred that PM was a useful predictor for narrative development at earlier stages of L2 learning. They also suggested that beginning learners’ PMs will concentrate on processing content words, and once a learner had become more proficient, PM would reallocate attentional resources to L2 morphosyntax and producing more complex syntax. Furthermore, they also concluded that PM was not a strong contributor for more advanced learners, as much linguistic material had become automatized, allowing for greater fluency.
There are also studies that explored the role of PSTM on fluency development. O’Brien, Segalowitz, Collentine, and Freed (2007) expanded the O’Brien et al. (2006) study and were interested in the contribution of PM on oral fluency on the same group of L2 Spanish learners from the previous study. WM was evaluated by SNWR tasks that were the same as those in O’Brien et al. (2006). The results indicated that PM contributed from 4.5% to 9.7% of the variance with learning context partialled out depending on the independent
variables. Furthermore, PM was considered to be a significant contributor to L2 oral fluency, as those who made greater fluency gains were those who were associated with stronger PM irrespective of the learning environment. They also made the conclusion that PSTM and its function of phonological storage is a better indicator of language learning than the phonological loop. However, to make such claims, the researchers would need to include more robust measures of PSTM and phonological memory
Studies have also investigated PSTM’s influence on the acquisition of morphosyntax. Martin and Ellis (2012) investigated the role of WM and PSTM on the implicit learning of the rules for noun and verb plural morphology and adjectival placement for an artificial grammar. The study was conducted with 40 university students, and they were measured for PSTM by English serial nonword repetition and SNWR tasks. Martin and Ellis concluded that WM and PSTM are distinct cognitive constructs that contribute to the acquisition of vocabulary and grammar. However, they found that although vocabulary learning was reliant on WM and PSTM, they could not deny the contribution vocabulary knowledge plays on grammar acquisition. In other words, both WM and PSTM are fundamental in grammar and vocabulary learning, but in the case of acquiring some aspects of grammar, the learner’s mental lexicon as well as WM are necessary. However, they did not elucidate exactly what grammatical aspects are mediated through vocabulary knowledge.
There have also been studies that explored the PSTM construct by using tests with non-native language nonwords. French and O’Brien (2008) investigated the role of PM on grammar learning, whether it is independent of prior lexical knowledge, and whether PM ability can improve or is a static cognitive function. They conducted the experiment with a group of 104 grade 6 Francophone learners of L2 English in a five-month intensive English course. Although they did not use SNWR tasks, they measured the learners PSTM (or phonological memory as termed in this study) through English and Arabic nonword (a language the participants had no knowledge of) repetition tasks. These tasks differed from the SNWR tests in Gathercole and Pickering (1999) and Gathercole et al. (2001) in that instead of syllable length remaining constant and the number of words increasing, the number of words in the lists of French and O’Brien’s experiment remained constant, but the syllable level increased from 2 syllables to 5 syllables. The results of the study led to the conclusions that PM was a strong and significant contributor to grammar learning, and lexical knowledge contributed to grammar learning, but it only contributed a small amount (3.5%) to the model. Also, even though there were contrary results of the PM measurements in that the English SNWR task improved yet the Arabic task did not, they concluded that PM does not improve over time while learning a language.
Research Questions
As most of the studies mentioned above have incorporated the use of L1 nonwords to measure PSTM either through SNWR tests or serial recall tests, it would be prudent to use an L1-based instrument with Japanese participants. However, none of the studies mentioned their rationale for using L1 or an L2 as the base to measure PSTM. Furthermore, some Japanese researchers have employed the use of Japanese nonwords in their studies (Tanida et al., 2015a, 2015b), but the literature on using Japanese SNWR tasks is lacking. If Japanese students are to be assessed for their PSTM, there is a need for the development of a Japanese SNWR test.
Moreover, there is no indication that an L1 SNWR test is the most optimal approach to measuring PSTM. None of the studies except for Gathercole and Pickering (1999) mention an attempt to validate their instrument. However, Gathercole and Pickering only used correlation coefficients with their recall and recognition tests. There are no studies that have shown a Rasch analysis of the instruments to ensure that they indeed are measuring PSTM. Until a validation study of SNWR tests are conducted, we cannot know for certain whether an L1 or L2 SNWR test is the most viable instrument. Therefore, the purpose of this study was to create a Japanese SNWR test, investigate its construct validity, compare it to an English SNWR test, and try to determine which of the two is the best instrument to measure PSTM for Japanese students. In order to do so, two research questions were formulated:
1. Is a SNWR test a valid measurement of the construct of PSTM?
2. Which form of the SNWR test is a more reliable measurement of PSTM for Japanese students?
Instrument
English serial non-word recognition test.
The English SNWR test was based on the tests used in previous studies (Martin & Ellis, 2012; O’Brien et al., 2006; O’Brien et al. 2007) and was comprised of three sets of tasks; each set having six tasks, totaling 18 tasks. Each task contained a paired list of English nonwords. The nonwords were taken from the Gathercole and Pickering (1999) study, which consisted of 120 monosyllabic consonant-vowel-consonant (CVC) nonwords that
followed the English phonotactic system. The monosyllabic CVC items were used, as they are the smallest processable aural unit, where a number of items can be created. Set one contained paired lists of four nonwords in length, set two were five nonwords in length, and set three were six nonwords in length. It was assumed that the sets would increase in difficulty. In other words, set one should be easier than set two, and set two should be considered easier than set three. Participants listened to the paired lists and had to determine if the nonwords in both lists were in the same order or were different, as indicated by the transposed placement of two adjacent items within the second list (the first and last items always remained in the same position). An example is as follows:
1. meb cham korp
meb cham korp
2. koll teel gooz
koll gooz teel
The paired lists in example one are in the same order, whereas the order of the lists in example two is different. Nonwords were only used once and differed in vowel sounds and the beginning consonant within each list unless it was unavoidable (particularly with the set three lists). The items were recorded by the researcher and edited using version 2.2.1 of the audio recording and editing software, Audacity® (2018). There was a 750-millisecond space between items, a 1500-millisecond space between paired lists, and a 2000-millisecond space after the instructions and between tasks. The decision to use these spacings was based on the study by O’Brien, et al. (2007) where they used the same spacings for their SNWR test.
Japanese serial non-word recognition test.
Like the English SNWR test, the Japanese SNWR test was comprised of three sets of tasks, with each set having six tasks, totaling 18 tasks. As with the English SNWR test, the number of nonword items increased by one nonword as the participants progressed through each set. Each task contained a paired list of Japanese nonwords that were two mora in length and followed the Japanese phonotactic system. The decision to use two mora was similar to that of the English nonwords in that nonwords of two mora in length are the smallest aural unit that, theoretically, can be easily processed and stored in PSTM and
where multiple items can be constructed. For instance, although the use of Japanese nonwords in one mora in length would have been the syllabic equivalent of the English nonwords, there are many content and function words in Japanese that are of one-mora in length, which would have made creating one-mora-long nonwords difficult. 126 Nonwords were created and were used only once in the tasks. Nonwords that began with the same consonant or vowel sound or ended with the same vowel sound were never used in the same list to avoid confusion, to ensure that the items were as distinct from each other as possible, and to be a purer indictor of PSTM capacity. An example task is as follows:
1. いの (ino) てぽ (tepo) わこ (wako)
いの (ino) てぽ (tepo) わこ (wako)
2. みで (mide) らぞ (razo) へに (heni) みで (mide) へに (heni) らぞ (razo)
Like with the above example of the English SNWR tasks, example one shows that the lists are in the same order, whereas the second and third words in the second list in the second example have been transposed. Nonword items were checked by a native Japanese speaker to ensure that they were not actual Japanese words or resembled real Japanese words, and all items were recorded by the native Japanese speaker and edited using the Audacity® (2018) software. Items and tasks had spaces identical to those as the English SNWR tasks.
Participants
89 first and second grade Japanese university students from the same department participated in the English version of the SNWR test and 88 in the Japanese SNWR test. Participants were selected through convenience sampling in the form of intact classes, as it was the only viable option at the time.
Procedure
The two forms of the SNWR were administered in two sessions to each of the four classes. In the first session, two classes received the English version of the test, and the other two classes received the Japanese version of the test. In the following week, the classes
received the other form of the test. At the beginning of all sessions, participants were instructed to read the instructions, and then the procedure was explained in English. Participants then completed the practice sessions, which were four tasks that comprised of paired lists of three-nonwords in length. It was assumed that the practice tasks were short and simple enough for all participants to be able to store them in their PSTMs and to answer the practice tasks successfully. On the answer sheet, the first task was answered to show participants how to answer each task. For each task in the practice session, the audio was played back and paused, and participants marked their answer on the sheet. Participants then had to close their eyes and show which answer they had marked by raising their hand. If there were discrepancies in the answers, the task was replayed, and the procedure was repeated until all participants answered them correctly.
After the practice session, participants were instructed to do the tasks for set one. They were informed that they would listen to four words in length, that all tasks within the set would be played consecutively without any pauses from the instructor, and that they had to decide if the pairs of lists for each task were in the same order or were different and to mark it on their answer sheet. They were also informed to not copy from their classmates, to try and do the task on their own, and not to take any notes on their answer sheet. After each set was completed, participants were given a short break, where they were encouraged to talk in Japanese but instructed not to change the answers. After about a minute, participants were instructed about the next set, and this procedure continued until the end of the test.
Results
English SNWR test.
The results of the English SNWR test were analysed by Rasch analysis using the Winsteps software (Linacre, 2009). The analysis involved converting the answers of the SNWR task into their logit form and putting the participants and the item responses onto a true interval scale known as a logit scale (Révész, Ekiert, & Torgensen, 2016). The responses were analyzed for their reliability and goodness-of-fit for person and item responses. The summary statistics for person estimates, including the standard errors, infit and outfit statistics, and reliability coefficients for the participants are shown in Table 1, and those for items are shown in Table 2.
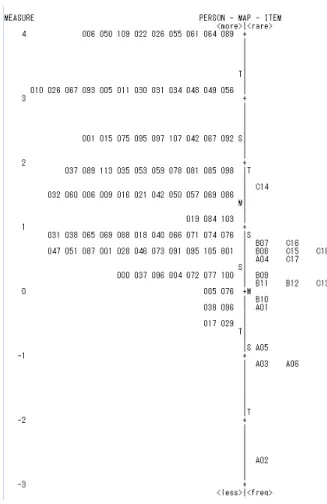
The results of the person estimates in Table 1 show the results for 80 of the 89 participants that took the test, as nine of the participants received perfect scores and were removed from the analysis. Person reliability was low at .52 and looking at the person measures in the Wright map in Figure 1, it shows a ceiling effect. This result suggests that the items for the English SNWR tasks were too simple for the participants and need to be more difficult.
Table 1. Summary Table for Person Measures for the English SNWR Test
Total
Score Measure Real S.E.
Infit Outfit MNSQ ZSTD MNSQ ZSTD M 13.3 1.41 .67 1.00 .10 1.06 .10 P.SD 2.7 1.01 .19 .14 .70 .71 .80 S.SD 2.7 1.01 .19 .15 .70 .72 .80 MAX. 17 3.13 1.12 1.37 2.10 5.66 3.40 MIN. 7 -.48 .51 .69 -2.00 .31 -1.60
Real RMSE .70 True SD .73 Separation 1.04 Person Reliability .52 Model RMSE .68 True SD .75 Separation 1.10 Person Reliability .55
S.E. of Person Mean = .11
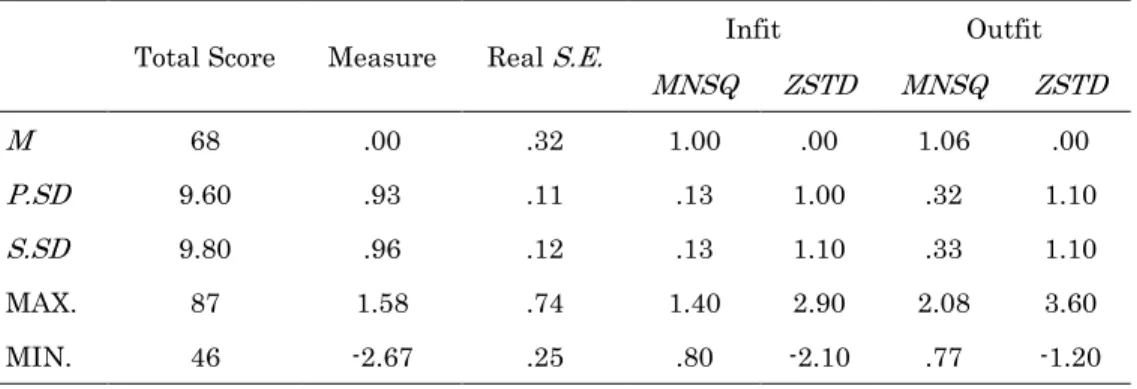
Table 2. Summary Table for Item Measures for the English SNWR Test
Total Score Measure Real S.E. Infit Outfit
MNSQ ZSTD MNSQ ZSTD M 68 .00 .32 1.00 .00 1.06 .00 P.SD 9.60 .93 .11 .13 1.00 .32 1.10 S.SD 9.80 .96 .12 .13 1.10 .33 1.10 MAX. 87 1.58 .74 1.40 2.90 2.08 3.60 MIN. 46 -2.67 .25 .80 -2.10 .77 -1.20
Real RMSE .34 True SD .87 Separation 2.59 Item Reliability .87 Model RMSE .33 True SD .87 Separation 2.66 Item Reliability .88
S.E. of Item Mean = .23
An analysis of items was conducted to determine whether they performed reliably and as expected in terms of their level of expected difficulty. The results for the item measures in Table 2 showed that, compared to the person reliability estimates, the reliability coefficient for items was much stronger at .87. However, the items were separated into two levels of difficulty and not into three levels as indicated by the separation index in Table 2. By exploring the Wright map in Figure 1, it was evident that many of the set 2 tasks and the set 3 tasks (referred to as B items and C items in the Wright map respectively) aggregated closely on the same logit; there was no clear distinction between what was assumed to be more difficult items. The majority of the set one tasks (the A items on the
Wright map) performed as expected, as they were lower on the logit scale, except for item A04, which was estimated to be as difficult as some of the set two and three tasks. Closer inspection of this item presented no clear reason as to why this item performed unexpectedly. Deletion of this item resulted in no change in item reliability estimates, but person reliability dropped slightly to .51.
Items and persons were then checked for fit. Items and persons that had infit statistics under .75 or over 1.30 were analyzed further, which indicated traces of overfitting or underfitting, were removed from the analysis to improve the reliability of the instrument, as recommended by Bond and Fox (2015, p. 270). Outfit was also taken into consideration; however, not as strictly as infit, as outfit statistics are not as sensitive as infit statistics. If the outfit of items or persons was high (for instance, ≥ 2.00), the items or persons were inspected more closely and then possibly removed from the analysis.
Items were first analyzed, and as can be seen in Table 3, only one item, C13, was misfitting with an infit statistic of 1.40 and an outfit statistic of 2.08. Further inspection of the actual item and recording provided no insight into its irregular performance. However, compared to other items in set 3, this item had a lower logit, suggesting that it was considered easier than its counterparts. Furthermore, it had a point measurement correlation of .06, indicating that it had a low connection to the WM construct than other items. An explanation for this could be that since the task was the first in set 3, many of the participants could have predicted that the pairing was going to be in the same order, which it was, and answered the task without fully listening to the task. I removed the item and reran the analysis, which returned a slight increase in item reliability at .88.
Table 3. Item Statistics for the English SNWR Test
Infit Outfit Measure Point
Correlation
Item Measure S.E. MNSQ ZSTD MNSQ ZSTD
A01 -.25 .30 1.03 .20 1.03 .20 .32 A02 -2.67 .74 1.05 .30 1.49 .80 .06 A03 -1.14 .40 1.06 .30 1.55 1.10 .19 A04 .44 .26 .84 -1.50 .77 -1.20 .52 A05 -.87 .35 1.00 .10 .79 -.40 .29 A06 -1.14 .40 1.07 .40 1.17 .50 .19 B07 .70 .26 1.03 .30 .93 -.40 .44
B08 .57 .26 .91 -.90 .82 -1.00 .50 B09 .23 .27 .84 -1.40 .90 -.40 .49 B10 -.16 .29 .99 .00 .90 -.30 .36 B11 .08 .28 .99 .00 .87 -.50 .39 B12 .08 .28 .95 -.40 1.00 .10 .40 C13 .15 .32 1.40 2.90 2.08 3.60 .06 C14 1.58 .25 .93 -.60 .92 -.60 .56 C15 .64 .26 .80 -2.10 .81 -1.10 .56 C16 .77 .26 1.09 .90 1.07 .50 .40 C17 .44 .27 1.03 .30 1.04 .30 .40 C18 .57 .26 1.04 .40 .96 -.20 .42
Person fit was then investigated to see if any misfitting persons contributed to the low person reliability. There were seven participants who had negative point correlations, borderline infit measures, and/or high outfit measures, which are shown in Table 4. The seven participants were removed from the data together with the misfitting item, and the data was reanalyzed to see whether improvements could be seen with the instrument. The results showed that there was only a minimal change in person reliability, increasing only to .55, and item reliability remained constant at .88. Even though the removal of these participants contributed no significant change to the analysis, since they were misfitting, I decided to leave them out of the analysis.
Table 4. Misfit Order of Persons in the English SNWR Test
Infit Outfit Point
Measure Correlation
Person Measure S.E. MNSQ ZSTD MNSQ ZSTD
63 1.85 .68 1.07 .30 5.66 3.40 -.16 56 3.13 1.12 1.15 .50 4.05 1.70 -.30 17 .57 .60 1.37 2.10 2.57 3.40 -.19 9 2.35 .83 1.16 .50 2.27 1.30 -.11 32 1.85 .73 1.23 .70 1.92 1.20 -.11 40 1.46 .67 1.29 1.00 1.66 1.10 -.09 88 .57 .59 1.32 1.90 1.52 1.40 -.03
The final step was to check the instrument’s dimensionality through a principal component analysis (PCA) of the Rasch residuals to see if it was measuring one construct. The variance explained by the Rasch measure for PSTM construct was only 22.7%, or 4.98 eigenvalues, of the total variance. Conversely, unexplained variance accounted for 77.3%, with the first contrast of unexplained variance having an Eigenvalue of 2.02, which explained 9.2% of the variance. The inspection of the seven items that were supposed to represent the first contrast showed that there is no commonality between the items in terms of use of phonemes, unison in their answer keys, or placement of transposed items within tasks. Furthermore, there was no discernable distinction or contrast between contrasted items that showed the highest loadings. At present, there is no clear indication as to what the underlying subconstruct could be.
Japanese SNWR test.
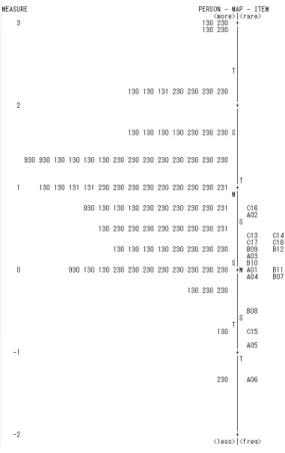
The data for the Japanese SNWR test was input into Winsteps® (Linacre, 2009), and initial results showed that compared to the English SNWR test, its Japanese counterpart was a less reliable measurement of PSTM; person reliability was low at .44 with two extreme cases removed and .51 with all 88 cases included, and item reliability was somewhat acceptable at .77. Exploration of the Wright Map for the Japanese SNWR test, as shown in Figure 2, showed a similar trend in person behavior as the results for the English SNWR test, as there was a spread. However, there was little representation in the lower logits for the easier items. Furthermore, a ceiling effect was present again, with two participants receiving perfect scores, and many participants placing higher on the logit scale than the most difficult items. This result indicated that for these participants, the items were too easy for them to answer. The person separation index, as seen in Table 5, was .89, which revealed that there was not much representation of participants for this study in terms of PSTM capacity.
Although the reliability of the items was significantly greater than that for persons, examination of the items was less than satisfactory. The placement of items on the Wright Map, as seen in Figure 2, showed that items were not separated based on level of difficulty. Although the most difficult item was a six-nonword-long item (C16), and the easiest item was a four-nonword-long item (A06), most of the items were interspersed around the mean in a non-systemic way. Furthermore, one item that was supposed to be simple for the participants to answer was considered the second most difficult item to answer correctly (A02). Additionally, the item separation index found in Table 6 was 1.84, which indicated that the items were classified almost into two, (not three) levels of difficulty
as was desired. This pattern was also evident in the Wright Map with a group of four items having a logit of -.05 or lower and a gap between this group and the remaining items that are clumped close together. Clearly, these items are not performing as was expected.
Figure 2. The Wright map for items and persons for the Japanese SNWR test.
Table 5. Summary Table for Person Measures for the Japanese SNWR Test
Total
Score Measure Real S.E.
Infit Outfit MNSQ ZSTD MNSQ ZSTD M 12.20 .89 .57 1.00 .00 1.00 .10 P.SD 2.60 .78 .10 .09 .60 .21 .70 S.SD 2.60 .78 .11 .09 .60 .21 .70 MAX. 17.00 2.95 1.04 1.17 1.20 1.81 1.60 MIN. 4.00 -1.33 .49 .79 -2.00 .67 -1.90
Real RMSE .58 True SD .52 Separation .89 Person Reliability .44 Model RMSE .57 True SD .53 Separation .93 Person Reliability .46
S.E. of Person Mean = .08
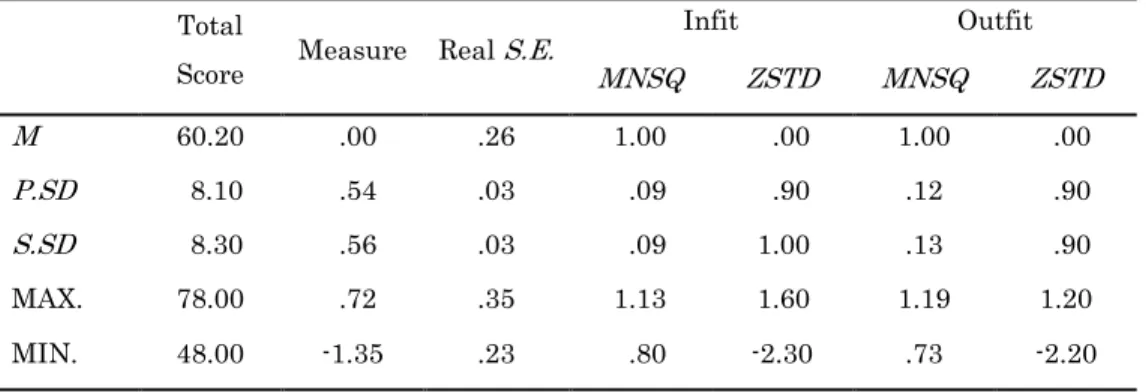
Table 6. Summary Table for Item Measures for the Japanese SNWR Test
Total
Score Measure Real S.E.
Infit Outfit MNSQ ZSTD MNSQ ZSTD M 60.20 .00 .26 1.00 .00 1.00 .00 P.SD 8.10 .54 .03 .09 .90 .12 .90 S.SD 8.30 .56 .03 .09 1.00 .13 .90 MAX. 78.00 .72 .35 1.13 1.60 1.19 1.20 MIN. 48.00 -1.35 .23 .80 -2.30 .73 -2.20
Real RMSE .26 True SD .48 Separation 1.84 Person Reliability .77 Model RMSE .25 True SD .48 Separation 1.88 Person Reliability .78
S.E. of Item Mean = .13
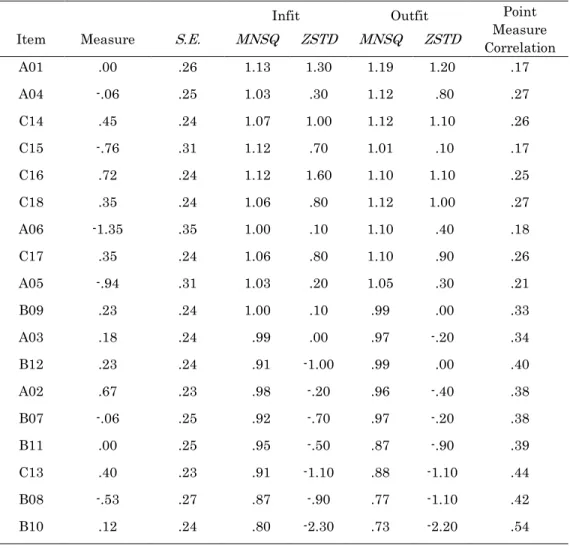
Item fit was then analyzed for misfitting items. The results of the analysis are shown in Table 7. All items were within the acceptable parameters as set by Bond and Fox (2015) and their point measure correlations were all positive, suggesting that there were no items underfitting or overfitting and that the participants responded to them consistently. Therefore, it was decided to keep all items in subsequent analyses.
Table 7. Misfit Order of Items in the Japanese SNWR Test
Infit Outfit Point
Measure Correlation
Item Measure S.E. MNSQ ZSTD MNSQ ZSTD
A01 .00 .26 1.13 1.30 1.19 1.20 .17 A04 -.06 .25 1.03 .30 1.12 .80 .27 C14 .45 .24 1.07 1.00 1.12 1.10 .26 C15 -.76 .31 1.12 .70 1.01 .10 .17 C16 .72 .24 1.12 1.60 1.10 1.10 .25 C18 .35 .24 1.06 .80 1.12 1.00 .27 A06 -1.35 .35 1.00 .10 1.10 .40 .18 C17 .35 .24 1.06 .80 1.10 .90 .26 A05 -.94 .31 1.03 .20 1.05 .30 .21 B09 .23 .24 1.00 .10 .99 .00 .33 A03 .18 .24 .99 .00 .97 -.20 .34 B12 .23 .24 .91 -1.00 .99 .00 .40 A02 .67 .23 .98 -.20 .96 -.40 .38 B07 -.06 .25 .92 -.70 .97 -.20 .38 B11 .00 .25 .95 -.50 .87 -.90 .39 C13 .40 .23 .91 -1.10 .88 -1.10 .44 B08 -.53 .27 .87 -.90 .77 -1.10 .42 B10 .12 .24 .80 -2.30 .73 -2.20 .54
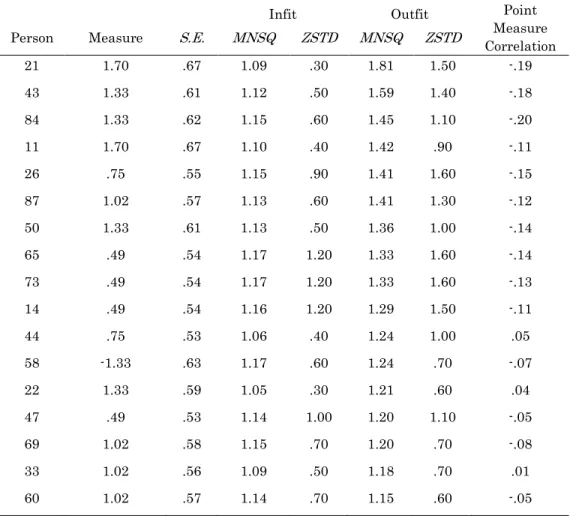
The results of the analysis for person fit, as shown in Table 8, revealed that there were no severe issues with infit. However, outfit statistics for 10 individuals ranged from 1.29 to 1.81. Coupled with their negative point measure correlations, there was reason to investigate further if these participants were influencing the reliability estimates. There were four other persons with negative point correlations (persons 47, 58, 60, and 69); however, they were under -.10, and the participants’ infit and outfit statistics were within the acceptable parameters. Therefore, those four participants remained in the subsequent analysis.
Table 8. Misfit Order of Persons in the Japanese SNWR Test
Infit Outfit Point
Measure Correlation
Person Measure S.E. MNSQ ZSTD MNSQ ZSTD
21 1.70 .67 1.09 .30 1.81 1.50 -.19 43 1.33 .61 1.12 .50 1.59 1.40 -.18 84 1.33 .62 1.15 .60 1.45 1.10 -.20 11 1.70 .67 1.10 .40 1.42 .90 -.11 26 .75 .55 1.15 .90 1.41 1.60 -.15 87 1.02 .57 1.13 .60 1.41 1.30 -.12 50 1.33 .61 1.13 .50 1.36 1.00 -.14 65 .49 .54 1.17 1.20 1.33 1.60 -.14 73 .49 .54 1.17 1.20 1.33 1.60 -.13 14 .49 .54 1.16 1.20 1.29 1.50 -.11 44 .75 .53 1.06 .40 1.24 1.00 .05 58 -1.33 .63 1.17 .60 1.24 .70 -.07 22 1.33 .59 1.05 .30 1.21 .60 .04 47 .49 .53 1.14 1.00 1.20 1.10 -.05 69 1.02 .58 1.15 .70 1.20 .70 -.08 33 1.02 .56 1.09 .50 1.18 .70 .01 60 1.02 .57 1.14 .70 1.15 .60 -.05
The following analysis with the 10 removed participants revealed that person reliability only increased slightly to .49. However, item reliability made a significant increase to .86. Inspection of the Wright Map also revealed that the majority of participants were falling within 0 to 2 logits, signifying a better spread than last time. However, many participants still were placed well above the most difficult items, and there was little representation below 0 on the logit scale. To see if reliability could be further improved, the remaining four participants with negative correlations were also removed in the subsequent analysis. The result was that person reliability decreased to .46, but item reliability increased slightly to .87. Since there were no significant improvements from the previous analysis, the said four participants were reentered into the analysis.
To check whether the instrument was unidimensional, the test’s dimensionality was analyzed. The results of the PCA indicated that the instrument had an eigenvalue of 2.95, accounting for 14.1% of the variance. Unexplained variance accounted for 85.9% of the variance. The first contrast of unexplained variance received an eigenvalue of 1.89 (9% of the variance), which was not significantly high but warranted investigation as to whether a subconstruct could be identified. The nine items in the first contrast were investigated to see if the subconstruct could be observed, and the results revealed no pattern that could explain the presence of a subconstruct, in terms of similar items within paired lists, comparability in answers choices, or placement of adjacent items in tasks where the lists were in the different order.
Discussion
At present, based on the results of the Rasch analysis, it became apparent that the use of these serial nonword recognition tests to measure PSTM is questionable. Although item reliabilities for both English and Japanese versions of the SNWR tests were acceptable after misfitting people or items were removed, the lack of separation of items into three discernable levels and the unexpected and unsystematic placement of items on the Wright Map suggests that the instrument needs revision. However, with Rasch analyses of instruments with 80 or more participants should be producing item reliability estimates should be around .99. The high number of easily answered items is the cause of this drop in reliability.
Regarding the first research question of whether the English and Japanese SNWR tests are valid measurements of PSTM, the results are inconclusive, as both tests do not fully represent a wide range of difficulties to measure the construct accurately. If one or both tests did so, that claim could be made. Until the instrument is properly calibrated with both persons and items having a good spread on the logit scale, making a claim that SNWR tests accurately measure PSTM is not only premature, it is also inaccurate.
In fact, it is difficult to concur that any SNWR task accurately and reliably measures PSTM. Studies that have used this instrument to measure PSTM (Gathercole & Pickering, 1999; Gathercole et al., 2001; Martin & Ellis, 2012; O’Brien et al., 2006; O’Brien, 2007) never mentioned whether the test was validated or if there was an actual attempt to do so. Gathercole and Pickering claimed that their instrument was valid, as their recall tasks containing phonemes of low probability correlated with word and nonword recognition tasks. However, these correlations were not strong enough to declare that the instruments are
tapping into the same construct. Furthermore, correlations between two instruments do not necessarily mean that the instruments tap into the same construct if at least one of the instruments has not been tested on its own for construct validity of the said construct.
The English and Japanese SNWR tests in this study cannot claim to strongly represent the construct of PSTM, as their PCA of the Rasch residuals showed that the measurements contributed little variance to the model. As mentioned in the results section, there was no discernable reason for the high percent of unexplained invariance in both instruments. It is possible that it is such a poor model due to the mediocre reliability estimates for persons and the lack of representation from the sample. Besides the poor person reliability, an explanation as to why there was so much unexplained variance in both instruments is how the Japanese participants perceived the input. In the case of the English SNWR test, the participants could have processed the input with epenthesis. For instance, any word that ended with a consonant could have been interpreted by the participants to have ended with a vowel sound. If this were the case, the monosyllabic input would have been transformed to have two or perhaps three syllables in their phonological loop and PSTM, which would have been a greater cognitive load on phonological processing. Furthermore, by the input becoming epenthetic, the input might have altered in the participant’s phonological loop and PSTM to deviate sharply from the original input, causing confusion and misrepresentation of items in the participants’ PSTM.
As for the unexplained variance in the Japanese SNWR test, we must consider the threat of lexicality. Studies that employed serial recognition tests using nonwords (Gathercole et al., 2001; Martin & Ellis, 2012; O’Brien et al., 2006; O’Brien et al., 2007) chose to do so, as they supposedly eliminated participants’ reliance on their lexical knowledge. However, there is a possibility that some of the nonwords could have similar-sounding word-pairs. Upon exploring the nonword items, it became evident that some of the nonwords became actual words when attached with an additional mora. These similar-sounding words could have activated lexical competition (Rost, 2016), which could either produce confusion in the participant and interrupt retention of the items or provide the participants with a cognitive strategy where the participant remembers the affiliated actual word instead of the nonword and facilitate retention not from PSTM but from the participant’s lexicon. If this is so, there is a confound in using an L1 instrument.
Based on the results of this study, it seems that using L1 serial recognition tests with words or nonwords is probably best avoided if one truly wants to measure PSTM. A possible solution to this is using nonwords based on the phonotactic system of a completely
unfamiliar language to the participants French and O’Brien (2008) conducted a study that used two serial nonword recognition tasks with an L2 (English) that the subjects were studying and an L3 (Arabic) that was unfamiliar to the Francophone subjects. The Arabic version of the SNWR showed greater contribution to the regression models than the English version most likely because subjects had to solely rely on their phonological processing skills and not their phonotactic knowledge of the English language. By using an L3 as the medium for the instruments, participants cannot rely on their L1 lexical knowledge or their familiarity with the phonotactic system of a second language (L2) that they have been learning by applying the phonotactic rules from their L1 to the L2 to make it more amenable like using epenthesis.
The second research question was concerned with which of the two tests was a better indicator of PSTM. As shown in the response to the first research question, neither test can be considered reliable measurements of PSTM. Moreover, it is difficult to discern which of the two measurements is a more accurate instrument for PSTM, as both instruments’ person and item reliability estimates were similar. However, if we were to compare the placement of items on the Wright Map, separation for both instruments was ineffectual, but the placement of items on the English SNWR Wright map were more-or-less falling in a linear fashion with the set one items being placed on the lower end of the logit scale, the set two items being placed around the mean, and some of the set three items being placed at the higher end of the logit scale. The issue is the inter-mixing of set two and set three items, as there needs to be greater separation of items in terms of difficulty to confidently and completely assert that the English SNWR test is a superior test for Japanese students.
The biggest issue with the tests is its lack of challenging items. There were nine participants in the English SNWR test and two in the Japanese SNWR test results who received perfect scores, and the vast majority of participants in the English test and a considerable number of participants in the Japanese SNWR test received logit scores much higher than the items that were considered the most difficult. Furthermore, there was little representation for persons below the mean. It is evident that the instrument needs the inclusion of much more difficult items. Since this was an initial attempt at making a Japanese SNWR test, there was no baseline to create Japanese nonwords. I thought best to begin the development of this instrument with the simplest units that be construed using Japanese mora. I wanted to create Japanese items that were the closest equivalent to the English CVC nonwords. The results of this instrument indicated that there is an element to both tests that was considered too simple for the participants, and so there needs to be some
kind of challenge introduced into the current form of the instrument.
The simplest way to improve the reliability of the SNWR instruments and make the tests more difficult is to increase the number of nonwords within tasks. By doing so, there could be more item separation. There are two ways this could be accomplished. One way is to simply introduce more sets and tasks when administering the instrument. Previous studies that employed SNWR tests (Martin & Ellis, 2012; O’Brien et al., 2006; O’Brien et al., 2007) used lists of five, six, and seven nonwords in length. Future versions of this instrument could implement a set with seven and even eight nonword lists to ensure that there would be a better spread of items on the Wright Map. However, this could bring task fatigue if the test has a lot of tasks.
To counteract the possibility of test fatigue, the second way to improve the test is to increase the number of nonwords within lists in the succeeding sets but administer the instrument using lists with an even-numbered amount of words. For instance, set one contains lists of four nonwords, set two contains lists of six nonwords, set three contains lists of eight nonwords, and for the sake of ensuring that there are sufficient difficult items, set four contains lists of ten nonwords.
Additional alterations that could improve the reliability of the instrument is to explore the effect of spacing between items, paired lists and tasks. It is possible that the short amount of time between paired lists within one task was not long enough. Input has been shown to last approximately two seconds in PSTM before it dissipates (Juffs and Harrington, 2011) and the 1,500-millisecond space between lists might not have been long enough to test PSTM. Furthermore, there could also be a need to introduce some type of fixation to interrupt the phonological process and see if that affects retention in PSTM. Another approach to the instrument is to emulate the study of French and O’Brien (2008) by controlling the number of words in the list and using syllable length as the difficulty parameter for tasks. It would be worthwhile to take such an approach to see if there are any discernible differences in reliability and construct validity between the two forms of the SNWR test.
A final and necessary improvement to the validation of the tests is the need for more person variance. As explained earlier, there was little person representation on the lower half of the Wright Map, which indicates that there was skewness in the spread of persons. The most likely cause of this is from the convenience sampling method. Using subjects from intact classes in one department of one university is almost certainly not going
to produce variance of levels of the PSTM construct or going to be representative of the population. Future testings of this instrument need to not only have participants from different institutions and proficiency levels, it also needs more participants to ensure that the instrument is reliable and there is proper representation.
Conclusion
In this study, I attempted to create and validate a Japanese SNWR test and compare its reliability of measuring PSTM against an analogous and often-used English SNWR test. The results showed that neither instrument could accurately measure the construct, and revisions need to be made before using this instrument in future studies to measure PSTM. In this study the use of L1 or L2 as the basis for nonwords in the instrument was investigated, and the results suggest the implementation of using an unfamiliar language as the base for nonwords. Because it would be presumptuous to state that this instrument is an accurate measure of PSTM and that no other study has reported convincing validity studies for their SNWR instruments, one could declare that SNWR tests are not representative of PSTM. Not until the instrument has sufficient difficult items, a sample of subjects with varying degrees of responses to those items, and PCA results that show that the measurements accounts for a significant amount of variance, can we assert that SNWR tests tap into the construct of PSTM.
References
Atkinson, R. C., & Shiffrin, R. M. (1968). Human memory: A proposed system and its control processes. In K. W. Spence (Ed.), The psychology of learning and motivation: Advances in research and theory (Vol. 2). New York: Academic Press.
Audacity Team. (2018). Audacity®: Free Audio Editor and Recorder [Computer application]. Version 2.2.2. Retrieved from https://www.audacityteam.org/
Baddeley, A. D. (2000). The episodic buffer: A new component of working memory? Trends in Cognitive Science, 4, 417–423.
Baddeley, A., Gathercole, S., & Papagno, C. (1998). The phonological loop as a language learning device. Psychological Review, 105(1), 158-173.
Baddeley, A. D., & Hitch, G. (1974). Working memory. In G. H. Bower (Ed.), Recent advances in learning and motivation (pp. 47–89). New York: Academic Press.
Baddeley, A., Papagno, C., & Vallar, G. (1988). When long-term learning depends on short-term storage. Journal of Memory and Language, 27, 586-595.
Bond, T. G. & Fox, C. M. (2015). Applying the Rasch model: Fundamental measurement in the human sciences. New York: Routledge.
French, L. M., & O'Brien, I. (2008). Phonological memory and children's second language grammar learning. Applied Linguistics, 29(3), 463-487.
Gathercole, S. E. & Pickering, S. J. (1999). Estimating the capacity of phonological short-term memory. International Journal of Psychology, 34(5-6), 378-382.
Gathercole, S. F., Pickering, S. J., Hall, M., & Peaker, S. M., (2001). Dissociable lexical and phonological influences on serial recognition and serial recall. Quarterly Journal of Experimental Psychology: Section A, 54(1), 1-30.
Juffs, A., & Harrington, M. (2011). Aspects of working memory in L2 learning. Language Teaching, 44(2), 137-166.
Linacre, J. M. (2009). Winsteps® RASCH Measurement [Computer software]. Version 4.0.0. Retrieved from http://www.winsteps.com/index.htm
Martin, K. I., & Ellis, N. C. (2012). The roles of phonological short-term memory and working memory in L2 grammar and vocabulary learning. Studies in Second Language Acquisition, 34, 379–413. O’Brien, I., Segalowitz, N., Collentine, J., & Freed, B. (2006). Phonological memory and lexical, narrative,
and grammatical skills in second language oral production by adult learners. Applied Psycholinguistics, 27(3), 377-402.
O’Brien, L., Segalowitz, N., Freed, B., & Collentine, J. (2007). Phonological memory predicts second language oral fluency gains in adults. Studies in Second Language Acquisition, 29(4), 557-581. Ortega, L. (2009). Understanding second language acquisition. London, United Kingdom: Hodder
Education.
Révész, A., Ekiert, M., & Torgensen, E. N. (2016). The effects of complexity, accuracy, and fluency on communicative adequacy in oral task performance. Applied Linguistics, 37(6), 828–848.
Rost, M. (2016). Teaching and researching listening (3rd ed.). Harlow, England: Pearson Education. Service, E. (1992). Phonology, working memory, and foreign language learning. The Quarterly Journal
of Experimental Psychology, 45(1), 21-50.
Tanida, Y., Ueno, T., Lambon Ralph, M. A., & Saito, S. (2015a). The influence of accent pattern typicality on immediate and delayed nonword repetition. Psychologia, 58(3), 145–154.
Tanida, Y., Ueno, T., Lambon Ralph, M. A., & Saito, S. (2015b). The roles of long-term phonotactic and lexical prosodic knowledge in phonological short-term memory. Memory & Cognition, 43(3), 500–519.
Vallar, G., & Baddeley, A. D. (1984). Fractionation of working memory. Neuropsychological evidence for a phonological short-term store. Journal of Verbal Learning and Verbal Behavior, 23, 151-161. Yalçın, Ş., Çeçen, S., & Erçetin, G. (2016). The relationship between aptitude and working memory: An