行為に対する「依存」・「嗜癖」の心理学的研究 :
Internet addiction を中心に
著者
高橋 伸彰
学位名
博士(心理学)
学位授与機関
関西学院大学
学位授与番号
34504甲第519号
URL
http://hdl.handle.net/10236/12616
2013
(
)
“addiction ( )” “addiction” “dependence ( )” WHO DSM-5 “dependence” “addiction” “addiction” “behavior” “addiction” “Internet” “addiction” “addiction”
Internet addiction Web
1)
2) Internet addiction
3)
4) Internet addiction
1 1 1 2 2 Internet addiction 6 3 Web 12 4 20 2 Internet addiction 1 2 28 2 30 3 41 4 Internet addiction (1) 53 5 Internet addiction (2) 67 6 2 71 3 1 73 2 85 3 96 4 102 5 3 107 4 110 113 114 123
“addiction” ( ) ( ) ( ) ( ) 1) 2)
Internet addiction Web
1 1 2 Internet addiction 3 Web 4 2 1 2 3 Internet addiction 4 5 6 2 3 1 1 2 Internet addiction 2 3 Internet addiction 4 6 3
1
1 1 ( 2008) ( ) (addiction) (habituation) (WHO) 1) 2) 3) 3 1 (WHO, 1957) ( 2013) 1965 WHO (dependence) (WHO 1965) 1969 (WHO 1969) 1) (abuse) 2) (dependence) 3) (intoxication) (2000) 1) 2) 3) 2 ( 2000) 1980 2013 (American Psychiatric Association: APA)(Diagnostic and Statistical Manual of Mental Disorders) 5
(DSM-5) 4 (DSM-IV) WHO
10 (ICD-10)
“addiction ( )”
(Marks 1990)
“addiction” (Internet addiction )
(substance addiction) (process addiction)
(relationship addiction) 3 (
DSM-5 (American Psychiatric Association, 2013)
“Substance-related disorders ( )”
“Substance-related and addictive disorders ( :
) “abuse ( )”
“dependence ( )” “use disorders ( )”
“dependence” DSM-IV 3 7 11 ICD-10 DSM-III “gambling disorder ( : )”
(American Psychiatric Association, 2011)
( 2012; 2012) (2013) 1) 2) 3) ( ) 1957 WHO Expert Committee 2 2 1 (behavioral addiction)
Marks (1990) “Behavioural (non-chemical) addictions”
Marks 1)
2) 3)
4) 5)
)
Tavaress & Gentil (2007) Marks
(obsessive-compulsive disorder: OCD) (compulsive spending;
) ( ) (kleptomania) (trichotillomania) Sussman et al. (2011) 8 ( ) ( 50%) 3 ( 40%) ( 50%) ( 50%) ( 30%) 10% 3
2 (abuse, misuse) (addiction)
(dependence) 2 2 ( ; substance addiction) DSM-5 3 – ( ) –
3 Web “Internet addiction”
(electronic survey) (online survey)
(Internet survey) Web (Web survey) (E-mail
survey) Web
Web
1
“Internet” “Web”
“Internet addiction” “problematic Internet use”
“excessive Internet use” “Internet dependence”
“Internet addiction”
( ) ( )
2 Internet addiction 1
Young (1998a, 1998b) Internet addiction Internet
addiction (behavioral addiction)
Young Kraut et al. (1998) 2012 9,652 79.5% ( 2013) 59.6% ( 2013) ( , 1999; Griffiths, 2011) 1,160 9 ( 2013) ( 2013) & ( 2013) 2011 ( 2013) 2012 ( 2013)
( 2013) 1,000 ( 2013) 4 6 8 7 5 ( 2013) ( 2013) ( 2011; 2012) LINE 4 ( 2013) Internet addiction Internet addiction 2 1 Kraut et al. (1998) ( , 2004; , 2005; Bessière et al.,
2008; Jackson et al., 2006; Kraut et al., 2002; , 2008; Thomée et al.,
2005; van den Eijnden et al., 2008)
(Jackson et al., 2006) (2009) 6 (1) 2) BBS 3) 4) BBS 5) 6) ) 5 (1) 2) 3) 4) 5) ) (1) 2) 3) 4) ) BBS Internet addiction
( Kim, et al., 2009; Young, 1998a)
2
2
1 Khantzian Albanese
(self-medication hypothesis) (Khantzian, 1975;
Khantzian & Albanese, 2008 2013) 1)
2)
(Khantzian & Albanese, 2008 2013)
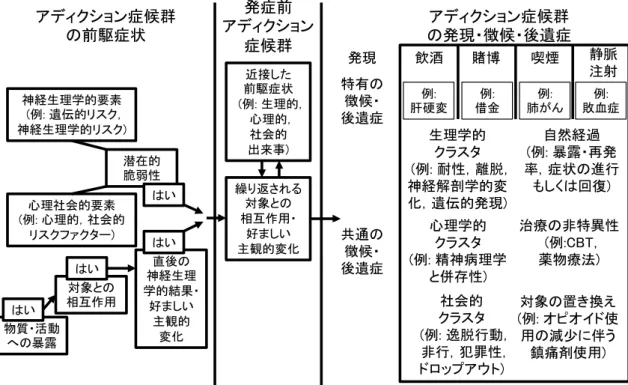
1 Shaffer et al. (2004)
(syndrome model of addiction) 1) 2) 3) ( ) ( )
Shaffer et al. (2004) Figure 1-2-1
Khantzian & Albanese (2008 2013)
Shaffer et al. (2004)
Bierut et al. (1998)
( )
(Merikangas et al., 1998) Kendler et al.
(Karkowski et al., 2000) (Kendler et al., 2003)
(Karkowski et al., 2000)
(Fergusson & Woodward, 2002; Weiss et al., 2004)
Figure 1-2-1. (Shaffer et al., 2004 ) (Thomas et al., 2003) (Bolton et al., 2006) Web 1) 2) 2 3) Web 2
(Grant et al., 2010)
( Patton et al. (1995) Barratt
Impulsiveness scale (2005) ) ( Logan et al. (1997) Bechara et al. (2000) ) 2 (Takano et al., 2010) Web (availability) Web
3 Web 1 Web 3 Web Web Web 1 2 1 (2004) (electronic survey) 1990 3 (2003) E-mail Web E-mail Web HTML E-mail (2004) Table 1-3-1 ( ) Web (2004) (data
acquisition system) (Computer
Assisted Survey Information Collection; CASIC) (Computer Assisted Data Collection)
1) 2) Web Web (2003) Table 1-3-2 Web Web Web ( ) (2003)
Table 1-3-1
( )
(CA: Computer Assisted) CASIC CADAC ( ) (CAI) CAPI CASIC – – (Disk by Mail) DBM Facsimile CATI – – – OFG Web CASIC: Computer Assisted Survey Information Collection
CADAC: Computer Assisted Data Collection CATI: Computer-Assisted Telephone Interviewing CAPI: Computer-Assisted Personal Interviewing CASI: Computer-Assisted Self-Interviewing OFG: Online Focus Group
( 2004 ) online panel (2003) probability sampling Couper (Table 1-3-3) probability-based methods non-probability methods 2 Web non-probability methods Web non-probability methods 3 Web 4 2 Web Web (2003) Web
Table 1-3-2 Web ( 2003) Table1-3-3 Couper (2001) Web Probability-based methods ( ) Intercept Surveys N
List-based Samples E-mail ( )
Web option in mixed-mode surveys Web
Pre-recruited panels of Internet users Pre-recruited panels of full population
Non-probability methods ( )
Polls as entertainment
Unrestricted self-selected surveys Web
Volunteer opt-in panels Web
Web Web ( 2003 ) 10 % 40 60 % Web Web ( ) Web Web
Web (Table 1-3-2) (2003) Web Web (2004) ( 2004) (Göritz, 2009) Web ( 2004; p2) Web 4 Web 2 (Göritz, 2009; , 2004, 2005; , 2006; , 2003) Web
Web (frame population) ( ) Web Web (2005) 1) ( ) 2) 3) ( ) 4) 5) ( 2005; 2009; 2003) (Göritz, 2009) (non-response
error) (measurement error)
Web 1) 2) 3) 4) ( ) Web Web 3 Web (2006) Web 6 1) Web
2) 3) Turner et al. (1998) (audio computer-assisted self-interviewing) (2011) (2006) Web 2 3 (2006) 3 4) 5) 6) Web (Göritz, 2009) Web ( ) 1 ( 2009; 2004) Web
( ) ( ) (Göritz, 2009) 2 1 1 Web 2 ( ) 1 1 1 1 1... 3 3 3 3 3... ( 2 3 4 4 3 2 1...) Web Web Internet addiction 1 Web Web
(2006) Web
4 1 1 (2012 2 3 ) 1 Web (15 ) 64 22 900 65 100 557 570 1127 ( 15 87 ) 999 ( 486 513 15 87 ) Table 1-4-1 1-4-4 2 3 (1) : ( ) 4 5 ( ) ( 1 ) (2) : (2007) (JIAT) 2 ( ) ( )
JIAT 2 Diagnostic Questionnaire for Internet
Addiction (DQ; Young, 1998b) Internet addiction Internet
addiction 2 ( 2007)
1) 2)
3) (2 ) 4) 5) Twitter
6)
7) YouTube 8)
9) SNS (mixi GREE Facebook ) 10)
10 4 ( 1 1 ) (2010) ( 2 3 4 ) 1 1 2 ( ) 1
Table 1-4-1 ( 1 ) 11 8 6 6 11 8 10 10 33 32 13 11 109 97 4 4 53 47 8 7 14 13 9 8 6 6 17 16 4 4 19 16 9 9 13 11 21 20 72 59 22 19 65 58 9 7 172 155 89 82 4 4 10 8 15 15 14 9 7 5 2 2 8 8 4 2 33 31 11 7 5 3 9 9 9 8 23 23 8 7 20 17 10 9 44 36 10 9 8 8 8 8 1127 999
Table 1-4-2 ( 1 ) 63 59 29 25 ( ) 125 109 ( ) 101 91 ( ) 73 59 82 76 42 39 ( ) 228 208 107 98 121 92 156 143 1127 999 Table 1-4-3 ( 1 ) 471 400 656 599 1127 999 Table 1-4-4 ( 1 ) 561 513 566 486 1127 999 (3) (JIAT; 2007): Young
(1998b) Internet addiction Internet
Addiction Test (IAT) (2007) DSM-IV
5 ( ) ( 1 2 ) (4) : 4 ( ) ( 2 ) (5) : 2 5 ( ) ( 4 ) (6) : 2 5 ( ) ( 4 ) (7) : ( ) ( ) 2 5 ( ) ( 4 ) (8) : 5 ( ) ( 2 4 ) (9) : 5 ( ) ( 2 4 ) (10) K6 ( 2003): Kessler et al. (2002) (2003) 6 5 ( ) ( 2 )
(11) UCLA ( 1992): Russell et al. (1980)
(1992) 20 4 ( ) ( 2 ) (12) : 4 4 ( ) ( 2 4 )
(JIAT)
Internet addiction ( IA) 100
IA 200 IA 65 ( 35 30 15 73 ) IA 205 ( 94 111 18 83 ) IA 51 ( 28 23 15 73 ) IA 188 ( 84 104 19 79 ) IA JIAT 68.94±8.57 ( 60 ) 1 ( 1000 1127 ) 2 ( 300 270 ) 1 ( ) 2 1 JIAT 2 Table 1-4-5 1-4-8 2 3 (1) : 4 5 ( ) ( 1 )
(2) Ten Item Personality Inventory (TIPI-J; 2012): Gosling
et al. (2003) 10 Big Five 5 2
TIPI (2012) 7
(
) ( 1
3 4 )
(3) Japanese version of the Barratt Impulsiveness Scale, 11th version (BIS-11; Someya et al., 2001): Barratt
Patton et al. (1995) 11
Someya et al. (2001) BIS-11 30 4 (
) ( 1 4 ) (4) : Piasecki et al. (2007) 8 1) 2) 3) 4) 5) 6) 7) 8) 4 ( ) ( 1 4 )
Table 1-4-5 ( 2 ) 2 2 1 1 3 3 5 4 6 5 3 2 26 23 0 0 10 10 3 3 4 4 1 1 2 2 7 7 3 3 5 5 2 2 3 2 7 7 9 9 8 8 20 19 0 0 37 28 25 20 1 1 3 2 3 3 6 6 0 0 0 0 1 1 0 0 11 8 0 0 0 0 3 3 1 0 4 3 3 3 6 6 1 1 10 8 1 1 5 5 0 0 270 239
Table 1-4-6 ( 2 ) 19 17 4 4 ( ) 28 22 ( ) 26 23 ( ) 14 12 20 20 12 9 ( ) 62 57 28 26 18 14 39 35 270 239 Table 1-4-7 ( 2 ) 112 101 158 138 270 239 Table 1-4-8 ( 2 ) 142 123 128 116 270 239 (5) ( 1987; 1989): (1987) (1989) 10 4 ( ) ( 4 ) (6) 2 ( 2013):
1
4 (
) ( 4 )
(7) (EC) ( 2005):
Rothbart et al. (2000) Adult Temperament Questionnaire
EC (2005) 1) (11
) 2) (12 ) 3) (12 ) 3
35 4 ( )
( 1 4 )
(8) BIS/BAS ( 2007): Behavioral Inhibition System (
; BIS) Behavioral Activation System ( ; BAS)
Gray BIS/BAS Scales (Carver & White,
1994) (2007) 1) BIS (7 ) 2) BAS
(4 ) 3) BAS (5 ) 4) BAS (4 ) 4
20 4 (
) ( 1 3 4 )
(9) : (2007)
(JIAT) Diagnostic Questionnaire for
Internet Addiction (DQ) ( ) 1) 2) 3) 4) 5) 6) 7) 8) 9) 10) 11) 12) 13) 14) ( ) 15) 15 4 ( 1 1 1 1 1 1 ) (2007) Sussman et al. (2011) ( 1 )
2
Internet addiction
1 2
1
“addiction” “dependence” “abuse”
( 2011) “Internet addiction” “addiction” 2 1 Ruben (1992) Ruben 1) 2) ( ) (Diodato, 1994 2008) ( Xie et al. (2008) Li et al. (2009) Ho et al. (2010) Fu et al. (2010) ) Li et al. (2009) ( )
Xie et al. (2008)
3 (
)
2 1 ( ) 2 ( ) 2010 7 7 web ( ) Webcat ( ) (Table 2-2-1) 7 Web 1983 2011 4 5 46 211 102 83 1296 TinyTextMiner ( 2009) ( ) − 1) 2) 3) 3 Web
Table 2-2-1 7
→
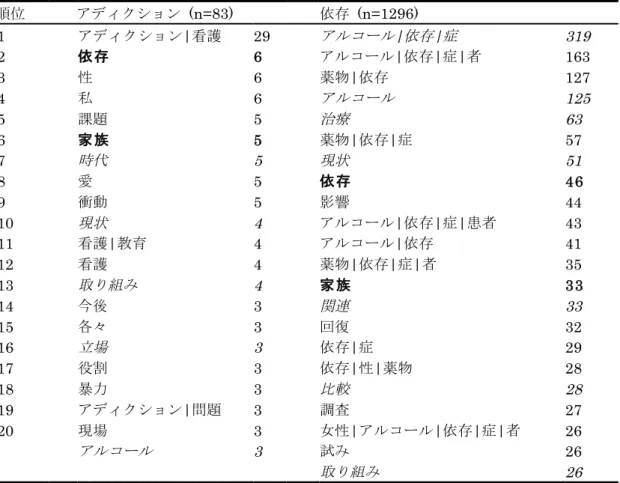
Table 2-2-2 20 (n=211) (n=102) 1 | 49 | 13 2 17 13 3 16 10 4 16 9 5 14 | 9 6 13 8 7 12 6 8 | 11 6 9 | 10 5 10 | 10 5 11 | | 9 5 12 8 5 13 | | 7 5 14 7 4 15 | 7 | 4 16 7 4 17 7 4 18 | | | 7 | 4 19 7 | 4 20 | 6 | | 4 6 4 | 1 (n) 30 ( | ) Figure 2-2-1
Table 2-2-2 ( ) (n=83) (n=1296) 1 | 29 | | 319 2 6 | | | 163 3 6 | 127 4 6 125 5 5 63 6 5 | | 57 7 5 51 8 5 46 9 5 44 10 4 | | | 43 11 | 4 | 41 12 4 | | | 35 13 4 33 14 3 33 15 3 32 16 3 | 29 17 3 | | 28 18 3 28 19 | 3 27 20 3 | | | | 26 3 26 26 3 1 Table 2-2-2 20 Table 2-2-3 20 Table 2-2-2 20 4 20 Table 2-2-3
Table 2-2-3 20 (n=211) (n=102) 1 30 2 3 19 4 (13 18) 26 5 6 7 19 8 18 10 9 14 9 10 14 8 11 13 7 12 ( ) 9 7 13 (6 12) 8 7 14 ( ) 8 5 15 8 5 16 7 ( ) 5 17 7 ( ) 4 18 7 ( , ) 4 19 ( ) 7 4 20 ( ) 7 4 4 ( ) 4 4 1 (n) ( : 40 26) ( : 17 29; : 13 20) ( 246 243) 4
Table 2-2-3 ( ) (n=83) (n=1296) 1 50 2 41 3 34 4 ( ) 24 5 6 (45 64) 137 7 ( ) 12 87 8 ( ) 78 9 9 75 10 9 71 11 9 59 12 9 53 13 8 (65 79) 52 14 51 15 ( ) 51 16 7 42 17 7 41 18 (45 64) 6 ( ) 41 19 5 ( ) 36 20 5 Ethanol 36 5 5 5 2 1 (5 ) ( ) ( ) ( ) ( ) (13-18 ) (6-12 )
( ) ( ) ( 1999) 3 ( ) (65-79 ) (52 ) (65-79 ) (43 ) (45-64 ) (43 ) (36 ) (19-44 ) (36 ) (16 ) (19-44 ) (45-64 ) (65-79 ) 2 (65-79 ) 4 ( )
( ) 4 5 30 Table 2-2-4 1 2 3 52.57 26.24 21.19 2 Figure 2-2-2 Figure 2-2-2 1 2 20 Figure 2-2-2 1 3 1 0 1 2 0
Table 2-2-4 8 54 1004 8 10 21 924 13 7 127 374 4 13 67 389 15 4 13 205 21 5 22 110 7 8 20 81 21 4 12 101 11 2 9 111 4 22 14 75 14 2 15 92 2 2 3 92 12 0 9 50 32 1 11 78 0 3 14 69 1 7 5 65 9 47 1 35 0 3 12 50 8 1 6 61 4 1 11 50 5 4 16 46 0 3 7 54 2 3 9 48 3 0 11 51 0 0 2 57 1 1 6 51 1 0 25 34 0 0 19 34 1 3 4 45 1 8 4 39 0 0 Table 2-2-2 1983
!6# !5# !4# !3# !2# !1# 0# 1# 2# !1# 0# 1# 2# 3# 4# 5# 6# 7# 8# 2" 1" !3# !2# !1# 0# 1# !1# !0.5# 0# 0.5# 1# 1.5# 2# 2.5# 3# 2" 1" !3# !2# !1# 0# 1# 2# 3# 4# !1# 0# 1# 2# 3# 4# 5# 6# 7# 8# 3" 1" !1# !0.8# !0.6# !0.4# !0.2# 0# 0.2# 0.4# 0.6# 0.8# 1# !1# !0.5# 0# 0.5# 1# 1.5# 2# 2.5# 3# 3" 1" !3# !2# !1# 0# 1# 2# 3# 4# !6# !5# !4# !3# !2# !1# 0# 1# 2# 3" 2" !1# !0.8# !0.6# !0.4# !0.2# 0# 0.2# 0.4# 0.6# 0.8# 1# !2# !1.5# !1# !0.5# 0# 0.5# 1# 3" 2"
3
1
addiction
addiction
“misuse” “abuse” “addiction” “dependence” 2
2
2
2010 PubMed (
; US National Library of Medicine)
36 National
Library of Medicine (NLM) Catalog
(Table 2-3-1)
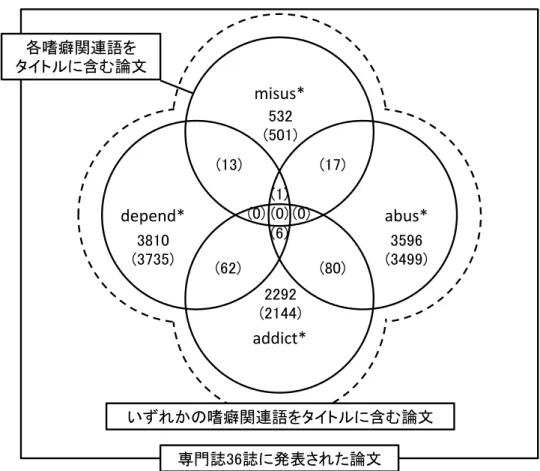
36 PubMed
2011 4 5
“dose dependent” “child abuse”
269
“misus*” 532 “abus*” 3596 “addict*” 2292
“depend*” 3810
Table 2-3-1 36
→ Addict Behav
Addict Biol
Addict Disord Their Treat
Addict Res Theory
Addiction Br J Addict Br J Addict Alcohol Other Drugs
Alcohol Alcohol Drug Res Subst Alcohol Actions Misuse
Alcohol Alcohol Alcohol Clin Exp Res Am J Addict
Am J Drug Alcohol Abuse
Curr Drug Abuse Rev
Cyberpsychol Behav
Soc Netw Cyberpsychol Behav
Drug Alcohol Depend Drug Alcohol Rev Eur Addict Res Eur Eat Disord Rev Harm Reduct J Int J Drug Policy
“misus–misusage” “program–programm” “behavior– behaviour” “compar–comparison” “drink–drinker” “smoke–smoker” “therapi–therapeut” “treat–treatment”
( )
“letter” “comment” “commentari” “editori” “studi” “review” “research” “report” “survei” “analysi” “meta-analysis”
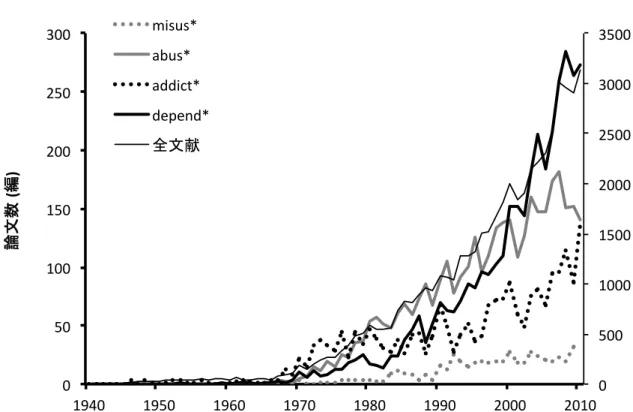
30 Figure 2-3-1 Figure 2-3-2 “misus*” 5 1981 1981–1985 1986–1990 1991–1995 1996–2000 2001–2005 2006–2010 6 “abus*” “addict*” “depend*”
Table 2-3-1 ( ) → Int J Eat Disord
J Addict Dis Adv Abuse Alcohol Subst
J Addict Med J Drug Issues
J Ethn Subst Abuse Drugs Soc (New York) J Ethn Subst Abuse
J Gambl Stud
J Psychoactive Drugs J Psychedelic Drugs J Soc Work Pract
Addict
J Stud Alcohol Drugs J Stud Alcohol Q J Stud Alcohol
J Subst Abuse Treat Nicotine Tob Res
Psychol Addict Behav Subst Abus
Subst Abuse
Subst Abuse Treat Prev Policy
Subst Use Misuse Int J Addict
Tob Control Tob Induc Dis
30 13 “abus*” “addict*” “depend*” 13 3 1 Table 2-3-2 20
“alcohol*” “drug*” “treat*” “us*” “effect*” “patient*”
“musus*” “prescript*” “intervent*” “servic*” “social*”
“chang*” “young*” “health*” “abus*”
“risk*” “compar*”
“addict*” “heroin*” “methadon*” “opiat*” “narcot*” “sever*”
“mainten*” “clinic*” “internet*” “therap*” “addict*”
Figure 2-3-1. 36 2 30 Table 2-3-3 1 2 3 62.41 34.51 3.07 2 Figure 2-3-3 “misus*” “abus*”
“substanc*” “adolesc*” “addict*”
“depend*”
“substanc*” “addict*”
“behavior*” “addict*” “depend*”
“behavior*“
3
“abus*” “addict*” “depend*”
13 Table 2-3-4
misus*
abus*
addict* depend*
Figure 2-3-2. 1 2 3 53.29 30.75 11.93 13 Figure 2-3-4 “abus*” 80 90 “adolesc*“ 90 1 “drug*” “substanc*”
“addict*” “heroin*” “behavior*”
“depend*” “abus*”
“addict*”
Figure 2-3-4
“abus*” “substanc*” “drug*”
Figure 2-3-5 “addict*”
“behavior*” “heroin*” Figure 2-3-6
Figure 2-3-5 “abus*” “substanc*”
“drug*” Figure 2-3-6 "addict*" “behavior*” “heroin*“ 0" 500" 1000" 1500" 2000" 2500" 3000" 3500" 0" 50" 100" 150" 200" 250" 300" 1940" 1950" 1960" 1970" 1980" 1990" 2000" 2010" ( ) misus*" abus*" addict*" depend*"
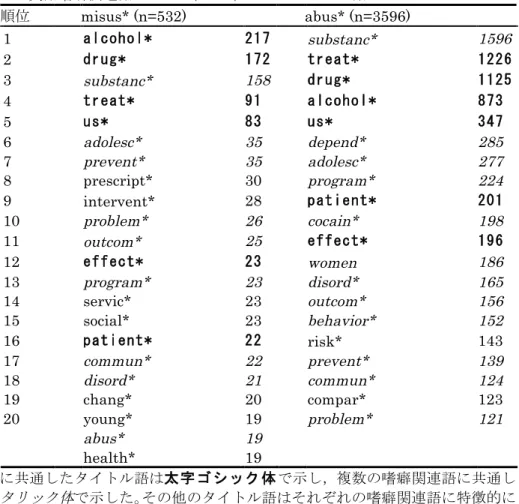
Table 2-3-2 20 misus* (n=532) abus* (n=3596) 1 substanc* 1596 2 3 substanc* 158 4 5 6 adolesc* 35 depend* 285 7 prevent* 35 adolesc* 277 8 prescript* 30 program* 224 9 intervent* 28 10 problem* 26 cocain* 198 11 outcom* 25 12 women 186 13 program* 23 disord* 165 14 servic* 23 outcom* 156 15 social* 23 behavior* 152 16 risk* 143 17 commun* 22 prevent* 139 18 disord* 21 commun* 124 19 chang* 20 compar* 123 20 young* 19 problem* 121 abus* 19 health* 19 1 (n)
“alcohol*” “drug*” “treat*” “us*” “effect*” “patient*”
“us*” use ( )
“substance use ( )” “cocaine use ( )”
“drug*” “alcohol*” “alcohol*” ( 2007) “treat*” “patient*” “effect*” “effect*”
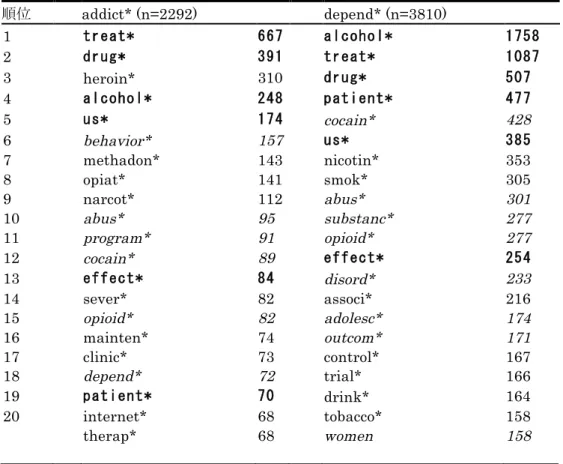
Table 2-3-2 ( ) addict* (n=2292) depend* (n=3810) 1 2 3 heroin* 310 4 5 cocain* 428 6 behavior* 157 7 methadon* 143 nicotin* 353 8 opiat* 141 smok* 305 9 narcot* 112 abus* 301 10 abus* 95 substanc* 277 11 program* 91 opioid* 277 12 cocain* 89 13 disord* 233 14 sever* 82 associ* 216 15 opioid* 82 adolesc* 174 16 mainten* 74 outcom* 171 17 clinic* 73 control* 167 18 depend* 72 trial* 166 19 drink* 164 20 internet* 68 tobacco* 158 therap* 68 women 158 “musus*” “prescript*” “intervent*” “servic*” “social*” “chang*” “young*”
“health*” “prescript* (prescription; )” “intervent* ( )”
“misus*”
misuse “abus*”
“risk*” “compar*”
“abus*” “misus*” “addict*” “depend*”
“abus*”
“addict*” “heroin*” “methadon*” “opiat*” “narcot*” “sever*”
“mainten*” “clinic*” “internet*” “therap*”
Table 2-3-3
abus* addict* depend* misus*
treat* 1122 626 1009 81 alcohol* 760 228 1489 192 drug* 1050 367 455 153 substanc* 1551 64 255 152 us* 330 169 363 82 patient* 200 67 467 22 cocain* 186 84 377 7 effect* 193 84 248 23 adolesc* 266 36 171 34 heroin* 43 299 127 5 behavior* 151 152 154 14 disord* 156 65 221 21 opioid* 55 79 266 10 program* 219 87 77 23 nicotin* 11 55 333 1 outcom* 154 56 166 21 women 178 45 154 16 smok* 51 53 250 4 associ* 93 34 213 16 compar* 122 63 145 12 clinic* 115 72 139 10 risk* 140 42 120 17 methadon* 55 139 113 7 predict* 113 46 134 13 opiat* 28 138 122 7 control* 66 45 166 9 between 94 38 133 18 problem* 118 48 90 26 commun* 122 63 76 20 therap* 106 67 96 10 “addict*” “internet*” 3 Internet addiction “addict*” “substanc* (substance; )” “addict*”
“depend*” “nicotin*” “smok*” “associ*” “control*”
“trial*” “drink*” “tobacco*” “nicotin*
(nicotine; ) “smok* ( )” “tobacco* ( )” “depend*”
“depend*”
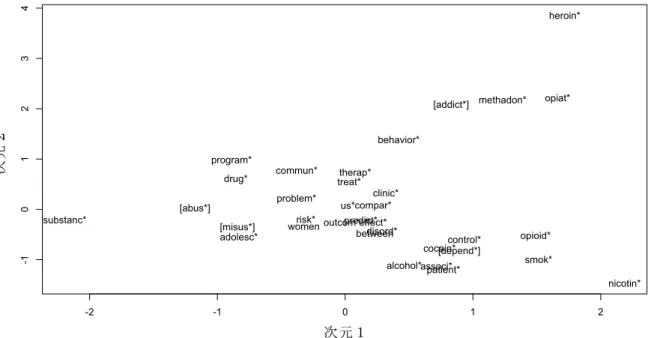
Figure 2-3-3. “addict*” “depend*” “substanc*” “addict*” “addict*” “substanc*”
1 “substanc*” “adolesc*” “misus*”
“abus*” “cocain*” “patient*” “addict*”
“depend*” 1
2
“addict*” “addict*”
“substanc*” “adolesc*” “outcom*” “disord*”
“misus*” “abus*” “depend*” 2 “addict*”
“behavior*” “abus*” “addict*”
“abus*” “addict*”
“abus*” “addict*” “behavior*”
152 157 “addict*” “addict*” “abus*” “behavior*” “addict*” “depend*” “behavior*” 1 -2 -1 0 1 2 -1 0 1 2 3 4 RawEngb[, 1] R aw En gb [, 2] treat* alcohol* drug* substanc* us* patient* cocain* effect* adolesc* heroin* behavior* disord* opioid* program* nicotin* outcom* women smok* associ* compar* clinic* risk* methadon* predict* opiat* control* between problem* commun* therap* [abus*] [addict*] [depend*] [misus*] 2
Table 2-3-4 13
treat* alcohol* substanc* drug* us* patient*
abus*81 63 91 71 129 14 6 abus*86 79 113 104 135 20 17 abus*91 107 137 185 134 37 31 abus*96 220 117 306 151 54 59 abus*01 254 135 385 167 78 36 abus*06 320 106 448 156 102 39 addict*81 39 20 1 39 11 6 addict*86 46 28 2 50 17 2 addict*91 61 22 7 40 17 8 addict*96 99 27 12 40 25 9 addict*01 96 22 13 42 20 8 addict*06 154 27 23 56 45 21 depend*81 26 37 2 24 6 5 depend*86 70 95 5 56 10 15 depend*91 102 151 14 48 24 37 depend*96 144 246 51 69 61 80 depend*01 269 355 61 68 85 125 depend*06 327 499 104 113 156 165 2 81 1981– 1985 86 1986–1990 91 1991–1995 96 1996–2000 01 2001–2005 06 2006– 2010
“abus*” “addict*” “depend*”
13 “abus*” 1
“drug*” “substanc*” “addict*”
“heroin*” “behavior*”
“abus*” “addict*”
“drug*” “heroin*” “substanc*” ”behavior*”
“abus*”
“substanc*” “drug*” “addict*”
“behavior*” “heroin*”
“abus*” “substanc*”
“drug*”
“abus*” “durg*” “substanc*”
"addict*" “heroin*“ “behavior*” "addict*" “behavior*” “heroin*” “addict*” “behavior*” addiction “addict ( )” ( 2013) “addict*”
Table 2-3-4 ( )
cocain* effect* adolesc* behavior* women heroin* clinic*
abus*81 8 10 16 7 9 5 14 abus*86 19 11 19 15 12 3 11 abus*91 44 24 29 17 15 2 16 abus*96 41 41 32 39 51 7 12 abus*01 39 44 67 29 34 6 22 abus*06 32 41 83 33 48 8 32 addict*81 4 7 0 7 6 40 6 addict*86 11 9 0 22 2 28 3 addict*91 16 8 3 7 6 33 9 addict*96 27 14 2 26 6 36 12 addict*01 6 16 8 25 3 28 11 addict*06 19 13 21 46 15 31 22 depend*81 1 10 2 3 2 1 4 depend*86 14 15 8 10 13 2 14 depend*91 42 15 7 8 20 3 20 depend*96 77 40 20 12 30 8 20 depend*01 107 62 49 43 39 37 27 depend*06 120 92 77 60 40 55 45 Figure 2-3-4. 13 2 “abus*” “addict*” !5# !4# !3# !2# !1# 0# 1# 2# !3# !2# !1# 0# 1# 2# 3# !2 !1 13 15 24 5 6 2 1 3 4 11 12 7 10 8 9 19 20 21 22 23 25 26 27 28 29 30 31 14 16 17 18 !5# !4# !3# !2# !1# 0# 1# 2# !3# !2# !1# 0# 1# 2# 3# !2 !1 abus* substanc* drug* behavior* heroin* addict* 1981 2010 1981 2010
Figure 2-3-5. “abus*” “substance*” “drug*” “substanc*” “drug*”
“abus*”
Figure 2-3-6. “addict*” “behavior*” “heroin*”
“behavior*” “heroin*” “addict*” “behavior*” “pathological gambling” ( ) 0.00% 5.00% 10.00% 15.00% 20.00% 25.00% 30.00% 35.00% 0 100 200 300 400 500
abus*81 abus*86 abus*91 abus*96 abus*01 abus*06
(
)
substanc* drug* substanc* % drug* %
0.00% 5.00% 10.00% 15.00% 20.00% 25.00% 0 10 20 30 40 50
addict*81 addict*86 addict*91 addict*96 addict*01 addict*06
(
)
4 Internet addiction (1) 1
Internet addiction
Kraut et al. (1998)
(Block, 2008; O’ Brien, 2010; Pies, 2009; Tao et al., 2010) Internet addiction Internet addiction 2 ( 1994a; 1994b; 1995; 1994) Internet addiction Internet addiction
Carbonell et al. (2009) Carbonell et
al. ( ) ( ) Internet addiction (Block, 2008) ( ) Carbonell (26 ) 2 Internet addiction
PubMed (MESH term)
Internet addiction 2
2 1
(American Psychological Association)
PsycINFO 1 (US
National Library of Medicine) PubMed
Internet addiction
2012 2 3
Table 2-4-1 1
Sussman et al. (2011)
( “Pathological Internet use in young Internet
addicts” “pathological Internet us” “Internet
addict” 2 ) PsycINFO PubMed 286 PsycINFO 131 PubMed 46 PsycINFO PubMed 109 162 PsycINFO 122 PubMed 36 PsycINFO PubMed 4 286 1 161 TinyTextMiner ( 2009) 2 1 PsycINFO
Internet depend* 29 Internet addict* 338
Internet misus* 9 Internet abus* 27 web addict* 0
Pathological Internet us* 25 Internet overus* 5 excessive
Internet us* 37 compulsive Internet us* 23 problematic Internet
us* 81
2 TinyTextMiner letter comment
commentari editori studi review research report survei
analysi meta-analysis associ between relationship relat
misus misusage program
Table 2-4-1
PsycINFO PubMed PsycINFO PubMed
Internet depend* 11 7 4 1
Internet addict* 144 136 96 35
Internet misus* 1 0 0 0
Internet abus* 9 1 1 0
pathological Internet us* 8 3 16 2
Internet overus* 2 2 0 0
excessive Internet us* 12 3 5 4
compulsive Internet us* 11 1 1 0
problematic Internet us* 52 2 5 0
250 155 128 42 240 155 126 40 * “web addict*” 1 PsycINFO PubMed PsycINFO 240 (131 + 109 ) 126 (122 + 4 ) PsycINFO AG
(Age Group; ) PO (Population; ) MS (Word in Major
Subject Headings; )
TM (Test & Measures; )
Table 2-4-2 PsycINFO PubMed 1 internet* 131 (100.0) 109 (100.0) 46 (100.0) 2 addict* 52 (39.7) 92 (84.4) 44 (95.7) 3 us* 76 (58.0) 16 (14.7) 3 (6.5) 4 adolesc* 18 (13.7) 29 (26.6) 11 (23.9) 5 problemat* 52 (39.7) 3 (2.8) 2 (4.3) 6 student* 19 (14.5) 17 (15.6) 7 (15.2) 7 disord* 5 (3.8) 13 (11.9) 9 (19.6) 8 colleg* 8 (6.1) 11 (10.1) 2 (4.3) 9 behavior* 8 (6.1) 8 (7.3) 2 (4.3) 9 factor* 6 (4.6) 9 (8.3) 3 (6.5) 11 onlin* 7 (5.3) 7 (6.4) 1 (2.2) 11 symptom* 4 (3.1) 7 (6.4) 4 (8.7) 13 diagnos* 5 (3.8) 8 (7.3) 2 (4.3) 14 depress* 7 (5.3) 6 (5.5) 1 (2.2) 14 predict* 9 (6.9) 3 (2.8) 2 (4.3) 16 excess* 8 (6.1) 5 (4.6) 0 (0.0) 30 46.84% 69.70% TM 3 1 628 2214 30 1076 48.60% Table 2-4-2 318 1139 30 694 60.93% Table 2-4-3 Table 2-4-2 2-4-3 “us*” 3 ( 95 ; Table 2-4-2) 5 ( 33 ; Table 2-4-3)
problematic Internet use use
(Table 2-4-2)
Table 2-4-2 ( ) PsycINFO PubMed 16 self* 8 (6.1) 5 (4.6) 0 (0.0) 16 univers* 7 (5.3) 2 (1.8) 4 (8.7) 16 effect* 7 (5.3) 3 (2.8) 3 (6.5) 20 preval* 1 (0.8) 9 (8.3) 2 (4.3) 20 psychiatr* 2 (1.5) 7 (6.4) 3 (6.5) 20 compuls* 11 (8.4) 1 (0.9) 0 (0.0) 23 scale* 5 (3.8) 5 (4.6) 1 (2.2) 23 depend* 4 (3.1) 7 (6.4) 0 (0.0) 23 abus* 9 (6.9) 2 (1.8) 0 (0.0) 23 chines* 5 (3.8) 4 (3.7) 2 (4.3) 27 problem* 3 (2.3) 5 (4.6) 2 (4.3) 27 school* 6 (4.6) 3 (2.8) 1 (2.2) 27 psycholog* 5 (3.8) 5 (4.6) 0 (0.0) 27 sampl* 3 (2.3) 6 (5.5) 1 (2.2) 27 patholog* 6 (4.6) 4 (3.7) 0 (0.0)
use “problemat* ( 57 ; problematic Internet use)” “excess* (
13 ; excessive Internet use)” “compuls* ( 12 ; compulsive Internet use)”
“patholog* ( 10 ; pathological Internet use)”
“depend* ( 11 ; Internet depend)” “abus*
( 11 ; Internet abuse)” Carbonell et al. (2009)
PubMed Internet addiction
“addict*” “us*” PubMed “addict” PsycINFO “us” PubMed PsycINFO addiction use 3 addiction ( ) addiction
compulsive Internet use
Table 2-4-3 PsycINFO PubMed 1 internet* 121 (100.0) 4 (100.0) 36 (100.0) 2 addict* 92 (76.0) 3 (75.0) 32 (88.9) 3 student* 38 (31.4) 0 (0.0) 7 (19.4) 4 disord* 26 (21.5) 2 (50.0) 10 (27.8) 5 us* 25 (20.7) 1 (25.0) 7 (19.4) 6 adolesc* 22 (18.2) 0 (0.0) 9 (25.0) 7 colleg* 20 (16.5) 0 (0.0) 1 (2.8) 8 school* 15 (12.4) 0 (0.0) 5 (13.9) 9 patholog* 16 (13.2) 0 (0.0) 3 (8.3) 10 behavior* 12 (9.9) 0 (0.0) 3 (8.3) 11 middl* 10 (8.3) 0 (0.0) 3 (8.3) 12 effect* 8 (6.6) 0 (0.0) 4 (11.1) 13 scale* 9 (7.4) 1 (25.0) 1 (2.8) 14 characterist* 8 (6.6) 1 (25.0) 1 (2.8) 15 factor* 6 (5.0) 0 (0.0) 3 (8.3) 15 social* 9 (7.4) 0 (0.0) 0 (0.0) 15 psycholog* 7 (5.8) 0 (0.0) 2 (5.6) 30 (8 ) 2 3
dependence addiction misuse abuse
abuse 3 (misuse addiction
dependence) addiction
“problemat*” “addict*” addiction
2 3 addiction
(Table 2-4-3) “addict* ( 127 ; Internet
addiction)” use “patholog* ( 19 ;
pathological Internet use)” “excess* ( 9 ; excessive Internet use)”
“addict*”
“addict*” “us*”
PsycINFO PubMed
Table 2-4-3 ( ) PsycINFO PubMed 15 excess* 5 (4.1) 0 (0.0) 4 (11.1) 19 treat* 6 (5.0) 1 (25.0) 1 (2.8) 19 develop* 6 (5.0) 0 (0.0) 2 (5.6) 19 person* 5 (4.1) 1 (25.0) 2 (5.6) 19 high* 6 (5.0) 0 (0.0) 2 (5.6) 23 cope* 7 (5.8) 0 (0.0) 0 (0.0) 23 patient* 4 (3.3) 0 (0.0) 3 (8.3) 23 style* 6 (5.0) 0 (0.0) 1 (2.8) 23 cognit* 6 (5.0) 0 (0.0) 1 (2.8) 27 health* 4 (3.3) 0 (0.0) 2 (5.6) 27 case* 5 (4.1) 0 (0.0) 1 (2.8) 27 famil* 5 (4.1) 0 (0.0) 1 (2.8) 27 diagnos* 5 (4.1) 0 (0.0) 1 (2.8) 27 tendenc* 5 (4.1) 0 (0.0) 1 (2.8) 27 valid* 4 (3.3) 1 (25.0) 1 (2.8) 27 intervent* 5 (4.1) 0 (0.0) 1 (2.8) ( 7 Table 2-4-2; 4 Table2-4-3)
Internet addiction disorder
“adolesc* (PsycINFO PubMed
PsycINFO PubMed 58
)” “student* ( 43 )” “colleg* ( 21 )” “univers* (
13 )” “school* ( 10 )”
“colleg*” × “student*” (college student;
21 ) “univers*” × “student*” (university student; 11 )
“student* ( 45 )” “adolesc* ( 31 )” “colleg* ( 21
)” “school* ( 20 )” “middle* ( 13 )” “high* ( 8 )”
“middl*” × “school*”
(middle school; 13 )
PsycINFO
(Table 2-4-2) “symptom* ( 15 )” “depress* (
(Table 2-4-2) “preval* ( 12 ; )” “sampl* ( 10 ; )” (Table 2-4-2) “chines* ( 11 )” Internet addiction 2 (PsycINFO )
Chinese (85 ) German (11 ) Turkish (11 )
French (6 ) Spanish (6 ) Italian (2 ) Danish (1 ) Dutch (1 )
Greek (1 ) Japanese (1 ) Serbo-Croatia (1 )
1
Internet addiction (Block, 2008) PsycINFO
2012 2–3 2011
2010
Internet addiction Figure
2-4-1 Internet addiction Internet addiction 2000 0 2009 2009 2010 Internet addiction Table 2-4-4 Neonatal ( ) Infancy (2–23
) Preschool Age (2–5 ) 0 Aged (65 ) Very Old
(85 ) 0
Childhood ( 12 ) School Age (6–
12 ) Adolescence (13–17 ) Adolthood (18 )
Young Adulthood (18–29 ) Thirties (30–39 )
Middle Age (40–64 ) Internet
addiction Kraut et al. (1998) Internet
Figure 2-4-1. Internet addiction
Internet addiction Internet addiction
PsycINFO Table 2-4-5 Inpatient Outpatient Human Table 2-4-6 2-4-7 277 955 30 602 63.04% 152 502 30 364 0" 5000" 10000" 15000" 20000" 25000" 30000" 35000" 40000" 45000" 50000" 55000" 60000" 65000" 70000" 75000" 80000" 85000" 90000" 95000" 100000" 105000" 110000" 115000" 120000" 125000" 130000" 135000" 0" 5" 10" 15" 20" 25" 30" 35" 40" 1997" 1998" 1999" 2000" 2001" 2002" 2003" 2004" 2005" 2006" 2007" 2008" 2009" 2010" In te rn et &Ad di c+ on IA IA
Table 2-4-4 Table 2-4-5 (n = 240) (N = 126) Animal 0 (0.0) 0 (0.0) Human 239 (99.6) 126 (100.0) Male 172 (71.7) 24 (19.0) Female 163 (67.9) 23 (18.3) Inpatient 2 (0.8) 1 (0.8) Outpatient 2 (0.8) 2 (1.6) Internet Addiction ( 223 ) Internet ( 167 ) Addiction ( 111 ) Internet Usage ( 44 )
College Students ( 42 ) Adolescent Attitude ( 15
) Adolescent Development ( 14 ) High School Students ( 10 )
High School Students “high”
Loneliness ( 15 ) Comorbidity
( 15 ) Mental Disorders ( 14 ) Diagnosis ( 13 ) Risk Factors (
14 ) Personality Traits ( 13 ) Psychosocial Factors ( 13 )
Comorbidity Mental Disorders Diagnosis
“diagnos*” (Table 2-4-2 2-4-3)
(n = 240) (N = 126)
Childhood (birth-12 yrs) 26 (10.8) 14 (11.1)
Neonatal (birth-1 mo) 0 (0.0) 0 (0.0)
Infancy (2-23 mo) 0 (0.0) 0 (0.0)
Preschool Age (2-5 yrs) 0 (0.0) 0 (0.0)
School Age (6-12 yrs) 24 (10.0) 12 (9.5)
Adolescence (13-17 yrs) 94 (39.2) 43 (34.1)
Adulthood (18 yrs & older) 146 (60.8) 52 (41.3)
Young Adulthood (18-29 yrs) 91 (37.9) 9 (7.1)
Thirties (30-39 yrs) 43 (17.9) 3 (2.4)
Middle Age (40-64 yrs) 30 (12.5) 2 (1.6)
Aged (65 yrs & older) 12 (5.0) 0 (0.0)
DSM-5 Internet addiction
Epidemiology ( 19 ) Psychometrics ( 17 )
Test Validity ( 19 ) Test Reliability ( 16 ) Internet
addiction
“scale*” ( 23 Table 2-4-2; 13
Table 2-4-3) “valid*”
( 27 Table 2-4-3) Epidemiology
(Table 2-4-6)
(Information and Communication Technology: ICT) Human Computer Interaction Communication Technology
Compulsion Impulse Control Disorders Attention Deficit Disorder with Hyperactivity “compuls*”
Major Depression Well Being
Human Sex Differences Behavior
Problems Internet addiction
(Table 2-4-7) Middle School Students Student
Attitude
Cognitive Behavior Therapy Mental Health Intervention Psychopathology Pathology Treatment Psychotherapy
Interpersonal Relationships Social Support Home Environment
Attachment Behavior Internet addiction
3
PsycINFO Internet addiction
Table 2-4-6 1 Internet Addiction 140 (58.3) 2 Internet 109 (45.4) 3 Addiction 72 (30.0) 4 Internet Usage 34 (14.2) 5 College Students 19 (7.9) 6 Epidemiology 16 (6.7) 7 Major Depression 15 (6.3) 8 Adolescent Attitudes 11 (4.6) 9 Psychometrics 10 (4.2) 9 Loneliness 10 (4.2) 9 Comorbidity 10 (4.2) 9 Mental Disorders 10 (4.2) 9 Diagnosis 10 (4.2) 14 Test Validity 9 (3.8) 14 Adolescent Development 9 (3.8) 14 Risk Factors 9 (3.8) Table 2-4-7 1 Internet Addiction 83 (65.9) 2 Internet 58 (46.0) 3 Addiction 39 (31.0) 4 College Students 23 (18.3) 5 Internet Usage 10 (7.9) 5 Test Validity 10 (7.9)
5 Middle School Students 10 (7.9)
8 Test Reliability 8 (6.3) 9 Psychometrics 7 (5.6) 9 Coping Behavior 7 (5.6) 11 Test Construction 6 (4.8) 12 Loneliness 5 (4.0) 12 Comorbidity 5 (4.0) 12 Adolescent Development 5 (4.0) 12 Risk Factors 5 (4.0) 12 Personality Traits 5 (4.0) 12 Psychosocial Factors 5 (4.0)
Table 2-4-6 ( )
14 Human Computer Interaction 9 (3.8)
18 Test Reliability 8 (3.3)
18 Personality Traits 8 (3.3)
18 Psychosocial Factors 8 (3.3)
18 Computer Games 8 (3.3)
18 Well Being 8 (3.3)
23 High School Students 7 (2.9)
23 Human Sex Differences 7 (2.9)
23 Compulsions 7 (2.9)
23 Communication 7 (2.9)
27 Behavior Problems 6 (2.5)
27 Impulse Control Disorders 6 (2.5)
29 Coping Behavior 5 (2.1)
29 Attention Deficit Disorder with Hyperactivity 5 (2.1)
29 Self Esteem 5 (2.1) 29 Technology 5 (2.1) Table 2-4-7 ( ) 12 Mental Health 5 (4.0) 12 Interpersonal Relationships 5 (4.0) 12 Student Attitudes 5 (4.0) 12 Intervention 5 (4.0) 23 Adolescent Attitudes 4 (3.2) 23 Mental Disorders 4 (3.2) 23 Psychopathology 4 (3.2) 23 Pathology 4 (3.2) 23 Treatment 4 (3.2) 23 Social Support 4 (3.2) 29 Epidemiology 3 (2.4) 29 Diagnosis 3 (2.4) 29 Computer Games 3 (2.4)
29 High School Students 3 (2.4)
29 Behavior Disorders 3 (2.4)
29 Home Environment 3 (2.4)
29 Psychotherapy 3 (2.4)
2 Internet addiction PsycINFO Internet addiction AF (Author Affiliation; ) PsycINFO PubMed PsycINFO PubMed PubMed
MESH term Behavior, Addictive Internet
PsycINFO Descriptor Internet
addiction
(Zeeb et al., 2009) Internet addiction
Dong et al. (2011) fMRI
Internet addiction addiction
5 Internet addiction (2) 1
2 4 Internet addiction
(TM)
Young (1998b)
Young Internet addiction
Diagnostic Questionnaire for Internet Addiction (DQ)
(Table2-5-1) Young DQ 8 5
Internet addiction ( )
3 4 Internet addiction
(Dowling 2009)
Tao et al. (2010) Young DQ 8
8 1) ( ) 2) 3) 4) 5) 6) , 7) , 8) Internet addiction Young (Young 1998b; 2007) Tao
Tao et al. DSM-IV-TR
Table 2-5-2
Tao et al. (APA) DSM-5
(American Psychiatric Association, 2011) Internet
addiction
DSM-5 Internet addiction “Conditions for
Further Study” “Internet Gaming Disorder ( :
) ” ( A m e r i c a n P s y c h i a t r i c
Table 2-5-1
Diagnostic Questionnaire for Internet Addiction: DQ
1. ( ) 2. 3. 4. 5. 6. 7. 8. ( : ) ( 2007 ) Table 2-5-2 Tao et al. (2010) A. : (1) ( ) (2) 1 ( ): (1) (2) / (3) (4) (5) ( : ) B. I C. ( ) D. 3 1 ( ) 6
Table 2-5-3 DSM-5 5 ( ) 12 : 1. ( ; ) 2. ( ) 3. –– 4. 5. 6. 7. 8. ( ) 9. ;
APA Internet addiction
DSM-5 Internet Gaming Disorder
2
20 Internet addiction
(2007) DQ
: IAT
20
Widyano et al. (2011) IAT IRPS
:
Internet addiction 1) / (loneliness/depression) 2)
(diminished impulse control) 3) (distraction) 4)
(social comfort) 4
OCS
:
1) (Compensatory Escape) 2) (Dissociation) 3)
(Real Life Impact) 4) (Experience Making) 5)
(Addiction) 5
Gnisci
: Young (1998b) IAT DSM-IV
OCS Internet addiction
IAT IRPS
IAT
6 2 2 ( 2 ) “addiction” “behavior” ( 3 ) 1 “addiction” “addiction” “abuse” “abuse” “misuse” “abuse” 4 Internet addiction “addiction” “dependence” “addiction” “dependence” “addiction” 1 1
DSM-5 (American Psychiatric Association, 2013) “abuse ( )”
3 “internet*” “addict*” Internet addiction 2 5 3 1) 2)
3
1 1 Internet addiction 1 2012 9,652 79.5% ( 2013) 2 1 Khantzian Albanese (self-medication hypothesis)(Khantzian, 1975; Khantzian & Albanese, 2008 2013)
1) 2)
1 Shaffer et al. (2004)
(syndrome model of addiction) 1) 2) 3) ( ) ( ) 2 Internet addiction Web
3) (availability) Web Web 3 1) 2) 3) Internet addiction 2 1 2 ( 1 4 ) Internet addiction 1)
2) Ten Item Personality Inventory
(TIPI-J) 3) BIS/BAS 4)
5) Japanese version of the Barratt Impulsiveness Scale, 11th version (BIS-11) 6)
(EC) 7) 8) 3 IA IA t (Table 3-1-1) 5 TIPI IA IA ( p < .05; p < .01; p < .01) (p < .01)
BIS/BAS BIS BAS IA
IA ( p < .01) BAS IA IA ( p < .01; p < .05; p < .01) IA IA t (Table 3-1-2) IA IA ( p < .05; p < .01)
Table 3-1-1 IA IA * p < .05; ** p < .01 Table 3-1-2 IA IA * p < .05; ** p < .01 Table 3-1-3 IA IA IA IA n = 51 SD n = 188 SD df = 237 t TIPI 6.82 2.61 7.70 2.48 2.21* TIPI 8.49 2.85 10.20 1.76 5.32** TIPI 7.10 3.10 8.52 2.31 3.59** TIPI 9.22 2.59 7.57 2.19 –4.55** TIPI 8.55 2.78 8.43 2.07 –0.35 BIS 21.55 4.37 18.97 3.96 –4.03** BAS 37.98 6.56 34.65 4.86 –4.00** BAS 11.49 2.72 10.59 1.99 –2.65** BAS 15.25 2.73 14.38 2.37 –2.26* BAS 11.24 2.46 9.69 1.89 –4.85** IA n = 51 IA n = 188 df = 237 SD SD t 3.59 0.64 3.37 0.63 –2.22* 3.45 0.67 3.11 0.72 –3.09** 3.35 0.77 2.88 0.86 –3.58** 3.49 0.70 2.76 0.89 –5.47** 2.84 1.03 2.02 0.84 –5.92** 3.06 0.90 2.38 0.90 –4.81** 3.06 0.90 2.59 0.82 –3.58** 3.49 0.73 3.09 0.76 –3.42** IA n = 51 IA n = 188 df = 237 SD SD t BIS-11 68.73 12.70 60.90 10.10 –4.63** EC 87.18 17.36 98.26 12.73 5.07** EC 29.31 5.57 31.73 4.04 3.48** EC 30.20 7.23 34.76 5.00 5.20**
IA IA t (Table 3-1-3) BIS-11 IA IA (p < .01) EC IA IA ( p < .01) ( : F(1, 237) =15.10, p < .01; : F(3, 711) = 587.49, p < .01) (F(3, 711) = 4.02, p <.01) ( ) IA IA ( p < .01; Figure 3-1-1) ( : F(1, 237) =19.09, p < .01; : F(3, 711) = 402.05, p < .01) (F(3, 711) = 7.29, p <.01) ( ) IA ( p < .01; Figure 3-1-2) 4 1) 2) 3) Internet addiction IA IA 5 TIPI-J IA IA Internet addiction 5
Engelberg & Sjöberg (2004) Big Five inventory
Internet addiction
5 Internet addiction
5 Internet addiction
McKenna & Bargh (1998)
(social compensation) McKenna & Bargh (1998)
** p < .01 ( ) Figure 3-1-1. 1 2 3 4 5 NetPlace2 me an o f Pl F rq
home rest trans work
IAPlFrq2 1 0 1 2 3 4 5 me an o f D evF rq
cell other pc smphone IAPlFrq2
1 0
BIS/BAS BIS ( )
BAS ( )
( 2007)
BIS BAS
Ko et al. (2006) Tridimensional Personality
Questionnaire
(Novelty Seeking; NS) (Harm
Avoidance; HA) (Reward Dependence)
IA IA BIS BAS BAS BIS IA IA Ko et al. (2006) Morahan-Martin (2009) Internet addiction BIS BAS Tridimensional
Personality Questionnaire Ko et al. (2006)
Ko et al. (2006) IA IA Piasecki et al. (2007) IA IA IA Internet addiction BIS-11 IA IA EC IA IA BIS-11 EC BIS-11 EC
IA IA IA IA IA IA ( 2000) 2 Internet addiction 1 1 1) 2) 3) Internet addiction 3 Sussman (2011) 11 1) 2) 3) 4) 5) 6) 7) 8) 9) 10) 11) 1) 2) 3) 4) 5) 5 1
Table 3-1-4 SD 1 1 1 2 1 1 3 1 1 4 2 2 ( 1 4 ) 3 1 (Table 3-1-4) 1 (Table 3-1-5; p < .01) 20 1 1 1 1 1 1 ± SD 160 46 12 21 1.56 ± 0.94 174 37 10 18 1.46 ± 0.89 176 36 10 17 1.45 ± 0.87 199 20 4 16 1.32 ± 0.81 165 58 8 8 1.41 ± 0.72 157 52 17 13 1.52 ± 0.85 187 37 8 7 1.31 ± 0.68 166 58 8 7 1.40 ± 0.70 193 24 4 18 1.36 ± 0.85 167 61 3 8 1.38 ± 0.68 195 32 5 7 1.26 ± 0.64 166 54 5 14 1.44 ± 0.80 127 76 18 18 1.69 ± 0.90 195 32 5 7 1.26 ± 0.64 224 12 0 3 1.09 ± 0.40
Table 3-1-5 ** p < .01 Table 3-1-6 0.81 0.21 0.08 0.03 0.14 0.04 0.78 0.16 0.01 0.33 0.09 -0.15 0.7 0.31 0.05 0.16 0.02 0.28 0.57 0.11 0.15 0.01 0.38 0.35 0.31 0.51 0.27 0.24 0.02 0.25 0.24 0.68 0.05 0.08 -0.22 0.35 0.22 0.72 0.19 0.2 0.01 0.09 0.16 0.73 0.19 0.2 0.26 -0.1 0.12 0.64 -0.06 0.05 0.59 0.05 0.21 0.09 0.76 0.15 0.2 0.13 -0.05 0.2 0.84 0.1 -0.01 -0.02 0.07 0.24 0.23 0.81 0.17 0.1 0.38 0.22 0.08 0.7 -0.05 0.21 0.16 0 0.15 0.09 0.83 0.05 95 % 99 % 21.78** 10.46–45.34 8.31–57.09 2.83** 1.56–5.14 1.29–6.20 7.86** 3.66–16.87 2.88–21.45 1.48 0.84–2.63 0.70–3.15 3.13** 1.78–5.52 1.49–6.59 3.84** 2.03–7.28 1.66–8.90 6.87** 3.73–12.63 3.08–15.29 21.31** 8.87–51.20 6.73–67.44 4.92** 2.72–8.91 2.25–10.74 5.61** 2.78–11.31 2.23–14.09 4.32** 2.40–7.76 1.99–9.34 4.52** 2.52–8.11 2.10–9.74 5.61** 2.78–11.31 2.23–14.09 6.31** 1.94–20.52 1.34–29.72
Figure 3-1-3. 0.0 0.2 0.4 0.6 0.8 0.0 0.2 0.4 0.6 comor1.2a[, 1] co mo r1 .2 a[ , 2 ] Internet TV alcohol coffee tobacco eating gambling gaming cell-phone love exercise working buying prescription drugs 0.0 0.2 0.4 0.6 0.8 0.0 0.2 0.4 0.6 0.8 comor1.3a[, 1] co mo r1 .3 a[ , 2 ] Internet TV alcohol coffee tobacco eating gambling gaming cell-phone love exercise working buying prescription drugs 0.0 0.2 0.4 0.6 0.8 0.0 0.2 0.4 0.6 0.8 comor1.4a[, 1] co mo r1 .4 a[ , 2 ] Internet TV alcohol coffee tobacco eating gambling gaming cell-phone love exercise working buyingprescription drugs 0.0 0.2 0.4 0.6 0.8 -0 .2 0.0 0.2 0.4 0.6 0.8 comor1.5a[, 1] co mo r1 .5 a[ , 2 ] Internet TV alcohol coffee tobacco eating gambling gaming cell-phone love exercise working buying prescription drugs 0.0 0.2 0.4 0.6 0.8 0.0 0.2 0.4 0.6 0.8 comor1.6a[, 1] co mo r1 .6 a[ , 2 ] Internet TV alcohol coffee tobacco eating gambling gaming cell-phone love exercise working buying prescription drugs
6 1 .17 2 .17 3 .10 4 .10 5 .09 6 .09 6 .72 Table 3-1-6 1 2 6 Figure 3-1-3 1 2 3 4 5 6 4 1 20 1 Internet addiction 1 1 Sussman et al. (2011)
6
2
1
Internet
addiction Internet
addiction
(Armstrong et al., 2000; Davis et al., 2002; Del Miglio et al. 2001; Meerkerk et al., 2009; Young 1998b)
Internet addiction
( Kim, et al., 2009; Young, 1998a)
Kraut et al. (1998)
( , 2004;
, 2005; Bessière et al., 2008; Jackson et al., 2006; Kraut et al., 2002; , 2008; Thomée et al., 2005; van den Eijnden et al., 2008)
(2009) (
BBS )
(Jackson et al., 2006)
DSM-5 (American Psychiatric Association, 2013)
“Conditions for Further Study” “Internet Gaming Disorder ( :
)” (Table 2-5-3 ) ( ) APA Internet addiction (Young 1998b; 2007)
Table 3-2-1 ( 1 ) 1 1 1 1 1 1 ± SD 52 133 217 597 3.36 ± 0.90 191 183 172 453 2.89 ± 1.18 470 226 122 181 2.01 ± 1.15 454 200 143 202 2.09 ± 1.18 632 116 83 168 1.79 ± 1.16 147 217 303 332 2.82 ± 1.05 194 179 267 359 2.79 ± 1.13 449 167 179 204 2.14 ± 1.19 SNS 513 164 94 228 2.04 ± 1.23 579 190 82 148 1.80 ± 1.10 SD 1 1 1 2 1 1 3 1 1 4 Table 3-2-2 ( 1 ) 1 1 1 1 1 1 ± SD 648 160 81 110 1.65 ± 1.02 734 132 58 75 1.47 ± 0.90 815 102 52 30 1.30 ± 0.70 822 108 38 31 1.28 ± 0.68 862 75 24 38 1.24 ± 0.68 691 147 94 67 1.54 ± 0.92 720 134 88 57 1.48 ± 0.88 840 83 37 39 1.27 ± 0.71 SNS 840 91 28 40 1.27 ± 0.70 839 94 29 37 1.26 ± 0.69 SD 1 1 1 2 1 1 3 1 1 4 2 1 ( 1 4 )
Table 3-2-3 ( ) 52 947 648 351 191 808 734 265 470 529 815 184 454 545 822 177 632 367 862 137 147 852 691 308 194 805 720 279 449 550 840 159 SNS 513 486 840 159 579 420 839 160 1) 2) 3) K6 4) 5) UCLA 6) 7) 8) 3 1 (10 ) Table 3-2-1 3-2-2 2 (Table 3-2-3) JIAT t / ( / : t(997) = –5.88, p < .01; / : t(997) = – 6.74, p < .01; / : t(997) = –11.73, p < .01; / : t(997) = –11.31, p <.01; / : t(997) = –11.88, p < .01; / : t(997) = –5.44, p < .01; / : t(997) = –8.93, p < .01; / : t(997) = – 4.88, p < .01; /SNS : t(997) = –10.16, p < .01; / : t(997) = –10.17, p < .01; / ): t(997) = –8.88, p < .01; / : t(997) = –7.88, p < .01; / : t(997) = –11.90, p < .01; / : t(997) = –10.73, p <.01; / : t(997) = –11.61, p < .01; / : t(997) = –7.15, p < .01; / : t(997) = –9.67, p < .01; / : t(997) = –6.13, p < .01;
Table 3-2-4 K6 K df = 997 t r / 8.81 ± 4.70 < 11.13 ± 5.17 –3.16** .13** 10.19 ± 4.99 < 11.20 ± 5.19 –2.44* .05 9.84 ± 4.33 < 12.04 ± 5.62 –6.86** .23** 9.89 ± 4.47 < 11.94 ± 5.52 –6.38** .18** 10.23 ± 4.67 < 12.34 ± 5.69 –6.33** .20** 9.93 ± 4.55 < 11.19 ± 5.25 –2.74** .10** 9.62 ± 4.26 < 11.34 ± 5.31 –4.20** .17** 10.71 ± 5.12 / 11.25 ± 5.20 –1.66 .07* SNS 10.32 ± 4.78 < 11.73 ± 5.46 –4.35** .13** 10.42 ± 4.80 < 11.81 ± 5.54 –4.23** .13** * p < .05; ** p < .01 Table 3-2-5 df = 997 t r / 2.77 ± 0.73 / 2.87 ± 0.65 –1.13 .01 2.86 ± 0.68 / 2.87 ± 0.65 –0.12 .03 2.91 ± 0.64 > 2.83 ± 0.66 2.01* –.05 2.89 ± 0.65 / 2.85 ± 0.65 0.93 –.02 2.88 ± 0.65 / 2.86 ± 0.66 0.49 –.02 2.86 ± 0.69 / 2.87 ± 0.65 –0.10 –.02 2.83 ± 0.64 / 2.88 ± 0.66 –0.93 .01 2.88 ± 0.71/ 2.86 ± 0.61 0.57 –.01 SNS 2.84 ± 0.67/ 2.90 ± 0.63 –1.53 .05 2.87 ± 0.66 / 2.86 ± 0.64 0.29 –.03 * p < .05; ** p < .01 2 1) K6 2) 3) UCLA Table 3-2-4 3-2-5 3-2-6 3 Table 3-2-7 3-2-8 3-2-9 K6 / / / / (Table 3-2-4 3-2-7) (t(997) = 2.01, p < .05) (t(997) = 2.36, p < .05)
Table 3-2-6 UCLA UCLA df = 997 t r / 41.15 ± 11.53 / 41.63 ± 10.89 –0.30 –.00 42.18 ± 11.54 / 41.47 ± 10.77 0.81 –.06 39.89 ± 9.83 < 43.13 ± 11.60 –4.74** .12** 41.35 ± 10.62 / 41.81 ± 11.16 –0.66 .00 41.23 ± 10.54 / 42.25 ± 11.52 –1.42 .05 41.91 ± 11.59 / 41.55 ± 10.80 0.37 –.04 40.93 ± 9.64 / 41.76 ± 11.20 –0.95 .04 40.98 ± 10.80 / 42.11 ± 11.00 –1.62 .03 SNS 41.78 ± 10.60 / 41.41 ± 11.25 0.53 –.00 40.77 ± 10.36 < 42.75 ± 11.55 –2.85** .09** * p < .05; ** p < .01 Table 3-2-7 K6 K df = 997 t r / 10.46 ± 4.90 < 12.02 ± 5.50 –4.60** .14** 10.66 ± 5.06 < 11.96 ± 5.34 –3.53** .10** 10.49 ± 4.83 < 13.29 ± 5.95 –6.80** .19** 10.56 ± 4.92 < 13.08 ± 5.75 –6.00** .15** 10.60 ± 4.94 < 13.54 ± 5.85 –6.30** .17** 10.67 ± 5.02 < 11.76 ± 5.41 –3.10** .10** 10.56 ± 4.91 < 12.15 ± 5.64 –4.40** .16** 10.85 ± 5.08 < 11.82 ± 5.57 –2.16* .08* SNS 10.68 ± 5.01 < 12.72 ± 5.64 –4.62** .14** 10.69 ± 4.99 < 12.66 ± 5.76 –4.45** .17** * p < .05; ** p < .01 (t(997) = 2.32, p < .05) / (Table 3-2-5 3-2-8) UCLA (t(997) = –4.74, p < .01) (t(997) =
Table 3-2-8 df = 997 t r / 2.88 ± 0.67 / 2.85 ± 0.63 0.71 –.02 2.87 ± 0.67 / 2.88 ± 0.62 –0.19 .03 2.89 ± 0.65 > 2.77 ± 0.65 2.36* –.06 2.88 ± 0.66 / 2.84 ± 0.62 0.73 .01 2.87 ± 0.66 / 2.84 ± 0.60 0.57 .00 2.89 ± 0.65 / 2.83 ± 0.65 1.32 –.04 2.90 ± 0.65 > 2.79 ± 0.67 2.32* –.08* 2.88 ± 0.66 / 2.81 ± 0.63 1.34 –.03 SNS 2.87 ± 0.66 / 2.87 ± 0.60 –0.11 .01 2.88 ± 0.65 / 2.83 ± 0.68 0.93 –.05 * p < .05; ** p < .01 Table 3-2-9 UCLA UCLA df = 997 t r / 41.05 ± 10.85 < 42.62 ± 10.98 –2.18* .07* 41.34 ± 11.09 / 42.32 ± 10.43 –1.24 .03 40.93 ± 10.62 < 44.60 ± 11.73 –4.16** .10** 41.28 ± 10.95 < 43.08 ± 10.67 –1.99* .04 41.25 ± 10.87 < 43.80 ± 11.00 –2.55* .06* 41.42 ± 11.03 / 42.02 ± 10.67 –0.81 .03 41.06 ± 10.87 < 43.00 ± 10.95 –2.53* .08* 41.35 ± 10.94 / 42.95 ± 10.73 –1.70 .06 SNS 41.56 ± 10.94 / 41.85 ± 10.82 –0.31 .03 41.18 ± 10.67 < 43.83 ± 11.93 –2.83** .10** * p < .05; ** p < .01 (t(997) = –2.18, p < .05) (t(997) = –4.16, p < .01) (t(997) = –1.99, p < .05) (t(997) = –2.55, p < .05) (t(997) = –2.53, p < .05) (t(997) = –2.83, p < .01) (Table 3-2-9) 3 1) 2) 3) Table 3-2-10 3-2-11 3-2-12 3
Table 3-2-10 ( ) df = 997 t r / 1.52 ± 0.83 < 1.93 ± 1.09 –2.71** .03 1.73 ± 0.97 < 1.96 ± 1.10 –2.65** .09** 1.74 ± 1.01 < 2.06 ± 1.12 –4.69** .16** 1.68 ± 0.96 < 2.10 ± 1.14 –6.27** .23** 1.67 ± 0.96 < 2.33 ± 1.14 –9.66** .30** 1.84 ± 1.05 / 1.93 ± 1.08 –0.93 .03 1.72 ± 0.99 < 1.96 ± 1.09 –2.76** .12** 1.84 ± 1.07 < 1.97 ± 1.08 –2.00* .09** SNS 1.68 ± 0.96 < 2.15 ± 1.14 –7.05** .24** 1.77 ± 1.01 < 2.11 ± 1.14 –5.09** .17** * p < .05; ** p < .01 Table 3-2-11 ( ) df = 997 t r / 3.15 ± 1.13 / 3.41 ± 1.05 –1.71 .04 3.23 ± 1.08 < 3.44 ± 1.04 –2.51* .09** 3.43 ± 1.02 / 3.36 ± 1.08 1.01 .00 3.31 ± 1.03 < 3.46 ± 1.06 –2.24* .07* 3.37 ± 1.05 / 3.44 ± 1.06 –1.03 .02 3.31 ± 1.12 / 3.41 ± 1.04 –1.04 .06 3.26 ± 1.05 < 3.43 ± 1.05 –1.97* .05 3.46 ± 1.05 / 3.35 ± 1.05 1.70 –.03 SNS 3.32 ± 1.04 < 3.48 ± 1.05 –2.50* .05 3.42 ± 1.03 / 3.37 ± 1.08 0.70 –.01 * p < .05; ** p < .01 Table 3-2-13 3-2-14 3-2-15 / / / / / / (Table 3-2-10
Table 3-2-12 df = 997 r / t 11.94 ± 2.88 < 12.64 ± 2.46 –1.97* .07* 12.24 ± 2.71 < 12.69 ± 2.42 –2.25* .07* 12.82 ± 2.38 > 12.41 ± 2.56 2.57* –.06* 12.57 ± 2.49 / 12.63 ± 2.48 –0.33 .01 12.61 ± 2.55 / 12.59 ± 2.36 0.17 –.01 12.30 ± 2.78 / 12.66 ± 2.43 –1.61 .04 12.47 ± 2.50 / 12.63 ± 2.48 –0.81 .01 12.78 ± 2.53 > 12.46 ± 2.44 2.05* –.06* SNS 12.47 ± 2.54 / 12.74 ± 2.42 –1.75 .03 12.61 ± 2.42 / 12.60 ± 2.58 0.09 –.01 * p < .05; ** p < .01 Table 3-2-13 ( ) df = 997 r / t 1.86 ± 1.06 < 2.01 ± 1.10 –2.13* .09** 1.87 ± 1.06 / 2.02 ± 1.13 –1.87 .08* 1.85 ± 1.05 < 2.19 ± 1.15 –3.89** .14** 1.81 ± 1.03 < 2.37 ± 1.19 –6.38** .20** 1.83 ± 1.04 < 2.45 ± 1.16 –6.34** .21** 1.86 ± 1.05 < 2.03 ± 1.14 –2.28* .10** 1.83 ± 1.04 < 2.14 ± 1.14 –4.17** .15** 1.86 ± 1.06 < 2.21 ± 1.13 –3.78** .14** SNS 1.84 ± 1.05 < 2.31 ± 1.16 –5.10** .18** 1.86 ± 1.06 < 2.20 ± 1.15 –3.70** .16** * p < .05; ** p < .01 SNS (t(997) = –2.72, p < .01) / / /SNS (Table 3-2-11 3-2-14) (t(997) = –1.97, p < .05) (t(997) = –2.25, p < .05) (t(997) = 2.57, p < .05) (t(997) = 2.05, p < .05) (t(997) = 2.67, p < .01) (t(997) = 2.33, p < .05)
Table 3-2-14 ( ) df = 997 r / t 3.37 ± 1.07 / 3.44 ± 1.02 –1.06 .00 3.37 ± 1.07 / 3.48 ± 0.99 –1.57 .02 3.41 ± 1.04 / 3.35 ± 1.09 0.69 –.00 3.38 ± 1.06 / 3.49 ± 0.99 –1.33 .06 3.40 ± 1.05 / 3.38 ± 1.04 0.20 –.00 3.36 ± 1.06 / 3.47 ± 1.02 –1.43 .03 3.38 ± 1.06 / 3.44 ± 1.02 –0.90 .02 3.40 ± 1.06 / 3.38 ± 0.99 0.25 –.03 SNS 3.36 ± 1.06 < 3.60 ± 0.99 –2.72** .07* 3.41 ± 1.04 / 3.33 ± 1.11 0.94 –.01 * p < .05; ** p < .01 Table 3-2-15 df = 997 r / t 12.66 ± 2.47 / 12.50 ± 2.51 0.93 –.04 12.61 ± 2.56 / 12.60 ± 2.28 0.06 –.03 12.70 ± 2.45 > 12.16 ± 2.60 2.67** –.06* 12.62 ± 2.52 / 12.51 ± 2.29 0.53 –.01 12.68 ± 2.52 > 12.15 ± 2.22 2.33* –.04 12.63 ± 2.55 / 12.55 ± 2.34 0.49 –.02 12.63 ± 2.51 / 12.53 ± 2.41 0.58 –.02 12.68 ± 2.49 > 12.23 ± 2.41 2.09* –.08* SNS 12.60 ± 2.51 / 12.65 ± 2.33 –0.24 .00 12.65 ± 2.44 / 12.35 ± 2.72 1.41 –.05 * p < .05; ** p < .01 (t(997) = 2.09, p < .05) / / / / / / (Table 3-2-12 3-2-15) 4
Internet addiction K6 / / / / K6 SNS (2009) SNS / / / / / / SNS SNS / / /SNS / SNS / / / / / / / Twitter
McKenna & Bargh (1998)
3 1 Internet addiction 2011 ( 2013) 2012 ( 2013)
(Block, 2008; O’Brien, 2010; Pies, 2009; Tao et al., 2010) Internet addiction Internet addiction (Morahan-Martin, 2009) Holmes (2003)
DSM-5 (American Psychiatric Association, 2013) Internet addiction
“Internet Gaming Disorder ( : )”
“ Conditions for Further Study”
APA Internet addiction Internet addiction Internet addiction 2 1 2 ( 1 4 ) 1)
5 2) Ten Item Personality Inventory
(TIPI-J) 3) BIS/BAS
3
(10 )
Table 3-3-1 3-3-2 2
Table 3-3-1 ( 2 ) 1 1 1 1 1 1 ± SD 10 27 52 150 3.43 ± 0.85 40 51 39 109 2.91 ± 1.16 106 51 26 56 2.13 ± 1.22 98 49 42 50 2.18 ± 1.18 144 29 13 53 1.9 ± 1.24 30 43 84 82 2.91 ± 1.01 46 35 72 86 2.83 ± 1.12 94 47 46 52 2.23 ± 1.19 SNS 128 37 16 58 2.02 ± 1.26 126 48 21 44 1.93 ± 1.16 SD 1 1 1 2 1 1 3 1 1 4 Table 3-3-2 ( 2 ) 1 1 1 1 1 1 ± SD 145 36 27 31 1.77 ± 1.09 173 28 15 23 1.53 ± 0.98 186 25 19 9 1.38 ± 0.79 184 34 12 9 1.36 ± 0.75 195 22 5 17 1.35 ± 0.84 154 38 27 20 1.64 ± 0.98 165 30 26 18 1.57 ± 0.96 193 21 14 11 1.34 ± 0.79 SNS 195 22 7 15 1.34 ± 0.81 183 30 10 16 1.41 ± 0.85 SD 1 1 1 2 1 1 3 1 1 4
Table 3-3-3 ( ) 3 48 29 22 13 38 38 13 15 36 38 13 18 33 41 10 20 31 39 12 10 41 37 14 4 47 30 21 18 33 42 9 SNS 19 32 40 11 24 27 35 16 1 JIAT t JIAT IA
TIPI-J BIS/BAS JIAT
t TIPI-J Table 3-3-4 TIPI-J Table 3-3-5 TIPI-J / (t(49) = –2.02, p < .05) / (t(49) = – 2.36, p < .05) BIS/BAS Table 3-3-6 BIS/BAS Table 3-3-7 BIS/BAS BIS ( : t(49) = –3.58, p < .01; : t(49) = –2.04, p < .05; : t(49) = –2.97, p < .01) BAS ( : t(49) = –2.31, p < .05; : t(49) = –2.07, p < .05; : t(49) = –2.47, p < .05) BAS (t(49) = –2.02, p < .05) BAS (t(49) = – 2.12, p < .05) BIS
Table 3-3-4 TIPI-J / / / / / 6.00 / 6.88 8.33 / 8.50 6.67 / 7.13 7.33 / 9.33 9.67 / 8.47 5.92 / 7.13 8.00 / 8.66 6.54 / 7.29 9.54 / 9.11 8.38 / 8.61 6.67 / 6.89 8.73 / 8.39 7.60 / 6.89 9.13 / 9.25 8.07 / 8.75 6.17 / 7.18 8.28 / 8.61 7.94 / 6.64 8.94 / 9.36 8.33 / 8.67 6.85 / 6.81 8.55 / 8.45 7.50 / 6.84 9.25 / 9.19 8.40 / 8.65 6.60 / 6.88 9.00 / 8.37 7.40 / 7.02 8.90 / 9.29 7.40 / 8.83 7.75 / 6.74 8.25 / 8.51 8.25 / 7.00 8.00 / 9.32 8.25 / 8.57 6.17 / 7.18 7.50 / 9.03 5.94 < 7.73* 9.39 / 9.12 7.83 / 8.94 SNS 6.42 / 7.06 8.68 / 8.38 7.58 / 6.81 8.89 / 9.41 7.74 / 9.03 6.70 / 6.93 7.88 / 9.04 6.92 / 7.26 9.38 / 9.07 8.50 / 8.59 * p < .05 Table 3-3-5 TIPI-J / / / / / 6.59 / 7.14 8.00 / 9.14 6.69 / 7.64 9.24 / 9.18 8.52 / 8.59 6.53 / 7.69 8.05 / 9.77 6.84 / 7.85 9.42 / 8.62 8.79 / 7.85 6.45 / 7.92 8.45 / 8.62 6.82 / 7.92 9.29 / 9.00 8.66 / 8.23 6.41 < 8.50* 8.15 / 9.90 6.73 / 8.60 9.37 / 8.60 8.46 / 8.90 6.72 / 7.17 8.38 / 8.83 6.92 / 7.67 9.31 / 8.92 8.51 / 8.67 6.92 / 6.57 8.27 / 9.07 7.22 / 6.79 9.11 / 9.50 8.68 / 8.21 6.87 / 6.76 8.10 / 9.05 7.00 / 7.24 9.00 / 9.52 8.53 / 8.57 6.83 / 6.78 8.26 / 9.56 7.10 / 7.11 9.10 / 9.78 8.74 / 7.67 SNS 6.60 / 7.64 8.15 / 9.73 6.90 / 7.82 9.35 / 8.73 8.60 / 8.36 6.86 / 6.75 8.14 / 9.25 6.91 / 7.50 9.54 / 8.50 8.71 / 8.19 * p < .05 4 5 TIPI-J / 1 / 1
Table 3-3-6 BIS/BAS BIS BAS / / / / / 13.67 < 22.04** 31.33 / 38.40 9.67 / 11.60 12.67 / 15.42 9.00 / 11.38 20.00 / 22.08 36.38 / 38.53 11.08 / 11.63 15.00 / 15.34 10.31 / 11.55 21.73 / 21.47 38.87 / 37.61 11.67 / 11.42 15.80 / 15.03 11.40 / 11.17 19.94 / 22.42 38.72 / 37.58 12.11 / 11.15 15.72 / 15.00 10.89 / 11.42 20.60 / 22.16 36.90 / 38.68 11.10 / 11.74 15.15 / 15.32 10.65 / 11.61 19.10 < 22.15* 36.50 / 38.34 11.50 / 11.49 14.80 / 15.37 10.20 / 11.49 15.75 < 22.04** 34.25 / 38.30 10.75 / 11.55 13.50 / 15.40 10.00 / 11.34 21.28 / 21.70 37.33 / 38.33 11.00 / 11.76 15.06 / 15.36 11.28 / 11.21 SNS 21.68 / 21.47 37.63 / 38.19 11.95 / 11.22 15.21 / 15.28 10.47 / 11.69 21.83 / 21.30 38.71 / 37.33 11.92 / 11.11 15.29 / 15.22 11.50 / 11.00 * p < .05; ** p < .01 Table 3-3-7 BIS/BAS BIS BAS / / / / / 21.28 / 21.91 36.41 < 40.05* 10.93 / 12.23 14.52 < 16.23* 10.97 / 11.59 21.68 / 21.15 37.55 / 39.23 11.26 / 12.15 14.95 / 16.15 11.34 / 10.92 21.68 /21.15 37.42 / 39.62 11.18 / 12.38 15.03 / 15.92 11.21 / 11.31 21.54 / 21.60 37.44 / 40.20 11.32 / 12.20 15.00 / 16.30 11.12 / 11.70 21.38 / 22.08 37.10 / 40.83 11.15 / 12.58 14.82 < 16.67* 11.13 / 11.58 21.30 / 22.21 37.27 / 39.86 11.24 / 12.14 14.78 < 16.50* 11.24 / 11.21 20.93 / 22.43 36.63 / 39.90 11.03 / 12.14 14.50 < 16.33* 11.10 / 11.43 21.14 / 23.44 37.76 / 39.00 11.40 / 11.89 15.02 / 16.33 11.33 / 10.78 SNS 21.78 / 20.73 37.73 / 38.91 11.48/ 11.55 15.08 / 15.91 11.18 / 11.45 21.86 / 20.88 38.26 / 37.38 11.46 / 11.56 15.23 / 15.31 11.57 / 10.50 * p < .05 BIS/BAS BIS BAS / 1 BAS IA BIS BAS (BIS ) (BAS )
BIS BAS BIS BAS BAS BIS IA BAS Twitter Internet addiction BIS/BAS 1
Morahan-Martin (2009) Internet addiction
Internet addiction
1
4 1 1) 2) ( ) 3) (comorbidity; ) 4) 5) 6) (Grant et al., 2010; Marks, 1990)
Khantzian & Albanese (2008 2013)
Shaffer et al.(2004) (syndrome model
of addiction) 3 1 1 1) 2) 3) 3 Internet addiction Internet addiction 1 3 1 2 Internet addiction Internet addiction
2
1 2 ( 1 4 )
1)
5 2) Ten Item Personality Inventory
(TIPI-J) 3) BIS/BAS 4) 5) 2 6) 7) 8) 9) 10) 11) 12) 8
13) Japanese version of the Barratt Impulsiveness
Scale, 11th version (BIS-11) 14) (EC)
3 1 2 3 4 45.49 38.55 9.48 6.49 2 Figure 3-4-1 1 37. ( ) 38. 35. 34. 36. ( ) 23. TIPI 22. TIPI 32. 21. TIPI 26. EPI 31. BAS 1, 11. 2, 12. 6, 16. 3. 9. SNS 10. 5. 19. SNS 14. 20. 15. 13.
1. 2. 3. 4. 5. 6. 7. 8. 9. SNS 10. 11. 12. 13. 14. 15. 16. 17. 18. 19. SNS 20. 21. TIPI 22. TIPI
23. TIPI 24. TIPI 25. TIPI 26. EPI 27. BIS
28. BAS 29. BAS 30. BAS 31. BAS 32.
33. 34. 35. 36. ( ) 37. ( ) 38. 39. 40. 41. 42. 43. 44. 45. 46. 47. BIS-11 48. EC 49. EC 50. EC 51. EC Figure 3-4-1. (39–46) 43. 7. 4. 8. -1 0 1 2 -2 -1 0 1 2 3 ERServa12sa[, 1] ER Se rva 12 sa [, 2] 1 2 3 4 5 6 7 8 9 10 11 12 13 14 15 16 17 18 19 20 21 22 23 24 25 26 27 28 29 30 31 32 33 34 35 36 37 38 39 40 41 42 43 44 45 46 47 49 50 51 48
46,$10
14,$31
32$
37$
22
17.
30. BAS 29. BAS 25. TIPI
27. BIS 24. TIPI 28. BAS
( 47. BIS-11 48. EC 49. EC
50. EC 51. EC )
4
1 ( )
TIPI
TIPI TIPI EPI
( ) BAS SNS SNS 1 SNS BAS
McKenna & Bargh (1998) 2
1) 2)
3) 3
Internet addiction
BAS BAS TIPI
BIS TIPI BAS
Internet addiction
Internet addiction
5 3 1 1 2 Internet addiction 2 2 3 (JIAT; 2007) Internet addiction Twitter 4 Internet addiction
1 1 JIAT Internet addiction
2
4 SNS McKenna & Bargh (1998)
(2008 2013) Shaffer et al.(2004) (syndrome model of addiction)
1 1 Internet addiction Internet addiction 4 Internet addiction (2007) JIAT 2 ( ) ( )
2 Diagnostic Questionnaire for
Internet Addiction (DQ; Young, 1998b) Internet addiction
Internet addiction
3 JIAT Internet addiction
BIS BAS 4 ( 2013) (Young, 1998b) Internet addiction Internet addiction 1
(2009) 2 1 Internet addiction Internet addiction 4 BIS/BAS ( 2007) 1 Internet addiction
BIS BAS Internet addiction
3
JIAT Internet addiction
BIS BAS