Distribution of Nutrients and Dissolved Oxygen
in the Subtropical Western Pacific Ocean in
1994
著者
ICHIKAWA Toshihiro, KAWAMURA Nobuko
journal or
publication title
南太平洋海域調査研究報告=Occasional papers
volume
26
page range
63-66
URL
http://hdl.handle.net/10232/16824
DISTRIBUTION OF NUTRIENTS AND DISSOLVED OXYGEN IN THE SUBTROPICAL WESTERN PACIFIC OCEAN IN 1994
Toshihiro ICHIKAWA and Nobuko KAWAMURA
Introduction
Oceanographicobservations were performed in October and November, 1994, from 34° to
11° Nat 139° to 156°E, on board the training ship Keiten-Maru of Kagoshima University. The
oceanographic observations were initiated at 34° N east of Japan on October 29, and finished at 11° N, north of Pohnpei Island on November 8. This area includes the Kuroshio and theNorth Equatorial Current in the western Pacific Ocean. We describe in this paper the distri bution of nutrients and dissolved oxygen from sea surface down to 1000m depth based on
data collected in this cruise.
Materials and Methods
Ten oceanographic sampling stations were selected for the study of nutrients and dis solved oxygen distribution (Fig. 1). The sea water samples were collected at twelve different depths from surface to 1000m in depth at each station with a series of 10-liter Niskin water samplers or 2-liter Niskin water bottles attached to the CTD system of Keiten-Maru. Dis
solved oxygen was immediately fixed just after sampling on board, and oxygen was meas ured by the Winkler's method in the ship's laboratory. Every two hundred and fifty millili
ters of sea water was drained into plastic bottles and was stored in a deep freezer until later
analysis. Nitrate, nitrite, phosphate, and silicate concentrations were determined spectro-photometrically at the shore laboratory. The analysis of nutrients followed the procedure of Parsons et al. (1984). The water sampling was carried out with the cooperation of scien
tists, students, and crew on board the Keiten-Maru. Results and Discussion
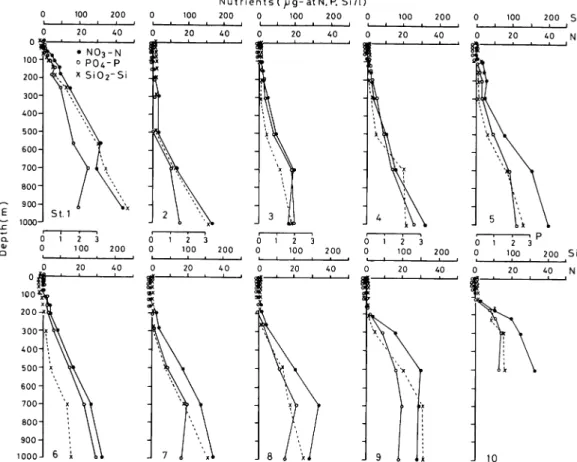
Fig. 2 shows the vertical profiles of nutrients concentrations observed at the ten sam
pling stations. One of the remarkable features was that the nutrients contents were strik
ingly low in the euphotic layer in all of the stations, and below the euphotic layer, the nutri ents concentrations increased with depth down to a 1000m sampling depth. A layer of
maximum concentration of phosphate and nitrate was often observed between 500 and 700m
depth.
The phosphate concentration ranged from an undetectable amount to 2.6 ^ g-atP/1. The
highest concentration was found at 1000m depth in St. 4, and the lowest value was usually
observed in surface mixed layer in all of the sampling stations. The phosphate maximum layer often occurred at 700m depth (Sts. 1, 7, 8, 9).
The nitrate concentrations varied from undetectable to 43 ^ g-atN/1 (St. 1, 900m). The nitrate maximum was also observable at intermediate waters below the euphotic layer (Sts.
T. Ichikawa & N. Kawamura
40° N
130° 140° 150° 160°E
Fig. 1. Locations of sampling stations occupied during the research cruise of the
Keiten-Maru in 1994
similar, because nitrogen and phosphorus are utilized and regenerated in a constant atomic ratio (Redfield et al., 1963). Nitrite concentration was generally very low-level below 0.10 f* g-atN/1 in the whole of the water column in most of the stations, and the nitrite was often detected only in certain layers in the water column. Exceptionally, high nitrite contents (0.12 -0.4/* g-atN/1) were observed in the northern-most sampling station (St. 1) near Japan in
both euphotic layer and sub-surface waters.
The silicate in the surface mixed layer was markedly depleted, as was the case with ni trate and phosphate. The silicate concentrations rapidly increased with depth, and the high est concentration was 230/^ g-atSi/1 at 900m depth in St. 1. The vertical distribution of sili cate showed an essentially monotonic increase in concentration with depth, and no maximum silicate layer was observed. The general features of nutrients distribution in the present
Nutrients(/jg-atN,P. Si/l)
100 200 0 100 200 0 200 Si
40 N
Fig. 2. Vertical profiles of phosphate, nitrate, and silicate at the ten sampling stations
results were comparable to those ofthe previous observations by many workers in the Pacific Ocean (ex. Ichikawa and Kamiya, 1992).
Fig. 3 shows the vertical profile of dissolved oxygen. Oxygen content in the surface wa
ters were high (4-4.5ml/l) and it consistently saturated due to the production of oxygen by
photosynthesis of phytoplankton and air bubbles produced by wave. Oxygen concentration decreased with depth and dropped to less than 2ml/l at 1000m depth. It is well known that a characteristic oxygen minimum layer develops between 200 and 1000m depth in the Pacific
Ocean. The depth of this minimum layer tends to be shallower toward the equator. The oxy gen minimum layer in this study was observed in the southern stations at 300 to 700m depth
T. Ichikawa & N. Kawamura
Fig. 3. Vertical profile of dissolved oxygen at the ten sampling stations
References
Ichikawa, T. & Kamiya, K. 1992. Particulate organic carbon and chlorophyll from lat. 28°to 2°N in the western Pacific Ocean in 1991. Kagoshima Univ. Res. Center S. Pac,
Occasional Papers, 23 • 73-78.
Parsons, T. R., Maita, Y. & Lalli, C. M. 1984. A manual of Chemical and biological meth ods for seawater analysis. 173pp. Pergamon Press, New York.
Redfield, A. C, Ketchum, B. H., & Richards, F. A. 1963. The influence of organisms on
the composition of sea water, p. 26-77. In Hill, M. N. (ed.), The Sea, v.2, Interscience,