X-ray-Excited Optical Luminescence Imaging for
On-Site Analysis of Alumina Scale
著者
Susumu Imashuku, Kazuaki Wagatsuma
journal or
publication title
Oxidation of metals
volume
94
page range
27-36
year
2020-05-29
URL
http://hdl.handle.net/10097/00131807
doi: 10.1007/s11085-020-09976-5X-ray-excited optical luminescence imaging for on-site analysis of alumina scale
Susumu Imashuku* and Kazuaki Wagatsuma
Institute for Materials Research, Tohoku University, 2–1–1 Katahira, Aoba-ku, Sendai 980–8577, Japan
*Corresponding author: Susumu Imashuku E-mail: [email protected] Tel: +81–22–215–2132
Fax: +81–22–215–2131
Abstract
On-site analysis of the composition, morphology, and thickness of surface scale on heat-resistant alloys helps to efficiently prevent serious problems such as failure and corrosion during their operation and to predict their remaining life. Currently, there are no analytical methods available that satisfy the requirements for the on-site analysis of oxide scale, which include short measurement time, nondestructive measurement, and portability of the analyzer. This study proposes a nondestructive analytical method to simultaneously identify alumina scale, which is one the most important protective oxide scales for base alloys, and to evaluate its morphology and thickness within 10 s by obtaining X-ray-excited optical luminescence (XEOL) images of the alloy surfaces. This was verified on Fe–25%Al, Fe–15%Al–10%Cr, and NiAl alloys heated at 900 or 1000 °C for different holding times. The XEOL images allow identifying alumina scale and observing its morphology from the infrared luminescence at 695 nm. The alumina scale thickness can be determined from the R value of the XEOL images in the range of 0.20 to 1.50 μm. The XEOL measurement can be performed in the air, and the setup primarily requires an X-ray tube used in portable analyzers such as X-ray fluorescence analyzer and a digital camera. The results suggest that the XEOL imaging method is suitable for the on-site evaluation of oxide scales on practical heat-resistant alloys.
Introduction
Heat-resistant alloys are materials designed to withstand oxidizing and corrosive environments at high temperatures above 650 °C, and comprise iron, nickel, and/or cobalt as base elements and aluminum, chromium, and/or silicon as additive elements [1-3]. These alloys are used in applications such as jet engines of aircraft, gas turbines of power plants, and reactors of petrochemical plants. At high temperatures, continuous, adhesive, and slowly growing oxide scales of alumina, chromia, or silica may form on such alloys, which are thereby protected from further oxidation and corrosion owing to the thermodynamic stability and high melting point of these oxides [1,2,4,5]. However, if nonprotective and/or inhomogeneous oxide scales form on the alloys, serious problems such as failure and corrosion may occur. Therefore, an understanding of the composition, morphology, and thickness of oxide scales is critical to prevent such problems and to predict the remaining life of the alloys. Moreover, performing these evaluations on-site is becoming increasingly important for enhancing the efficiency of the analysis. On-site analysis requires short analysis time, nondestructive measurements, and portability of the analyzer. Unfortunately, the most widely used techniques for evaluating oxide scales, such as scanning electron microscopy (SEM) equipped with energy- or wavelength-dispersive X-ray spectrometry (EDX or WDX) [6,7], do not satisfy such requirements. This is because SEM-EDX/WDX analysis for oxide scales requires laboratory-scale instruments and destructive cross-sectional observation for thickness measurement under a vacuum condition, which leads to long analysis time. Therefore, the development of an analytical technique suitable for on-site analysis of oxide scales on heat-resistant alloys is desirable.
We focused on X-ray-excited optical luminescence (XEOL) imaging to satisfy the abovementioned requirements for on-site analysis because it is a nondestructive technique and can be carried out in the air, which contributes to the reduction of analysis time. XEOL imaging provides a map of the elemental composition based on the phenomenon of light emission by X-ray irradiation. The laboratory-scale XEOL imaging technique has been primarily applied in studies to identify chemicals, cancers, and infections in biological specimens by injecting nanophosphors into tissues [8-13]. However, to the best of our knowledge, XEOL imaging has not yet been applied to the simultaneous evaluation of the composition, morphology, and thickness of oxide scales on heat-resistant alloys. In a previous study, we reported that the identification of alumina scale on Fe–Al and Fe–Al-Cr alloys from its luminescent color in XEOL images and the observation of the surface morphology of scale with a thickness above 0.6 μm [14]. The XEOL setup used in that study primarily comprised an air-cooled X-ray tube, which is used in portable X-ray fluorescence analyzers, and a commercially available digital camera, suggesting that the setup has a potential to be scaled down to a portable device. However, this XEOL imaging method was not
applicable to measuring the alumina-scale thickness from their brightness owing to the low XEOL intensity in the setup.
The present study aimed at applying the XEOL imaging to simultaneously identify, observe the surface morphology, and measure the thickness of alumina scale on alloys by increasing the emission intensity from alumina scale and improving the sensitivity to the emission in the XEOL setup. For this purpose, the apparatus was improved by using a high-power X-ray tube and a zoom lens with high sensitivity. We selected alumina scale as an analyte because alumina is the most protective and stable oxide against high-temperature oxidation and corrosion [7,15-18].
Material and Methods
We selected the typical alumina-forming alloys Fe–25%Al (mass%), Fe–15%Al–10%Cr (mass%), and NiAl as samples. The preparation of Fe–25%Al and Fe–15%Al–10%Cr was reported in our previous study [14]. NiAl was prepared by melting Al (purity 99.9%, Hirano Seizaemon Co. Ltd., Tokyo, Japan) and Ni pieces (purity 99.9%, Hirano Seizaemon Co. Ltd., Tokyo, Japan) in an Al2O3 crucible using a high-frequency induction-heating
furnace. The Fe–25%Al, Fe–15%Al–10%Cr, and NiAl alloys were cut into cubic slices of approximately 5 mm. The slices were annealed at 1100 °C in a vacuum of 0.1 Pa for 12 h. The surfaces of the slices were polished using 600-, 1200-, and 2400-grit abrasive papers and finished using a 1 μm diamond slurry. The polished slices were heated at 1000 °C in air so that alumina scale was formed on their surfaces. The thickness of the alumina scale was controlled by changing the holding time at 900 °C or 1000 °C, as presented in Table 1. After the heat-treatment, one side of a given sample was subjected to the same polishing procedure mentioned above to measure the thickness of the formed alumina scale by SEM observation.
XEOL images of the samples were captured using a custom setup primarily comprising an X-ray tube with a rhodium target (TUB00050-RH2, Moxtek Inc., Orem, Utah, USA) and a digital mirrorless camera (α7RII, Sony Corp., Tokyo, Japan) equipped with a zoom lens (LZH-10A-05T, Seimitu Wave Inc., Kyoto, Japan), as shown in Fig. 1. The setup can generate X-rays with 30 keV (our previous setup generated 20 keV [14,19-21]) by using a radiation shielding glass with a lead equivalence of 2.0 mm (LX-57B, Electric Glass Building Materials Co. Ltd., Osaka, Japan) as a window to capture the XEOL images, and the X-ray tube and sample stage were enclosed in a steel box to whose surface a few layers of radiation shielding sheets (GT-RS3.3, Green Technologies Co. Ltd., Tokyo, Japan) were attached. The sensitivity of the zoom lens was approximately 1.5 times higher than that used in the previous setup [14,19-21]. The camera can detect light whose wavelength range is from 350 to
1000 nm. The wavelength range was achieved by detaching a built-in filter that blocks ultraviolet and infrared light from the commercially available digital mirrorless camera which can detect light with the wavelength from 420 to 680 nm. The X-ray tube was operated at 30 kV and 200 μA. The exposure time for XEOL images were set to be 5 s for measuring the alumina scale thickness and 10 s for observing the surface morphology. Surface, cross-section observations, and elemental analyses of the samples were performed using a SEM (TM3030 Plus, Hitachi High-Technologies Co., Tokyo, Japan) equipped with a silicon drift EDX detector (Quantax70, Bruker Corp., Billerica, Massachusetts, USA) to confirm the validity of the XEOL imaging method. Cathodoluminescence (CL) spectra of a few samples were also acquired using a custom SEM-CL system to identify the formed scales. Details of the CL measurement system were provided in our previous papers [21-27].
Results and Discussion
First, SEM-EDX analysis was performed on the scales that were formed on the Fe–25%Al, Fe–15%Al– 10%Cr, and NiAl alloys upon heating at 900 °C or 1000 °C to identify the compositions of the scales. Only alumina and oxygen were detected on the surface layers for all alloys, whereas their constituent elements were detected beneath the surface layers (Fig. 2). This indicates that an exclusive alumina scale was on the surface of each alloy. In addition, the formation of alumina scale was confirmed by obtaining CL spectra of the surface of the alloys, in which an intense CL peak attributable to alumina was observed at 695 nm [14,22] (Fig. 3).
We then acquired XEOL images of the surfaces of Fe–25%Al, Fe–15%Al–10%Cr, and NiAl heated at 900 °C or 1000 °C to identify the composition and to observe the morphology of the scale surfaces with various alumina thicknesses. Figure 4 shows the XEOL images and the corresponding SEM surface images. Almost the entire alloy surface area of these alloys emitted red luminescence. The luminescence color was proven to originate from infrared light because no luminescence was detected for the XEOL images of the alloys when an optical filter that blocked light in the wavelength region above 650 nm (DR655, Kenko Tokina Co., Ltd., Tokyo, Japan) was attached to the zoom lens. Since alumina scale emits infrared luminescence at 695 nm, the XEOL images in Fig. 4 represented the luminescence of alumina scale, indicating that XEOL imaging is suitable for identifying alumina scale. A comparison of the XEOL images and the corresponding SEM images reveals that areas with no luminescence in the XEOL images corresponded to cracks (area 1 in Fig. 4a and area 2 in Fig. 4c) and an area in which the alumina scale was peeled away (area 3 in Fig. 4e, whose composition agreed with that of NiAl via EDX analysis). Infrared luminescence with higher intensity was detected along the cracks observed in Fig. 4c, indicating that the alumina scale in these areas was thicker than that in other areas. This is most likely due to in-depth
formation of alumina scale along the cracks. Figure 4a and 4c indicate that the present XEOL setup can detect the luminescence originating from alumina scale with thickness below 0.6 μm, which constituted the detection limit for the previous setup [14], by increasing the irradiated X-ray energy from 20 to 30 keV and by using a zoom lens with 1.5 times higher sensitivity. Therefore, the present XEOL setup is suitable for observing the morphology of alumina scale down to 0.2 μm thickness on heat-resistant alloys.
Because determining the alumina-scale thickness without its cross-sectional observation is a key to realize on-site analysis of scale on heat-resistant alloys, we attempted to determine the thickness of alumina scale from its surface XEOL image. Since our previous work revealed that the thickness of alumina scale could be estimated from the CL intensity of the peak at 695 nm [14], the red (R) value of the XEOL images was used to measure the thickness of alumina scale. The R value is determined from intensity of light that passed through a red filter in the camera and has integer values from 0 to 255. In the present experiments, the R value of the XEOL images of alumina scale correlated most intimately with its CL intensity at 695 nm among the R, green (G) and blue (B) values in the camera [28] because only the red and infrared luminescence originating from alumina was involved in the XEOL images. Figure 5 shows the thickness dependence on the R value of the surface XEOL images of the Fe–25%Al, Fe–15%Al–10%Cr, and NiAl alloys heated at 1000 °C for different holding times. It should be noted that NiAl alloys with alumina scale thicknesses below 1.0 μm were not obtained for heat-treatment at 1000 °C, and NiAl alloy with an alumina scale thickness of 0.62 μm could be only obtained by heat-treatment at 900 °C for 10 h. The actual thicknesses of the alumina scale were determined from cross-sectional SEM images of each alloy sample, which are shown in Fig. 2a, e, and j. The R value of the XEOL images increased almost linearly with the alumina scale thickness, regardless of the base alloys. This indicates that surface XEOL imaging can be used to approximately determine the alumina scale thickness on various alumina-forming alloys by using the calibration curve depicted in Fig. 5. This calibration curve exhibited a nonzero value of the intercept owing to the background of infrared light during the XEOL measurement. This suggests that the determination of alumina scale thickness
via the present XEOL setup would be difficult below the thickness investigated in the present study (0.2 μm). In
addition, the upper limit of thickness measurable by the XEOL imaging method is expected to be a few microns, which corresponds to the CL sampling depth [29]. However, the thickness range of the present XEOL imaging method is sufficient to evaluate the alumina scale thickness of commercial alumina-forming alloys exposed to high-temperature atmospheres for more than one year, such as the 214 alloy (Ni-Cr-Al-Fe alloy), APM (Fe-Cr-Al alloy), and Inconel 702 (Ni-Cr alloy) [17,18].
Figure 2 and Table 1 indicate that the alumina-scale thickness of NiAl was larger than that of Fe–25%Al and Fe–15%Al–10%Cr, suggesting the formation of metastable alumina on NiAl, e.g., theta and gamma alumina, prior to stable alpha alumina as reported in the previous work[18]. The formation of theta and gamma alumina on the NiAl alloy can be confirmed from the small CL peak at 685 nm of NiAl [30,31] (Fig. 3) and the gradual decrease toward higher wavelength for the CL peak at 695 nm [30,32] compared to Fe–25%Al and Fe–15%Al– 10%Cr (Fig. 3), respectively. Since the wavelength of CL peaks for theta (685 nm) and gamma alumina (695 nm) are close to that of alpha alumina (695 nm), it is difficult to distinguish alpha, gamma, and theta alumina from the luminescent color of XEOL image. In the present study, the formation of theta and gamma alumina did not affect thickness measurement of alumina scale from the R value of the XEOL images because CL intensity related to alpha alumina was approximately 10 times higher, compared to that of theta and gamma alumina (Fig. 3).
Conclusions
We have presented a method to nondestructively identify alumina scale on alumina-forming alloys, observe its surface morphology, and measure its thickness simultaneously by acquiring XEOL images. The alumina scale formed on Fe–25%Al, Fe–15%Al–10%Cr, and NiAl alloys emitted infrared light at 695 nm, and their XEOL images allowed us to observe cracks and areas in which the alumina scale was peeled away on the surfaces. However, we could not distinguish alpha, gamma, and theta alumina from the luminescent colors of XEOL images. The thickness of the alumina scale can be determined from the R value of the XEOL images since the R value linearly increased with the thickness in the 0.20–1.50 μm range, regardless of the base alloys. This method can be performed in air and requires only 10 s for the measurement. The setup comprised an X-ray tube used in portable X-ray fluorescence analyzers and a commercially available digital camera. Therefore, the present study demonstrates that the XEOL imaging method is suitable for the on-site analysis of oxide scales on practical heat-resistant alloys for predicting their remaining life. Future work will involve the application of this method to silica and chromia scales and the realization of a portable XEOL imaging apparatus.
Acknowledgement
This work was supported by Iketani Science and Technology Foundation. We thank Dr. Nagasako for preparing NiAl alloy.
References
1
Hindam, H., Whittle, D.P.: Microstructure, adhesion and growth kinetics of protective
scales on metals and alloys. Oxid. Met. 1982; 18: 245-284.
2
Stott, F.H., Wood, G.C., Stringer, J.: The influence of alloying elements on the
development and maintenance of protective scales. Oxid. Met. 1995; 44: 113-145.
3
Young, D.J. High Temperature Oxidation and Corrosion of Metals, vol. 1.
Amsterdam: Elsevier; 2016.
4
Kofstand, P. High Temperature Corrosion. London: Elsevier; 1988.
5
Loeffel, K., Anand, L., Gasem, Z.M.: On modeling the oxidation of high-temperature
alloys. Acta Mater. 2013; 61: 399-424.
6
Chevalier, S. Mechanisms and Kinetics of Oxidation. In: Cottis, R.A.et al., eds.
Shreir's Corrosion, Amsterdam: Elsevier; 2010:132-152.
7
Sequeira, C.A.C. High temperature corrosion: fundamentals and engineering.
Hoboken: John Wiley and Sons, Inc; 2019.
8
Chen, H., Rogalski, M.M., Anker, J.N.: Advances in functional X-ray imaging
techniques and contrast agents. Phys. Chem. Chem. Phys. 2012; 14: 13469-13486.
9
Benza, D., Uzair, U., Raval, Y., Tzeng, T.J., Behrend, C.J., Anker, J.N.: X-ray excited
luminescent chemical imaging (XELCI) for non-invasive imaging of implant
infections. Proc SPIE Int Soc Opt Eng. 2017; 10081.
10
Burdette, M.K.et al.: Organic Fluorophore Coated Polycrystalline Ceramic LSO:Ce
Scintillators for X-ray Bioimaging. Langmuir. 2019; 35: 171-182.
11
Fan, W.et al.: Breaking the Depth Dependence by Nanotechnology-Enhanced
X-Ray-Excited Deep Cancer Theranostics. Adv. Mater. 2019; 31: e1806381.
12
Udayakantha, M., Schofield, P., Waetzig, G.R., Banerjee, S.: A full palette: Crystal
chemistry, polymorphism, synthetic strategies, and functional applications of
lanthanide oxyhalides. J. Solid State Chem. 2019; 270: 569-592.
13
Sun, W., Zhou, Z., Pratx, G., Chen, X., Chen, H.: Nanoscintillator-Mediated X-Ray
Induced Photodynamic Therapy for Deep-Seated Tumors: From Concept to
Biomedical Applications. Theranostics. 2020; 10: 1296-1318.
14
Imashuku, S., Wagatsuma, K.: Non-destructive evaluation of alumina scale on
heat-resistant steels using cathodoluminescence and X-ray-excited optical luminescence.
Corros. Sci. 2019; 154: 226-230.
15
Houngniou, C., Chevalier, S., Larpin, J.P.: High-Temperature-Oxidation Behavior of
Iron–Aluminide Diffusion Coatings. Oxid. Met. 2006; 65: 409-439.
16
Zhang, Z.G., Gesmundo, F., Hou, P.Y., Niu, Y.: Criteria for the formation of
protective Al2O3 scales on Fe–Al and Fe–Cr–Al alloys. Corros. Sci. 2006; 48:
741-765.
17
Lai, G.Y. High-Temperature Corrosion and Materials Applications. Ohio: ASM
International; 2007.
18
Pint, B.A. High Temperature Corrosion of Alumina-forming Iron, Nickel and
Cobalt-base Alloys. In: Cottis, R.A.et al., eds. Shreir's Corrosion, Amsterdam: Elsevier;
2010:606-645.
19
Imashuku, S., Ono, K., Wagatsuma, K.: X-Ray excited optical luminescence and
portable electron probe microanalyzer-cathodoluminescence (EPMA-CL) analyzers
for on-line and on-site analysis of nonmetallic inclusions in steel. Microsc. Microanal.
2017; 23: 1143-1149.
20
Imashuku, S., Wagatsuma, K.: Simple identification of Al
2O
3and MgO·Al
2O
3spinel
inclusions in steel using X-ray-excited optical luminescence. X-Ray Spectrom. 2019;
48: 522-526.
21
Imashuku, S., Wagatsuma, K.: Determination of Free Lime Content in Steelmaking
Slag Using Cathodoluminescence and X-ray Excited Optical Luminescence. Metall.
Mater. Trans. B. 2020: submitted.
22
Imashuku, S., Ono, K., Shishido, R., Suzuki, S., Wagatsuma, K.:
Cathodoluminescence analysis for rapid identification of alumina and MgAl
2O
4spinel
inclusions in steels. Mater. Charact. 2017; 131: 210-216.
23
Imashuku, S., Tsuneda, H., Wagatsuma, K.: Rapid and simple identification of free
magnesia in steelmaking slag used for road construction using cathodoluminescence.
Metall. Mater. Trans. B. 2020; 51B: 28-34.
24
Imashuku, S., Wagatsuma, K.: Rapid identification of rare earth element bearing
minerals in ores by cathodoluminescence method. Miner. Eng. 2020; 151: 106317.
25
Imashuku, S., Wagatsuma, K.: Cathodoluminescence Analysis for the Nondestructive
Evaluation of Silica Scale on an Iron-Based Alloy. Oxid. Met. 2019; 93: 175-182.
26
Imashuku, S., Tsuneda, H., Wagatsuma, K.: Effects of divalent-cation iron and
manganese oxides on the luminescence of free lime and free magnesia. Spectrochim.
Acta, Part A. 2020; 229: 117952.
27
Imashuku, S., Wagatsuma, K.: Cathodoluminescence analysis of nonmetallic
inclusions in steel deoxidized and desulfurized by rare-earth metals (La, Ce, Nd).
Metall. Mater. Trans. B. 2020; 51B: 79-84.
28
Sato, K., Shimada, S., Toyoda, H., Yanai, T., Hori, N.: Extraction of Near-infrared
Information from Aerial Photography Using UAV with Supergel Color Filter Aiming
for In-situ Tea Growing Monitoring. J. Remote Sens. Soc. Jpn. 2016; 36: 131-135.
29
Yacobi, B.G., Holt, D.B. In: Cathodoluminescence Microscopy of Inorganic Solids,
New York: Plenum Press; 1990:151-155.
30
Wen, Q., Lipkin, D.M., Clarke, D.R.: Luminescence Characterization of
Chromium-Containing -Alumina. J. Am. Ceram. Soc. 1998; 81: 3345-3348.
31
Shen, L., Hu, C., Zhou, S., Mukherjee, A., Huang, Q.: Phase-dependent
photoluminescence behavior of Cr-doped alumina phosphors. Opt. Mater. 2013; 35:
1268-1272.
32
Rastorguev, A., Baronskiy, M., Zhuzhgov, A., Kostyukov, A., Krivoruchko, O.,
Snytnikov, V.: Local structure of low-temperature γ-Al
2O
3phases as determined by
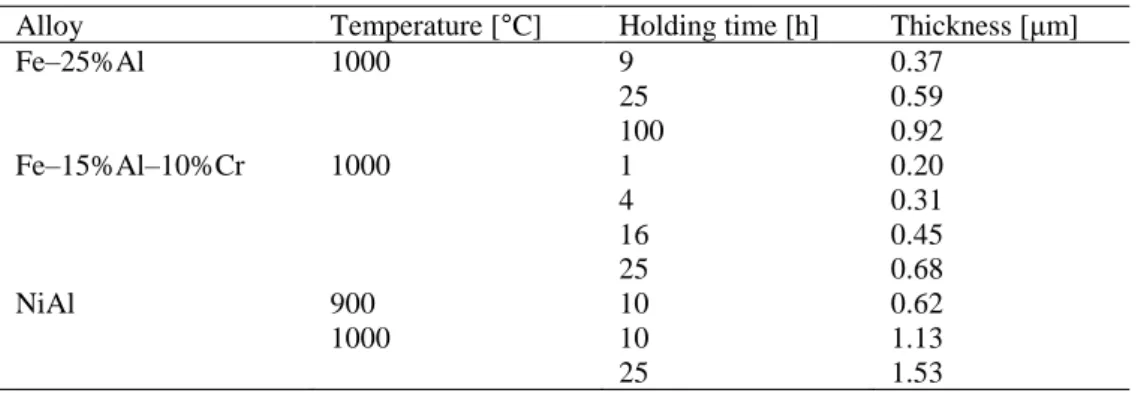
Table 1 Heat-treatment condition of the alloys and its thickness measured via cross-sectional scanning electron
microscope observation.
Alloy Temperature [°C] Holding time [h] Thickness [μm]
Fe–25%Al 1000 9 0.37 25 0.59 100 0.92 Fe–15%Al–10%Cr 1000 1 0.20 4 0.31 16 0.45 25 0.68 NiAl 900 10 0.62 1000 10 1.13 25 1.53
Figure captions
Fig. 1 Schematic illustration of the X-ray-excited optical luminescence setup.
Fig. 2 Cross-sectional scanning electron microscope (SEM) (backscattered electron) images and energy-dispersive
X-ray spectroscopy (EDX) elemental mappings corresponding to the area surrounded by the broken line in the SEM images for the Fe–25%Al alloy heated at 1000 °C for 100 h ((A) SEM image and EDX mappings of (B) O, (C) Al, and (D) Fe), the Fe–15%Al–10%Cr alloy heated at 1000 °C for 25 h ((E) SEM image and EDX mappings of (F) O, (G) Al, (H) Fe, and (I) Cr), and the NiAl alloy heated at 1000 °C for 10 h ((J) SEM image and EDX mappings of (K) O, (L) Al, and (M) Ni).
Fig.3 Cathodoluminescence (CL) spectra of the surface of (a) the Fe–25%Al alloy heated at 1000 °C for 100 h,
(b) the Fe–15%Al–10%Cr alloy heated at 1000 °C for 25 h, and (c) the NiAl alloy heated at 1000 °C for 10 h. Measurement durations for the CL spectra were 0.1 s.
Fig. 4 X-ray-excited optical luminescence (XEOL) images (A, C, E) and the corresponding scanning electron
microscope (secondary ion) images (B, D, F) of the Fe–25%Al alloy with an alumina scale thickness of 0.37 μm, the Fe–15%Al–10%Cr alloy with an alumina scale thickness of 0.20 μm, and the NiAl alloy with an alumina scale thickness of 1.10 μm, respectively. The exposure time for the XEOL images was 10 s.
Fig. 5 R value of X-ray-excited optical luminescence (XEOL) images for the Fe–25%Al, Fe–15%Al–10%Cr,
and NiAl alloys heated at 900 °C or 1000 °C for different times as a function of alumina scale thickness. The exposure time for the XEOL images was 5 s.