Empirical Essays on the Economic Value of
Public Education: Evidence from Property
Market in Japan
著者
KURODA YUTA
学位授与機関
Tohoku University
学位授与番号
11301甲第18406号
Empirical Essays on the Economic Value of Public Education:
Evidence from Property Market in Japan
(公教育の経済価値に関する実証研究
: 日本の不動産市場を用いた分析)
Yuta Kuroda
January 2019
i
Acknowledgement
First, I am deeply indebted to Kentaro Nakajima for his insightful suggestions and frequent encouragement. Even though I am the sole author of this doctoral dissertation, many of the ideas are attributed to his numerous helpful comments. Without his guidance, this dissertation would not have materialized.
In addition, I would like to thank my advisor Midori Wakabayashi and Akira Hibiki. Your valuable advice and comments were extremely helpful in shaping the content of this dissertation.
I am also deeply grateful to Paul Thorsnes, Jenn-Jou Chen, and Wen-Chieh Wu for their helpful comments and suggestions. I would also like to express my gratitude to the participants at the Japanese Economic Association Meeting, Applied Regional Science Conference, Annual Conference of the Western Economic Association International, Labor Economics Conference at Doshisha University, International Conference at National Chengchi University, Joint Seminar at University of Tsukuba, and the Tokyo Labor Economics Workshop and Data Science Workshop at Tohoku University.
Further, I thank my fellow students at Tohoku University. I am particularly grateful to Kai Nomura and Takeru Sugasawa. Daily discussions with them made my research activities and college life very enjoyable.
Finally, I would like to express my special appreciation to my parents.
ii
Contents
1. Introduction 1
2. The Effect of School Quality on Housing Rents: Evidence from Matsue City in Japan 4
2.1. Introduction ... 4
2.2. Literature review ... 5
2.3. Empirical strategies ... 7
2.4. Data and summary statistics ... 8
2.4.1. About Matsue City ... 8
2.4.2. Data ... 9
2.4.3. Who lives in the rental house? ... 10
2.5. Results and discussion ... 13
2.5.1. Baseline Results ... 13
2.5.2. Robustness ... 17
2.5.2.1 Definition of “For a Family” ... 17
2.5.2.2 Other Concerns ... 19
2.5.2.3 Junior high school ... 21
2.6. Conclusion ... 24
3. Does Disclosure of School Quality Information Increase the Disparity in Academic Achievement? The Effect through the Housing Market 25 3.1. Introduction ... 25
3.2. Literature review ... 27
3.3. Empirical strategies ... 31
3.3.1. Housing rents ... 31
3.3.2. Number of posted apartments ... 32
3.3.3. Enrollment and population ... 33
3.4. Data ... 34
3.4.1. About Matsue City ... 34
3.4.2. Property data ... 36
3.4.3. Area data ... 39
3.4.4. School data ... 39
iii
3.5.1. Main results for the housing market ... 40
3.5.2. Various concerns ... 48
3.5.2.1. Placebo test ... 48
3.5.2.2. Estimation of divided samples ... 52
3.5.2.3. Considering the effect of the number of posted apartmetns ... 56
3.5.3. Results for enrollment and population ... 60
3.5.4. Disparity in academic achievement ... 65
3.6. Conclusion ... 66
4. The Effect of a Partial Relaxation of the School-District System on Land Prices and Academic Performance: An Empirical Analysis in Japan 77 4.1. Introduction ... 77 4.2. Literature review ... 79 4.3. Institutional backgrounds ... 81 4.4. Empirical strategies ... 83 4.5. Data ... 84 4.5.1. Land-price data ... 84 4.5.2. School data ... 85
4.6. Results and Discussions ... 87
4.6.1. Effect on land prices ... 87
4.6.2. Effect on enrollment rate ... 91
4.7. Conclusion ... 95
iv
List of Figures
Figure 2.1 Elementary School Districts of Matsue City ... 9
Figure 2.2 Junior High School Districts of Matsue City ... 23
Figure 3.1 Elementary School Districts of Matsue City ... 35
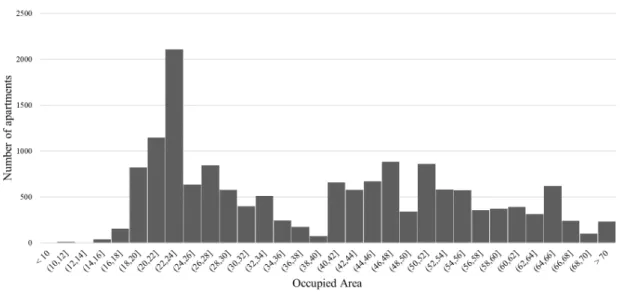
Figure 3.2 Number of Properties by Occupied Area ... 37
Figure 3.3 Changes in Effect Over Time ... 47
Figure 3.4 Changes in Effect Over Time (Number of Samples) ... 59
Figure 3.5 Changes in Effect Over Time (Seven-Year-Old Children) ... 64
Figure 4.1 High School Districts in Matsue City ... 82
Figure 4.2 Ratio of Successful Applicants to All Universities ... 93
Figure 4.3 Ratio of Successful Applicants to National Universities ... 93
Figure 4.4 Ratio of Successful Applicants to Group B and C Universities ... 94
v
List of Tables
Table 2.1 Summary Statistics ... 12
Table 2.2 Number of Household Living in Owned Houses and Rented Houses ... 13
Table 2.3 Baseline Estimation ... 16
Table 2.4 Family vs. Single: dummy variable ... 17
Table 2.5 Family vs. Single: subsample ... 17
Table 2.6 Number of Households by Occupied Area of Rooms ... 19
Table 2.7 Robustness of “for a family” ... 19
Table 2.8 Sensitivity Tests ... 20
Table 2.9 Using Junior High School Data ... 23
Table 3.1 Summary Statistics (Main Estimation) ... 38
Table 3.2 Number of Households Living in Owned Houses and Rented Houses ... 39
Table 3.3 Baseline Results ... 44
Table 3.4 Elapsed Days ... 45
Table 3.5 Changes in Effect Over Time... 46
Table 3.6 Results using Shops and Offices ... 50
Table 3.7 Results using Single-Person Apartments ... 51
Table 3.8 Sample Divided According to Occupied Area ... 54
Table 3.9 Sample Divided According to the Number of Children in an Area ... 55
Table 3.10 Number of Family-Oriented Apartments ... 57
Table 3.11 Changes in Effect Over Time (Number of Samples) ... 58
Table 3.12 Number of Enrolled Students ... 62
Table 3.13 Population in Area by Age ... 63
Table 3.14 Disparity in Academic Achievement ... 66
Table 4.1 Summary Statistics ... 85
Table 4.2 List of the Universities Included in the Each Group ... 86
Table 4.3 Results of the University Entrance Examination ... 87
Table 4.4 Baseline Results ... 89
1
Chapter 1
Introduction
From an economic aspect, education is an investment in human capital. Public education is a very important factor in the accumulation of human capital in the country, and various studies have noted the important role of education in economic growth (e.g., Hanushek and Kimko, 2000; Heckman, Layne-Farrar, and Todd, 2009). Therefore, a public education policy must be managed efficiently and effectively. In order to do so, it is necessary to understand the behaviors of both parents and children. If we understand the decision-making process regarding the educational choices of parents and children more clearly, we can implement a more effective education policy. For instance, if we identify that households below the poverty threshold do not invest in their children’s education, schooling support can be provided to them, thus preventing the reproduction of poverty.
However, because public education is free or compulsory in many cases (as in Japan), it is difficult to directly observe a parent’s willingness-to-pay for education for their children. To address this problem, many studies indirectly observe a parent’s willingness-to-pay for public education by analyzing the property market (Black and Machin, 2011; Nguyen-Hoang and Yinger, 2011). These studies consistently find that the value of education is capitalized in property prices, such as housing rents or land prices, in various countries and regions. The mechanism is as follows: under the school district system, in order to attend a specific school, it is necessary to live in the attendance district. Thus, the demand for housing or land within the designated district of a high-quality school exceeds that in the designated district of low-quality schools; as a result, the price of houses and land within the designated school district also increases.
Despite consistent results using data from various countries and regions, vast potential remains in this literature. When a change in the system that may affect educational behaviors occurs, changes in parental behavior in relation to education can be observed by analyzing the property market. Education affects the property market, and these changes in the property market in turn affect a parent's behavior. For instance, the presence of a high-quality school has the effect of increasing property prices, which causes high-ability students with high-income parents to go to high-quality schools. Therefore, the quality of these high-quality schools further improves. However, there are relatively few studies considering this interaction.
Therefore, this dissertation investigates the relationship between the quality of public education and the property market. In addition, it explores how the relationship varies with educational system changes. I analyze not only the effect of education on the property market but also the changes in
2
population and academic achievement through the response of the property market. By doing so, I indirectly observe the parent’s willingness-to-pay, or educational behavior for public education and investigate the comprehensive effect caused by the change in the education system.
This dissertation consists of three independent essays that target Japanese local cities and measure the value of public education using the property market. Although all chapters focus on Matsue City, Shimane prefecture in Japan, the purpose, objects of study, and data of each analysis are different. The first chapter concerns the effect of the quality of public elementary schools on apartment rents. The second chapter investigates the effect of the disclosure of information on public elementary school's quality on housing rents, population, and academic achievement. The last chapter explores the effect of a change in a high school district system on land price.
The overall results of these three chapters suggest that the property market is sensitive to changes in the educational system and the resulting change in parent behavior. This implies that even if the fees of public education are equal, the actual expenses for public education will differ due to increased property prices. This causes it to be more expensive to receive a high-quality education and may lead to widening disparities or a hierarchization of academic achievement. In addition, the results suggest that there may be heterogeneity in the educational behavior of parents. The inequality in education may increase due to the promotion of market principles or disclosures of the information of public education if parents with higher educational achievements, incomes, and enthusiasm will more effectively use the market principles and information.
This dissertation conducts empirical analysis using various data sets and econometric methods. In order to address the concern of unobserved characteristics, I use the regression discontinuity design and control for fixed effects using panel data. In this dissertation, I mainly use the datasets on public schools, the property market, regional population, and the economy. The following is an overview of the chapters.
In Chapter 2, I investigate the effect of public-school quality on housing rents within a school district. I estimate the causal effect of school quality, measured by average test scores, on housing rents using a regression discontinuity design to control for unobserved characteristics of neighborhoods. Specifically, I focus on apartment buildings located within school district boundaries. I find that school quality has a significant and positive effect on housing rents of apartments for families, but does not significantly affect housing rents of dwellings for single people. These results show that parents are willing to pay more to send their children to a better school.
Chapter 3 expands the analysis of Chapter 2 and focuses on the disclosure of the school quality information. I examine the effect of the disclosure of information about school quality on the stratification of elementary schools and the widening disparity in the academic ability of students between schools. Exploiting the fact that the school-level test scores were first disclosed in October 2014 in Matsue City in Japan, I estimate the difference in the effect of test scores on housing rent
3
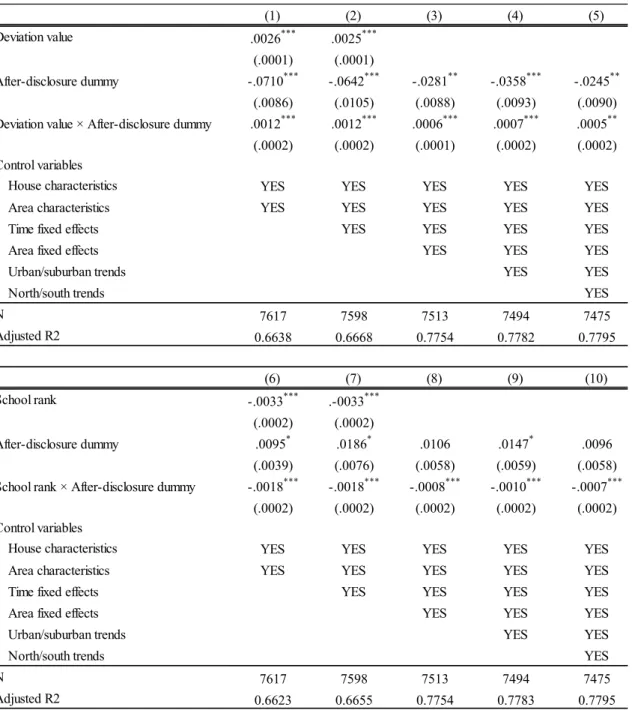
and population in the school district before and after the disclosure. I find that school-level test scores have a significant and positive effect on rents of apartments intended for a family after the school-level test scores were disclosed. I also find that disclosure significantly increases the population of children in the elementary school age group in the designated district of schools with high test scores. In addition, I find that the relative standard deviation of test scores after disclosure becomes larger than before disclosure. These results suggest that the disparity in the academic ability of students between schools may increase through increased housing rents after the disclosure of school-level test results.
Finally, I analyze the effect of the relaxation of a school district system’s outside enrollment rate in public high schools on land price and university advancement rates in Chapter 4. In Matsue City in Japan, enrolling in a general public school when the family lives outside the school district was strictly prohibited before 2008. Therefore, nobody could enter high schools focused on preparing students to enter a university across school boundaries for a long period of time. In 2008, however, the school district system eliminated the most academic track aimed at entrance to prestigious universities. Additionally, 5% of all enrolled students in the general track were allowed to be from outside the school district. Since 2016, the enrollment limit from outside the school district was relaxed to 20%. I estimate hedonic models on land prices using the fixed effect approach with panel data from 2003 to 2018 and a regression discontinuity approach focusing on the boundary of the school district. I find that relaxing the school district system’s enrollment limit significantly decreased the land prices within school districts with high-quality high schools. This suggests that the value of living within the high-quality school district may have decreased due to this relaxation of the school district system. In addition, I also analyze the effect of relaxation of enrollment limits on the number of successful candidates for universities. As a result, a partial relaxation of the school district system will increase the disparity in the ratio of successful applicants of prestigious universities, but that of national universities and all universities does not change. This implies that partial relaxation may only affect particularly high-achieving students.
4
Chapter 2
The Effect of School Quality on Housing Rents:
Evidence from Matsue City in Japan
1
2.1. Introduction
How much do parents pay for their children’s education? Because parents’ investments in education are not only for their children but also for themselves, many parents spend substantial sums to enroll their children in a good school to obtain a high-quality education. It is important to analyze parents' concrete behavior concerning their investments in their children’s education from the perspective of equality in the public education system. However, it is difficult to observe parents’ willingness to pay because primary education is free and compulsory in Japan.
We cannot directly observe parents’ willingness to pay for public school; however, we can indirectly observe it from land prices or housing rents within a school district system. When parents purchase a house or rent an apartment, they consider the characteristics of the local public school. In other words, the value parents place on education might be capitalized as land prices or housing rents. In actuality, since real estate agencies advertise the high quality of schools in a district, the quality of schools may add capital to the land prices or housing rents.
However, endogeneity causes difficulties when estimating the value of school quality based on housing rents. Because children’s test scores are influenced by their parents’ characteristics, such as educational background or income level, a child’s good test score does not mean that high-quality education has been provided; if so, better schools would tend to be located in better neighborhoods. Furthermore, in many cases, it is impossible to observe the parents’ characteristics that influence their children's test scores, which may cause bias in estimation results.
To avoid these problems, Black (1999) uses a regression discontinuity design and focuses on houses located on opposite sides of school attendance district boundaries—the geographic lines that determine which school a child attends within a school district. By limiting the sample dwellings to
1 I would like to thank my advisor Kentaro Nakajima and Midori Wakabayashi. I also thank two anonymous referees of JJIE for useful comments and suggestions. I am also grateful to Koichi Ushijima, Jenn-Jou Chen, the participants at the 2016 Japanese Economic Association Spring Meeting, the 30th Annual Meeting of the Applied Regional Science Conference (Kobe University), and the workshop at National Chengchi University for their helpful comments. This chapter is based on Kuroda (2018) already published in Journal of the Japanese and International Economies, 50, 16-25. All remaining errors are my own.
5
those very close to the attendance district boundaries, she is able to control for unobserved characteristics.
Following Black’s (1999) methodology, I focus on apartments located within the public school boundary using data from Matsue City, the capital of Shimane Prefecture, on the main island in Japan. I estimate the causal effect of school quality on housing rents by using test scores as a proxy for school quality. The results show that the quality of the school has a significantly positive effect on the housing rents of apartments intended for families but not of those intended for singles. This result means that parents exhibit a willingness to pay to live in a better school district, but not people who are single.
Furthermore, I find that the effect of test scores on apartment rents is strong in proportion to the number of rooms and the occupied area. This result means that the more an apartment is intended for a family, the more the rent of that apartment will be affected by school quality. I also estimate the effect of junior high school test scores using the same equation. In contrast to the results for elementary schools, junior high school test scores have a nonsignificant effect on housing rents. These results may be doe to the tendency for parents of junior high school students whose income is relatively higher than the parents of elementary school students to live in their own houses instead of renting apartments, or the fact that elementary school and junior high school are treated as a continuous process.
The structure of the paper is as follows: Section 2 reviews the previous literature analyzing the effect of school quality on housing rents. Section 3 describes the empirical strategies. Section 4 discusses the data. Section 5 presents the results. Section 6 concludes.
2.2. Literature review
Many studies have considered the effects of school quality on housing rents around the world. Bogart and Cromwell (2000) analyze the effect of school redistricting on housing values in Shaker Heights, Ohio, in 1987 using data on all sales of houses between 1983 and 1994. Figlio and Lucas (2004) and Clapp, Nanda and Loss (2008) study the effects of school quality on housing prices using an individual fixed effects model and panel data to control for unobserved neighborhood characteristics. Figlio and Lucas (2004) estimate the effects of school grades on families' residential locations and housing prices using detailed data on repeated sales of individual residential properties in the state of Florida. The authors find that the housing market responds significantly to information about schools provided by school report cards, even when considering test scores and other variables. Clapp, Nanda and Loss (2008) estimate the relationship between property values and explanatory variables such as school district performance and demographic attributes using panel data from Connecticut over eleven years from 1994 to 2004. The authors find significant evidence that
6
increases in the percentage of Hispanic residents have negative effects on housing prices in Connecticut, but the evidence regarding the effects of test scores on property values is mixed.
In Japan, Yoshida, Chou, and Ushijima (2008) analyze the effect of school quality on land prices and the change in this effect after the introduction of the school choice system. The authors use achievement test scores and the ratio of enrollment in private junior high schools as proxies of school quality. In addition, they address the endogeneity problems caused by unobserved neighborhood characteristics with individual fixed effect models using panel data. They conclude that the quality of elementary schools influenced land prices in the school district, but this effect decreased with the introduction of the school choice system.
Ushijima and Yoshida (2009) estimate the effect of school quality on land prices, using panel data on land prices in special wards of Tokyo Prefecture from 2001 through 2007. The authors employ the ratio of enrollment in private and national junior high schools as a proxy of school quality. They control for unobserved neighborhood characteristics by using the individual fixed effect approach. They find that the quality of the school influenced land prices only in districts with high-quality schools, and the impact was not substantial. However, there is still room for argument about the validity of using the ratio of enrollment measure as a proxy for school quality because parents consider a variety of factors, such as budget and distance, when making decisions about schools in which to enroll their children. In addition, the authors note the possibility that the relationship between school quality and land prices could have been weakened by the introduction of the school choice system, which was implemented in many special wards during the analysis period.
On the other hand, Black (1999) developed the most reliable approach for situations in which panel data are not available. She uses a regression discontinuity design and estimates the effect of test scores on housing prices by controlling for unobserved neighborhood characteristics and by focusing on houses located close to school district boundaries that differ only by the elementary school that the children attend. As a result, she finds that parents are willing to pay more to enroll their children in schools with students who have higher test scores.
Following Black’s (1999) regression discontinuity design approach, I estimate the effect of school quality on housing rents. This paper’s contributions are as follows. First, I use detailed information on apartments because I use housing prices instead of land prices, which were employed in previous studies on Japan. With land price data, one cannot identify whether the land is actually used for a family's residence because such data do not include information on how people use the land. On the other hand, I am able to estimate and interpret the effect of test scores on housing rents more clearly because the apartment data include indices on whether the apartments are for families or single people. I am also able to analyze the difference between an apartment that may be affected by school quality and an apartment that is not so affected because parents may be concerned about the quality of the neighborhood elementary school, but single people are not.
7
Second, I clearly estimate the effect of public school quality by focusing on Matsue City, a regional city in Japan. Because the cities targeted in the previous literature in Japan were subject to the school choice system, where students can attend public schools outside of the district in which they live, the relationship between public school quality and land prices was weakened. However, in Matsue City, the school choice system was not implemented and clear school districts exist, so there should be a strong relationship between public school quality and land prices or housing rents. In addition, there are few private elementary and junior high schools in Matsue City. In areas where there are many private schools, such as Tokyo, the relationship between the quality of the public schools and housing rents in a school district may be weakened because private schools are not restricted by school districts. Furthermore, because it is easy for a child with wealthy parents to go to a private school, the results will be biased. However, these problems can be solved by focusing on Matsue City, where private schools scarcely exist. For the above reasons, I can clearly estimate the effect of public school quality on housing rents in a school district system.
2.3. Empirical strategies
I estimate the effect of school quality on housing rents using hedonic regression. I regress the test scores on housing rents with some control variables included. The estimation equation is as follows:
𝑙𝑙𝑙𝑙 𝑃𝑃𝑖𝑖𝑖𝑖𝑖𝑖 = 𝛼𝛼 + 𝛽𝛽𝛽𝛽𝑖𝑖𝑖𝑖𝑖𝑖+ 𝛿𝛿𝛿𝛿𝑖𝑖+ 𝛾𝛾𝑡𝑡𝑡𝑡𝑡𝑡𝑡𝑡𝑖𝑖+ 𝜀𝜀𝑖𝑖𝑖𝑖
where 𝑃𝑃𝑖𝑖𝑖𝑖𝑖𝑖 is the rent of apartment 𝑖𝑖, in attendance district 𝑎𝑎, in school district 𝑗𝑗. The vector 𝛽𝛽𝑖𝑖𝑖𝑖𝑖𝑖
includes characteristics of the apartment, such as the number of rooms and the age of the building, and 𝛿𝛿𝑖𝑖 is a vector of neighborhood and school district characteristics. 𝑡𝑡𝑡𝑡𝑡𝑡𝑡𝑡𝑖𝑖 is the average test
score of the public school. Because the control variables, such as educational expenditures per student or the tax rate, are not different across schools in Matsue City, unlike in previous studies, it is not necessary to consider those variables.
However, it is difficult to observe all the socioeconomic characteristics, including access to public facilities or average income in the district and the results without including these variables, may be biased. To address this problem, I apply a regression discontinuity design. I replace the vector of observed characteristics with boundary dummies that indicate apartment buildings that share an attendance district boundary. The estimation equation is as follows:
𝑙𝑙𝑙𝑙 𝑃𝑃𝑖𝑖𝑖𝑖𝑖𝑖= 𝛼𝛼 + 𝛽𝛽𝛽𝛽𝑖𝑖𝑖𝑖𝑖𝑖+ 𝛷𝛷𝛷𝛷𝑖𝑖+ 𝛾𝛾𝑡𝑡𝑡𝑡𝑡𝑡𝑡𝑡𝑖𝑖+ 𝜀𝜀𝑖𝑖𝑖𝑖𝑖𝑖
8
the value of one. This variable controls for any unobserved neighborhood characteristics shared by apartment buildings on either side of the boundary. It is assumed that apartment buildings within the same boundary have similar characteristics, such as accessibility to public facilities, amenities or average income.
Therefore, my analysis uses restricted data, such as I limited the sample to dwellings close to a boundary, after adding the boundary dummy to the equation. Specifically, I created a subset of apartments located within less than 500 m, 350 m, and 200 m from the boundary of a school district. Thereby, I am able to directly compare apartment buildings that have very similar geographic information, and it is thought that differences in the rents of apartments are caused by the ability to attend a different public school.
2.4. Data and summary statistics
2.4.1. About Matsue City
Matsue City is a regional city in southwest Japan. The population was approximately 200,000 in 2015.
There are several reasons why I focus on Matsue City. The primary reason is that there are very few private elementary and junior high schools in Matsue City. In an area where there are many private schools, the relationship between the quality of the public school and housing rents in the school district may be weakened because anyone can go to a private school regardless of their public school district. On the other hand, because there are few private schools in Matsue City, we can identify the effect of the quality of a public school on housing rents more clearly because it is difficult to receive a primary education from somewhere other than the public schools.
Furthermore, in Matsue City, the school choice system was not implemented, and a clear school district exists. Of course, if a school is very far from a dwelling, or if parents change their address during the school year, they can send their child to a school located outside their own school district. However, that situation is very rare.
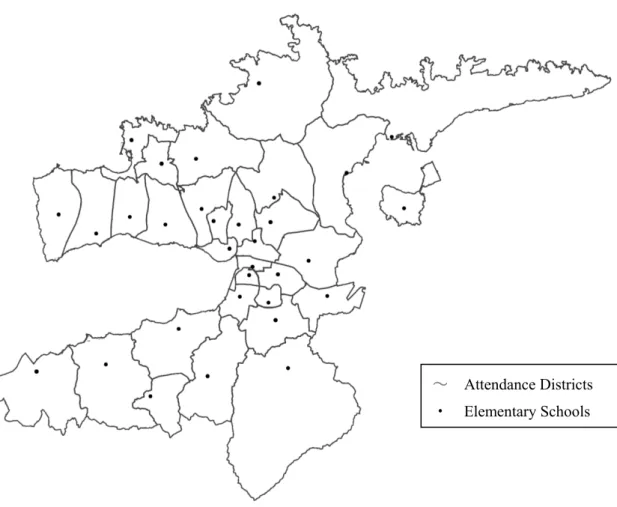
Figure 2.1 presents a map of the school districts in Matsue City used for this analysis. The bold black lines represent the boundary lines of the school districts, and only one public school exists in each school district. There are 35 public schools in Matsue City, but the number of public schools used in this analysis is 23 because I cannot use data for schools in non-urban areas where there are very few apartments in the district or the district has a branch school that does not release its test scores due to a limited number of students. Furthermore, when the boundary dummy of a school district is estimated, a boundary divided by a large object such as a river or the site of a castle, is
9
omitted from my dataset, because the neighborhood characteristics on different sides of such an attendance district boundary could be different.
Figure 2.1 Elementary School Districts of Matsue City
2.4.2. Data
I use the apartment information from three major rental information sites: HOME MATE, CHINTAI, and SUUMO.2 Each apartment has data on the address, the rent, the number of rooms, the layout (having a living room or dining room), the occupied area (㎡), the floor level, the number
2 These rental information websites are representative in Japan and are widely used by people searching for apartments. Because each site includes different apartments, I merged the data obtained from these web sites for the analysis.
~ Attendance Districts ・ Elementary Schools
10
of floors in the building, the age of the building and the building’s construction. In addition, apartments that have two or more rooms are defined as intended for a family. This definition is generally used by real estate agents in Japan.
Table 2.1 shows the summary statistics used in my analysis. The full data sample consists of 2,686 apartments. I created several dummy variables using the above apartment information. The living dummy and dining dummy variables equal one if the apartment has a living or dining room, respectively. The “for a family” dummy equals one if the apartment has two or more rooms. Furthermore, I established dummy variables for each style of building construction, such as steel frame, lightweight steel, reinforced concrete and earthquake-resistant steel (the baseline is wooden construction). Additionally, using address information and Google Maps, I calculated the distance from each dwelling to the nearest attendance boundary, the nearest train station, Matsue Station and Shimane University.3
I obtained statistical data about Matsue City and information about its school districts from Matsue City’s official website. I used the number of students per teacher as a characteristic of the schools, and I used the age groups of less than 15 years of age and 65 or older, the sex ratio, and the average household size in the district as variables to control for local characteristics.
Test scores, which are used as a proxy for the quality of schools, are derived from two types of tests: 6th grade elementary school students take the National Assessment of Academic Ability (NAAA), and 4th and 5th grade elementary school students take the Shimane Academic Ability Survey (SAAS). I use the sum of the math and language test scores, averaged over 3 years, as the test score for each school. The NAAA is the scholastic ability investigation examination that the Ministry of Education, Culture, Sports, Science and Technology (MEXT) has carried out once per year since 2007, and it is applied to sixth and ninth graders. The SAAS is the scholastic ability investigation examination that Shimane prefecture originally carried out, and it is applied to 4th, 5th, and 6th graders in the public elementary schools and students in the public junior high schools. In Matsue City, however, the SAAS was applied only to 4th, 5th, 7th, and 8th grade students because the 6th and the 9th graders took the NAAA instead of the SAAS.
2.4.3. Who lives in the rental house?
Because there are many people who have their own houses in local cities in Japan, it is necessary to consider whether the parents with children of elementary school going age live in the apartments. In this section, I show the relationship between household type and housing form in Shimane
3 In Japan, there is high demand from university students for apartments close to universities, and the supply of apartments intended for students is also high in those areas. Therefore, in order to control for this influence, I added the distance from the university as an independent variable.
11 prefecture.4
Table 2.2 shows the number of households by type of household in Shimane prefecture in 2013. The number of households in Shimane prefecture is 254,700, of which 185,400 households (73%) live in owned houses and 69,300 households (27%) live in rented houses. However, households which have elementary school children (in this table, their age is assumed to be under 9 years old) exhibit a different tendency, because a great number of older people tend to live in owned houses rather than younger people. Of all the three to five person households, 5,100 households live in owned houses and 8,800 households live in rented houses. In other words, over 60% of married couples with elementary school children live in rented houses; therefore, it is reasonable to use the rented house for this study.
4 Matsue City is the capital city of Shimane Prefecture, which has approximately one-third of the population and households of Shimane prefecture. Due to data constraints, I explain the information of Shimane prefecture instead of Matsue City.
12
Table 2.1 Summary Statistics
Mean S.D. Min Max Mean S.D. Min Max Housing rent (YEN) 56724 12376 17000 135000 56577 13154 23000 135000 School characteristics
Elementary school test score 67.35 2.77 61.58 72.75 67.92 2.89 61.58 72.75 Junior high school test score 63.83 2.06 59.75 66.80 64.03 1.88 59.75 66.80 House characteristics
Number of rooms 1.67 0.69 1 4 1.65 0.72 1 4 Living Dummy 0.39 0.49 0 1 0.38 0.48 0 1 Dining Dummy 0.73 0.45 0 1 0.70 0.46 0 1 For a family Dummy 0.55 0.50 0 1 0.52 0.50 0 1 Occupied area (㎡) 44.30 14.43 12.15 157.86 43.28 14.79 15.60 106.06 Number of floors 2.60 1.55 1 14 2.72 1.67 1 14 Age of building 14.26 9.60 0 68 15.67 10.36 0 49 Steel frame Dummy 0.33 0.47 0 1 0.31 0.46 0 1 Lightweight steel Dummy 0.20 0.40 0 1 0.22 0.42 0 1 Reinforced concrete Dummy 0.13 0.34 0 1 0.17 0.38 0 1 Earthquake‐resistant Steel 0.00 0.05 0 1 0 0 0 0 Distance from nearest station(km) 1.78 1.05 0.03 5.90 1.70 0.94 0.03 4.81 Distance from Matsue station(km) 3.18 2.25 0.10 17.06 2.63 1.72 0.10 9.15 Distance from Shimane University(km) 3.78 2.56 0.12 17.89 3.65 2.40 0.12 10.64 Distance from elementary school(km) 0.82 0.50 0.10 3.96 0.87 0.53 0.10 3.96 Distance from junior high school(km) 1.29 0.59 0.09 3.73 1.27 0.61 0.09 3.24 Neighborhood characteristics
Pupil/teacher ratio 17.30 2.88 6.17 21.56 17.07 2.71 9.00 21.56 Percent 0-15 years old 0.15 0.04 0.01 0.36 0.15 0.04 0.01 0.36 Percent 65+ years old 0.24 0.07 0.00 0.55 0.23 0.08 0.04 0.55 Parcent mele 0.48 0.02 0.41 0.56 0.48 0.02 0.41 0.53 Average number of household 2.25 0.28 1.47 3.28 2.20 0.29 1.48 3.18 N
Mean S.D. Min Max Mean S.D. Min Max Housing rent (YEN) 56671 13353 23000 135000 55450 12373 23000 110000 School characteristics
Elementary school test score 67.87 2.81 61.58 72.75 67.55 2.77 61.58 72.75 Junior high school test score 64.16 1.81 59.75 66.80 64.14 1.82 59.75 66.80 House characteristics
Number of rooms 1.65 0.73 1 4 1.60 0.72 1 4 Living Dummy 0.39 0.49 0 1 0.37 0.48 0 1 Dining Dummy 0.71 0.46 0 1 0.70 0.46 0 1 For a family Dummy 0.51 0.50 0 1 0.48 0.50 0 1 Occupied area (㎡) 43.28 14.74 15.60 106.06 42.35 14.50 15.60 106.06 Number of floors 2.79 1.76 1 14 2.73 1.64 1 14 Age of building 15.68 10.74 0 49 15.17 11.09 0 46 Steel frame Dummy 0.29 0.45 0 1 0.25 0.43 0 1 Lightweight steel Dummy 0.23 0.42 0 1 0.20 0.40 0 1 Reinforced concrete Dummy 0.19 0.39 0 1 0.19 0.39 0 1 Earthquake‐resistant Steel 0 0 0 0 0 0 0 0 Distance from nearest station(km) 1.67 0.95 0.03 4.81 1.7079 1.0489 0.219 4.807 Distance from Matsue station(km) 2.65 1.81 0.10 9.15 2.81 2.05 0.23 9.15 Distance from Shimane University(km) 3.62 2.37 0.12 10.64 3.56 2.31 0.12 10.64 Distance from elementary school(km) 0.91 0.52 0.10 3.96 0.98 0.51 0.10 3.96 Distance from junior high school(km) 1.28 0.63 0.09 3.24 1.35 0.65 0.09 3.24 Neighborhood characteristics
Pupil/teacher ratio 16.97 2.68 9.00 21.56 16.86 2.61 9.00 21.56 Percent 0-15 years old 0.15 0.05 0.01 0.36 0.15 0.05 0.02 0.36 Percent 65+ years old 0.23 0.08 0.04 0.55 0.23 0.08 0.04 0.55 Parcent mele 0.48 0.02 0.41 0.53 0.48 0.02 0.42 0.53 Average number of household 2.19 0.30 1.48 3.18 2.20 0.31 1.48 3.18
N 1088 718
Full Sample 500m
2686 1423
13
Table 2.2 Number of Household Living in Owned Houses and Rented Houses
2.5. Results and discussion
2.5.1. Baseline Results
Table 2.3 shows the baseline results. Column (1) shows the results using the full sample and not including boundary fixed effects. It shows that the elementary school test score has a significantly positive effect on housing rents, similar to Black’s (1999) result. Furthermore, the other major variables also show a similar tendency. However, these results still have the problem of unobserved neighborhood characteristics.
I then restrict the sample based on distance from a boundary to control for unobserved neighborhood heterogeneity. Column (2) shows the results when restricting the sample to apartment buildings located within 500 m of a boundary, using the boundary dummy instead of census variables. Columns (3) and (4) show the results when restricting the sample to apartment buildings located within 350 m and 200 m of a boundary, respectively. Unlike previous studies, these results show that the test score does not have a significantly positive effect on housing rents. In addition, to show that the difference between the results of column (1) and columns (2)–(4) is not caused by the sample size but the boundary fixed effects, I estimate the regression without the boundary dummy for the sample located within 200 m of a boundary, as shown in column (5). Column (5) shows a similar trend to column (1), except for the significance level of the test score coefficient.
The results in Table 2.3 indicate that the public elementary school test score does not affect the housing rents of apartments within its attendance district. One of the reasons for this result is the different dependent variables used in this study compared to previous studies. In previous studies, the dependent variable was the land price or the house price. However, in this study, I use the rent amount for apartments or condominiums, and approximately half of these dwellings are one-room
Type of household Owned houses Rented houses Total
Total 185,400 69,300 254,700
Single person households 33,100 35,000 68,100 Two person households 60,800 14,000 74,800 Three to five person households
married couple and children (under 9 years old) 5,100 8,900 14,000 married couple and children (from 10 to 17 years old) 7,600 4,200 11,800 married couple and children (over 18 years old) 43,400 3,300 46,700
others 15,000 3,000 18,000
Over six person households 15,300 800 16,100 ※Created by editing 2013 Housing and Land Survey (Statistics Bureau, Ministry of Internal Affairs and
14
apartments designed for a single person. Naturally, only a family with children will care about the quality of the schools when renting an apartment. Therefore, the quality of the school will only affect the rent of apartments intended for a family.
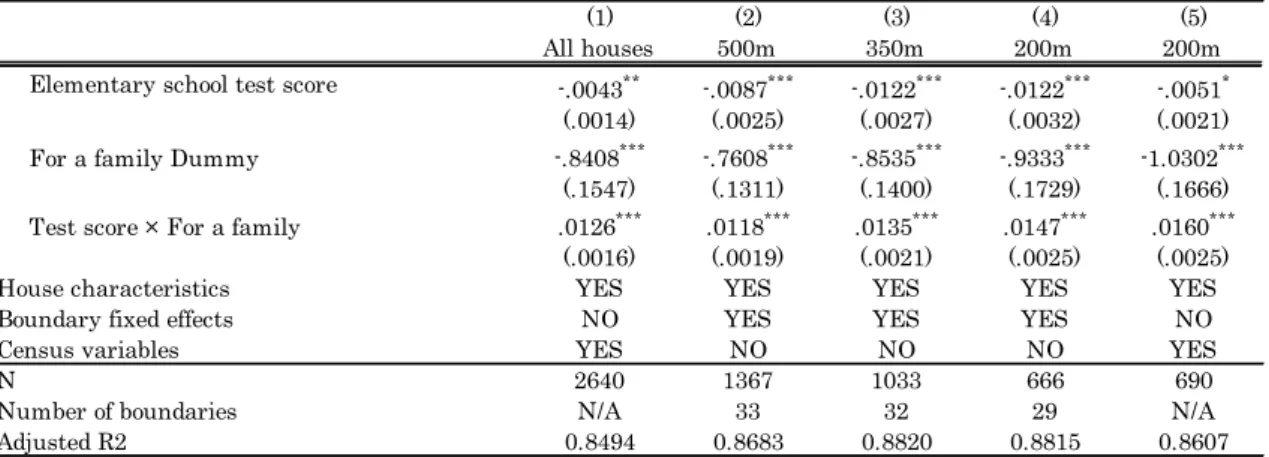
To analyze this issue in detail, I introduced the “for a family” dummy and added the interaction term of the test score and the dummy into the equation. The results are shown in Table 2.4.
Column (1) of Table 2.4 shows the results using the full sample while not controlling for boundary fixed effects but including the “for a family” dummy and the interaction term of the test score and the dummy. The coefficient of the test score is negative and significant, indicating that the higher the test score is, the lower the housing rent will be. The “for a family” dummy is also negative and significant. This means that family-oriented apartments had lower rents than apartments intended for a single person. However, the interaction term of the test score and the “for a family” dummy is positive and significant; thus, for families, the rent increases as the test score rises.
Column (2) shows the results when restricting the sample to apartment buildings located within 500 m of a boundary while controlling for boundary fixed effects and including the “for a family” dummy and the interaction term. Columns (3) and (4) show the results when restricting the sample to apartment buildings located within 350 m and 200 m of a boundary, respectively, using the same variables as those used in column (2). These results show the same tendency as in column (1) and indicate that the test score has a significantly positive effect on housing rents only for apartments intended for a family, even when controlling for boundary fixed effects. Column (5) shows the results using the same equation as in column (1) in Table 2.4 for the sample located within 200 m of a boundary. The results show a similar trend to column (1) and indicate that the difference between the results of column (1) and columns (2)-(4) is not caused by the sample size.
In summary, the results in Table 2.4 show that the test score has a significantly positive effect on the rent for an apartment intended for a family and a significantly negative effect on the rent for an apartment intended for a single person.
Regarding the impact of the regression results, the results for apartment buildings that are only 200 m from a boundary (column (4)) suggest that a 10 percent increase in the test score leads to an approximately 1.7 percent increase in housing rents. This implies that parents are willing to pay JPY921 more in monthly housing rent for a 6.7 point increase in the test score (the mean of housing rents is approximately JPY55,000, and the mean of test scores is approximately 67).
In the specification in Table 2.4, I pool together both single and family houses, and which assume all the house characteristics like living dummy, age of buildings, and so on, have the same impact on housing prices for singles and families alike. I relax this assumption by separating houses for singles and families and estimating them independently. The results are shown in Table 2.5. Column (1) shows the results using family-oriented apartments while not controlling for boundary fixed effects and indicates that the test score has a significantly positive effect on housing rents. Column (2)
15
shows the results when restricting the sample to apartments intended for families located within 200 m of a boundary and using the boundary dummy. This result also shows that the test score has a significantly positive effect on housing rents. Column (3) shows the results using apartments intended for a single person while not controlling for boundary fixed effects and indicates that the test score has a significantly negative effect on housing rents of single-person apartment. However, from the results in column (4) obtained when restricting the sample to apartments intended for a single person located within 200 m of a boundary and using the boundary dummy, I find that the quality of the school does not have a significant effect on the single-person apartments. This suggests that there is no difference in amenity situation across school district boundaries.
16
Table 2.3 Baseline Estimation
(1) (2) (3) (4) (5) All houses 500m 350m 200m 200m Elementary school test score .0029** -0.0033 -.0065** -0.0055 0.0025
(.0008) (.0021) (.0024) (.0028) (.0017) House characteristics Number of rooms .0793*** .0852*** .1049*** .1138*** .1016*** (.0126) (.0151) (.0131) (.0125) (.0114) Living Dummy .0359*** .0467*** .0681*** .0732*** .0739*** (.0081) (.0111) (.0110) (.0144) (.0122) Dining Dummy .0501*** .0513*** .0436*** .0363** .0293* (.0091) (.0103) (.0109) (.0134) (.0128) Occupied area (㎡) .0073*** .0078*** .0067*** .0062*** .0067*** (.0008) (.0009) (.0008) (.0008) (.0007) Number of floors .0216*** .0152*** .0150*** .0121** .0121** (.0022) (.0026) (.0028) (.0044) (.0044) Age of building -.0126*** -.0126*** -.0125*** -.0129*** -.0122*** (.0005) (.0005) (.0004) (.0005) (.0005) Steel frame Dummy .0228*** .0438*** .0488*** .0478*** .0293**
(.0110) (.0074) (.0091) (.0118) (.0097) Lightweight steel Dummy .0654*** .0670*** .0747*** .0686*** .0719***
(.0065) (.0078) (.0094) (.0116) (.0095) Reinforced concrete Dummy .0240* .0573*** .0688*** .0601*** .0446**
(.0091) (.0108) (.0120) (.0147) (.0157) Earthquake‐resistant Steel .1291***
(.0174)
Distance from nearest station (km) -.0239** -.0396 -.0549 -.0747 -.0420*
(.0091) (.0271) (.0290) (.0475) (.0204) Distance from nearest station squared .0033 .0075 -.0106* .0126 -.0075*
(.0019) (.0052) (.0048) (.0067) (.0034) Distance from Matsue station (km) -.0304*** .0057 -.0045 .0630 -.0204
(.0037) (.0037) (.0230) (.0354) (.0151) Distance from Matsue station squared .0009*** -.0033 .0030 -.0114** -.0003
(.0002) (.0025) (.0028) (.0041) (.0015) Distance from Shimane University (km) .0039 .0079* -.0086* .0124* .0072
(.0020) (.0039) (.0043) (.0052) (.0051) Distance from Shimane University squared -.0003 -.0010* -.0011** -.0014* -.0011
(.0002) (.0004) (.0004) (.0006) (.0006) Distance from elementary school (km) -.0095 -.0345* -.0247 -.0216 -.00365
(.0102) (.0161) (.0201) (.0266) (.0234) Distance from elementary school squared .0041 .0037 .0003 .0006 -.0124*
(.0026) (.0041) (.0049) (.0066) (.0058) Distance from junior high school (km) -.0032*** -.0311 -.0116*** -.0007 -.0429
(.0134) (.0259) (.0313) (.0378) (.0281) Distance from junior high school squared .0048 .0003 .0039 -.0114 .0064
(.0041) (.0075) (.0090) (.0093) (.0085) Boundary fixed effects NO YES YES YES NO
Census variables YES NO NO NO YES
N 2642 1369 1035 668 692
Number of boundaries N/A 33 32 29 N/A
Adjusted R2 0.8442 0.8641 0.8758 0.8741 0.852 ※*, ** and *** indicate statistical significance at 5%, 1%, 0.1%, respectively.
17
Table 2.4 Family vs. Single: dummy variable
Table 2.5 Family vs. Single: subsample
2.5.2. Robustness
2.5.2.1 Definition of “For a Family”
In this section, I check the robustness of the definition of “for a family”. In the analysis in Table 2.4, I define an apartment with more than two rooms as an apartment intended for a family based on the definition used on rental housing information websites. However, in actuality, the more rooms and the larger the occupied area is, the more the dwelling is suitable for a family. According to Table 2.6 which shows the number of each type of household by occupied area of rented houses in Shimane prefecture, the ratio of two or more person households increases as the occupied area increases. In addition, the share of households with elementary school children is relatively high in
(1) (2) (3) (4) (5) All houses 500m 350m 200m 200m Elementary school test score -.0043** -.0087*** -.0122*** -.0122*** -.0051*
(.0014) (.0025) (.0027) (.0032) (.0021) For a family Dummy -.8408*** -.7608*** -.8535*** -.9333*** -1.0302***
(.1547) (.1311) (.1400) (.1729) (.1666) Test score × For a family .0126*** .0118*** .0135*** .0147*** .0160***
(.0016) (.0019) (.0021) (.0025) (.0025) House characteristics YES YES YES YES YES Boundary fixed effects NO YES YES YES NO
Census variables YES NO NO NO YES
N 2640 1367 1033 666 690
Number of boundaries N/A 33 32 29 N/A
Adjusted R2 0.8494 0.8683 0.8820 0.8815 0.8607 ※*, ** and *** indicate statistical significance at 5%, 1%, 0.1%, respectively.
※Clustered standerd errors at the attendance district level are in parenthesis.
(1) (2) (3) (4) All houses 200m All houses 200m Elementary school test score .0071*** .0086** -.0035** -.0084
(.0009) (.0029) (.0013) (.0047) House characteristics YES YES YES YES Boundary fixed effects NO YES NO YES Census variables YES NO YES NO
N 1442 303 1184 339
Number of boundaries N/A 23 N/A 19 Adjusted R2 0.8042 0.8809 0.8247 0.8596 ※*, ** and *** indicate statistical significance at 5%, 1%, 0.1%, respectively.
※Standard errors are adjusted for clustering at the attendance district level.
18
apartments with areas between 29.7 to 59.3 square meters. Therefore, I estimate whether the effect from the test score becomes stronger as the degree of suitability for a family becomes larger.
Table 2.7 shows the results using the interaction term of the test score and the family-related characteristics instead of the “for a family” dummy. Columns (1) and (2) show the results when using the interaction term of the test score and the number of rooms. Column (1) shows the results using the full sample and not including boundary fixed effects. Column (2) shows the results when restricting the sample to apartment buildings located within 200 m of a boundary using the boundary dummy. The coefficients for the interaction term of the test score and the number of rooms are significantly positive at the 0.1 percent level; this means that the effect of the test score on housing rents is stronger in proportion to the number of rooms. The results shown in columns (3) and (4) are obtained using the interaction term of the test score and the occupied area. Column (3) shows the results using the full sample and not including boundary fixed effects. Column (4) shows the results when restricting the sample to apartment buildings located within 200 m of a boundary using the boundary dummy. The coefficients for the interaction term of the test score and the occupied area are significantly positive at the 0.1 percent level in column (3) and at the 1% level in column (4); thus, the larger the occupied area is, the stronger the effect of the test score on housing rents. According to Table 2.6, the share of households with elementary school children (under 9 years old) living in houses starts to decrease as the area of houses exceeds 49.5 square meters. This implies that the relationship between suitability for family which has elementary school children and the occupied area of apartment does not increase monotonically. To address the concern, I construct the "family volume zone" dummy. This dummy is equal to one if the occupied area is from 29.7 to 59.3 square meters where the relatively large share is of families with elementary school children.Columns (5) and (6) in Table 2.7 show the results which are obtained using this dummy instead of using occupied area. Column (5) shows the results using the full sample and without including boundary fixed effects and column (6) shows the results when restricting the sample to apartment buildings located within 200 m of a boundary using the boundary dummy. The coefficients for the interaction term of the test score and "family volume zone" dummy are significantly positive. The results indicate that the test scores have a significantly positive effect on apartment rents for families with elementary school children. These results also indicate that the rent for an apartment intended for a family tends to be more affected by the test score than that intended for a single person.
19
Table 2.6 Number of Households by Occupied Area of Rooms
Table 2.7 Robustness of “for a family”
2.5.2.2 Other Concerns
In this section, I conduct further robustness checks to address other potential concerns.
First, parents who are strongly interested in school quality may be more likely to be also interested in apartment quality. Because apartment quality strongly correlates with housing rent, if there is a
Total under 9.8 9.9-19.7 19.8-29.6 29.7-39.5 39.6-49.4 49.5-59.3 59.4-79.1 over 79.2 Total 69,300 700 16,000 14,600 17,800 10,900 4,400 3,800 1,100 Single person households 35,000 700 14,300 9,000 6,200 2,800 1,100 700 100 (.505) (1.00) (.894) (.616) (.348) (.257) (.250) (.184) (.091) Two person households 14,000 NA 800 2,200 5,200 2,700 1,400 1,300 400
(.202) (.050) (.151) (.292) (.248) (.318) (.342) (.364) Three to five person households
married couple and children (under 9 years old) 8900 0 300 1400 3200 2200 800 500 0
(.128) (.019) (.096) (.180) (.202) (.182) (.132)
married couple and children (from 10 to 17 years old) 4200 NA 100 600 1300 1200 400 300 100 (.061) (.006) (.041) (.073) (.110) (.091) (.079) (.091)
others 6400 0 400 1200 1500 1400 600 800 0
(.092) (.025) (.082) (.084) (.128) (.136) (.211) Over six persons households 800 NA NA 0 100 200 100 200 100
(.012) (.006) (.018) (.023) (.053) (.091) ※Created by editing 2013 Housing and Land Survey (Statistics Bureau, Ministry of Internal Affairs and Communications)
※According to the definition of the data set, I converted tatami unit to square meters at a rate of 1.65 square meters per tatami unit. ※The ratio of each type of households for each group of occupied area in parentheses.
Occpied area (square meters)
(1) (2) (3) (4) (5) (6)
All houses 200m All houses 200m All houses 200m Elementary school test score -.0140*** -.0206*** -.0183*** -.0198** .0003 -.0124**
(.0023) (.0042) (.0033) (.0062) (.0015) (.0040) Test score × Number of rooms .0097*** .0091***
(.0011) (.0019)
Test score × Occupied area .0005*** .0004** (.0001) (.0001)
Test score × Family volume zone Dummy .0051** .0118** (.0015) (.0038)
Family volume zone Dummy -.2988** -.7662**
(.1047) (.2543) Number of Rooms -.5772*** -.5059*** .0753*** .1086*** .0808*** .1071***
(.0798) (.1282) (.0129) (.0128) (.0104) (.0130) Occupied area .0071*** .0061*** -.0247*** -.0192* .0075*** .0065* (.0021) (.0008) (.0044) (.0085) (.0007) (.0008)
Other house characteristics YES YES YES YES YES YES
Boundary fixed effects NO YES NO YES NO YES
Census variables YES NO YES NO YES NO
N 2641 667 2641 667 2640 666
Number of boundaries N/A 29 N/A 29 N/A 29
Adjusted R2 0.8504 0.8782 0.8508 0.8765 0.8497 0.8796
※*, ** and *** indicate statistical significance at 5%, 1%, 0.1%, respectively. ※Standard errors are adjusted for clustering at the attendance district level.
20
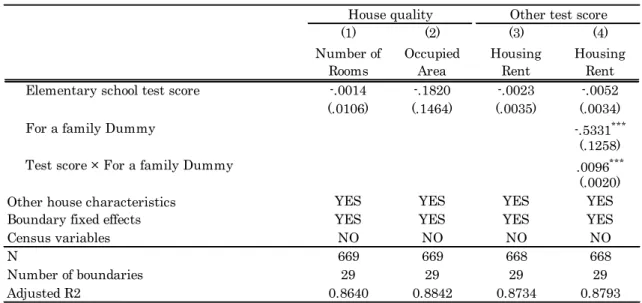
positive correlation between school quality and the quality of an apartment, our findings may only represent housing quality effects instead of school quality effects. To address this concern, I regress the apartment quality, such as the number of rooms and the occupied area, on the test score (shown in Table 2.8, column (1) and column (2)). Column (1) shows that the quality of the school does not affect the number of rooms, and column (2) shows that the school quality does not affect the occupied area. These results demonstrate that there is no positive correlation between the quality of the school and the quality of the apartment.
Second concern is that the test score used in this study might be accidental. Because the test score used in this paper is from a single year, using different test scores from other years may produce different results. Therefore, I estimate the same equation from the previous estimation using the other year’s test score, as shown in column (3) and column (4). Column (3) shows the results using the full sample, and column (4) shows the results when restricting the sample to apartment buildings located within 200 m of a boundary, using the boundary dummy and the “for a family” dummy. The results in both columns are somewhat different in magnitude, but the positive and negative directions are the same as the main results. Thus, I can emphasize the validity of using these test scores as a proxy of school quality.
Table 2.8 Sensitivity Tests
(1) (2) (3) (4)
Number of
Rooms OccupiedArea HousingRent HousingRent
Elementary school test score -.0014 -.1820 -.0023 -.0052
(.0106) (.1464) (.0035) (.0034)
For a family Dummy -.5331***
(.1258)
Test score × For a family Dummy .0096***
(.0020)
Other house characteristics YES YES YES YES
Boundary fixed effects YES YES YES YES
Census variables NO NO NO NO
N 669 669 668 668
Number of boundaries 29 29 29 29
Adjusted R2 0.8640 0.8842 0.8734 0.8793
※*, ** and *** indicate statistical significance at 5%, 1%, 0.1%, respectively.
※Standard errors are adjusted for clustering at the attendance district level.
21
Third concern is that other local characteristics may coincide with the school district. In Matsue City, a local community center district coincides with the attendance district. Local community would be one of the determinants of housing rents. Because the local community center provides various services to residents in the district, unobserved characteristics of local community may be confounded with school quality. However, a boundary of local community center district is not as strict as an attendance district boundary, and according to the website on local community center, residents outside the district can receive services if they wish. Thereby the unobserved characteristics of local community are considered to change continuously. On the other hand, school districts are defined strictly and students are not allowed to go to a school located in a different district. In addition, a local community center provides services not only for families with children but also for residents regardless of age, gender, or family structure. In this sense, community quality will affect the housing rents for families and singles. However, the main results indicate that school quality only affect family-oriented apartments significantly. Furthermore, Table 2.6 shows that there is no effect of school quality on the housing rents for a single person. Above results suggest that housing rent premium for families estimated in my main analysis does not necessarily include the community quality premium.
2.5.2.3 Junior high school
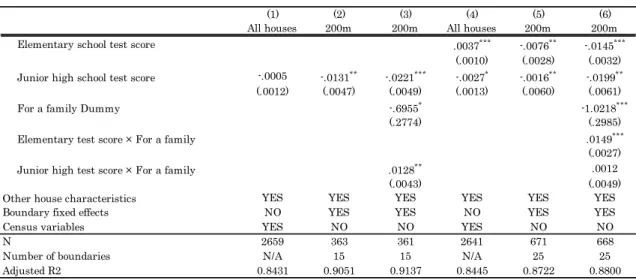
The above results show that there is a significantly positive correlation between the elementary school test score and housing rents. However, in Matsue City, the elementary school districts are completely included in junior high school districts (see Figure 2.2), so parents may consider the quality of the junior high school rather than the elementary school. To address this concern, in this section, I analyze not only the elementary school test scores but also the test scores of the junior high schools.
Table 2.9 shows the results when estimating the equation using the junior high school test scores and the junior high school district boundaries. Columns (1)-(3) show the results when using the junior high school test score instead of the elementary school test score. Column (1) shows the results using the full sample. Column (2) shows the results when restricting the sample to apartment buildings located within 200 m of a boundary, using the boundary dummy. Column (3) shows the results when restricting the sample to apartment buildings located within 200 m of a boundary, using the boundary dummy and the “for a family” dummy. These results show that the junior high school test score has a positive and significant effect on housing rents of apartments for families and show the same tendency as the results of the estimation using the elementary school test score. Of course, in this analysis, it is not possible to distinguish between the effect of an elementary school and the effect of a junior high school.
22
high school test score, as shown in columns (4)-(6). Column (4) shows the results using the full sample. Column (5) shows the results when restricting the sample to apartment buildings located within 200 m of a boundary, using the boundary dummy. Column (6) shows the results when restricting the sample to apartment buildings located within 200 m of a boundary, using the boundary dummy and the “for a family” dummy. Based on the results in column (6), the effect of the elementary school test score remains positive and significant, but it turns out that the effect of the junior high school test score is nonsignificant. These results indicate that only the elementary school test score has a significantly positive effect on housing rents, and the junior high school test score has a nonsignificant effect on housing rents of apartments intended for a family.
The possible reasons for these results are as follows. First, the variation in junior high school test scores is small in comparison to the elementary school test scores because the number of junior high schools is smaller. Second, elementary schools and junior high schools may be considered a continuous integrated process, and parents make decisions about their residential area only when their children enter elementary school. In Matsue City, the attendance districts for the junior high schools are combined with the elementary school attendance districts; therefore, an elementary school’s students are schoolmates of the junior high school’s students. Thus, parents and children may refuse to change schools when entering junior high school. Third, parents who have children in junior high school may have a higher tendency to have their own house instead of renting an apartment in comparison to those with elementary school children because they are older and their income and social status is higher. Actually, Table 2.2 shows that family who has children aged from 10 to 17 are more likely to live in owned houses than family who has children under 9 years of age.
23
Figure 2.2 Junior High School Districts of Matsue City
Table 2.9 Using Junior High School Data
(1) (2) (3) (4) (5) (6)
All houses 200m 200m All houses 200m 200m Elementary school test score .0037*** -.0076** -.0145***
(.0010) (.0028) (.0032) Junior high school test score -.0005 -.0131** -.0221*** -.0027* -.0016** -.0199** (.0012) (.0047) (.0049) (.0013) (.0060) (.0061)
For a family Dummy -.6955* -1.0218***
(.2774) (.2985)
Elementary test score × For a family .0149***
(.0027)
Junior high test score × For a family .0128** .0012
(.0043) (.0049)
Other house characteristics YES YES YES YES YES YES
Boundary fixed effects NO YES YES NO YES YES
Census variables YES NO NO YES NO NO
N 2659 363 361 2641 671 668
Number of boundaries N/A 15 15 N/A 25 25
Adjusted R2 0.8431 0.9051 0.9137 0.8445 0.8722 0.8800
※*, ** and *** indicate statistical significance at 5%, 1%, 0.1%, respectively. ※Clustered standerd errors at the attendance district level are in parenthesis.
~ Attendance Districts
24
2.6. Conclusion
In this paper, I estimate the effect of elementary school quality on housing rents using a regression discontinuity design. I find that school quality has a significantly positive effect on the housing rents of apartments intended for families. This result shows that parents are willing to pay more to send their child to a better school. Specifically, a 10 percent increase in the test score leads to an approximately 1.7 percent increase in housing rents.
In contrast, the test score has a negative or nonsignificant effect on the housing rents of apartments for a single person. This result indicates that the relative demand for a single room decreases in districts that have better schools because university students and single people, who are considered to be the main consumers of single rooms, do not consider school quality.
Compared with previous studies of Japan, my test score analysis shows a strong positive effect and a larger magnitude. There are several reasons why these results differ. First, there are many private schools in Tokyo, which was analyzed in the previous research, so the effect of public elementary schools may be weakened. Next, land prices were used in the previous studies, and land prices do not include information about who is actually using the land and for what purpose, so the results may be diluted. On the other hand, in this paper, I can determine whether a property is for families by using data on rental housing. Furthermore, by analyzing Matsue City, where there are few private schools, I am able to estimate the effect of public elementary schools more precisely. Therefore, I can conclude that the quality of the public elementary school is certainly capitalized in rental properties in the surrounding area. However, in Japan, educational environments differ greatly between large metropolitan areas and other areas, so it is necessary to consider the possibility that the results of this paper are unique to Matsue City. In addition, since this study uses only rental housing data, further study is needed as to whether the test score has similar effect on families which live in owned houses.