Normal reference values for left atrial strains and strain rates in school children assessed using two‑dimensional
speckle‑tracking echocardiography
日本大学医学部小児科学系小児科学分野
神保 詩乃
申請年 2020 年
指導教員 森岡 一朗
https://doi.org/10.1007/s00380-020-01594-0 ORIGINAL ARTICLE
Normal reference values for left atrial strains and strain rates
in school children assessed using two‑dimensional speckle‑tracking echocardiography
Shino Jimbo
1· Nobutaka Noto
1· Hirotsugu Okuma
1· Masataka Kato
1· Akiko Komori
1· Mamoru Ayusawa
1· Ichiro Morioka
1Received: 26 November 2019 / Accepted: 27 March 2020
© Springer Japan KK, part of Springer Nature 2020
Abstract
Left atrium (LA) function is a known predictive marker of heart failure in adults. Few reports of LA function analyses using LA strain (ɛ) and strain rate (SR) measurements in children exist. Thus, this study aimed to determine normal reference values for LA ɛ and SR in healthy school children and to investigate methods of interpreting LA function data based on maturational changes using two-dimensional speckle-tracking echocardiography (2DSTE). We recruited 112 healthy school children (median age 12.0 years; range 6–16 years). LA ɛ and SR were investigated using 2DSTE multi-vendor analysis software (TomTec Imaging Systems, Germany) and compared to Doppler parameters and LA volumes measured by the conventional method. The onset of the P wave was selected as the reference point for the LA ɛ analysis. Normal ranges of LA ɛ [reservoir (ɛRS), conduit (ɛCD), or contractile (ɛCT)] and positive SR (SR
POS), early negative SR (SR
EN), and late negative SR (SR
LN) were obtained using Z-score models via the lambda-mu-sigma method. According to the Z-score curves, all ɛ showed slight falling or continuous flat lines against age, body surface area (BSA), or heart rate (HR); however, ɛ CT showed modestly positive associations with HR. As for SR, the Z-score curves showed falling lines against age and BSA. In contrast, Z-score curves for SR
ENand SR
LNshowed rising lines against HR. SR
ENwas independent of E/e′ and was negatively correlated with LA volume indexed against BSA. This study demonstrated the normal reference values for LA ɛ and SR using 2DSTE in school children. The present results recommended that LA ɛ should be evaluated together with changes in LA SR for accurate assessment, considering maturational changes including age, BSA, and HR in school children.
Keywords Left atrial function · Left atrial strain · Left atrial strain rate · Left atrial volume · Two-dimensional speckle- tracking echocardiography
Introduction
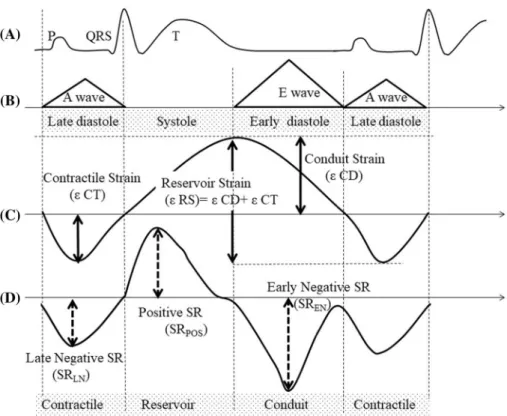
The left atrium (LA) plays an important role in the left ven- tricle (LV) performance throughout the cardiac cycle. The LA works as a reservoir during ventricular systole and iso- volumic relaxation, a conduit that manages flow from the pulmonary veins to the ventricle during early diastole, and has an active role in the cardiac cycle by contracting dur- ing late diastole (Fig. 1). Doppler echocardiographic indices
(trans-mitral LV inflow velocities and tissue Doppler mitral annular velocities) are well-known and useful parameters for grading diastolic dysfunction. Recently, several reports have demonstrated that three-dimensional speckle-tracking echo- cardiography (3DSTE) can derive complicated LA geometry precisely and reproducibly [1, 2]. The normal values and maturational changes using 3DSTE have been reported pre- viously [1]. Even if 3DSTE becomes popular for LA analy- sis, the clinical practicality of two-dimensional speckle- tracking echocardiography (2DSTE) remains unchanged.
Computed tomography (CT) and magnetic resonance imag- ing (MRI) are also able to measure LA function; however, they are limited by their temporal resolution [3]. Because 2DSTE is easy to perform during a short period of time and has a good temporal resolution, it could be appropriate for pediatric analyses. LA strain (ɛ) using 2DSTE has been
* Shino Jimbo
[email protected]
1
Department of Pediatric and Child Health, Nihon University
School of Medicine, 30-1 Ohyaguchi-kamicho, Itabashi-ku,
Tokyo 173-8610, Japan
reported to be a predictive marker of cardiac events with good reproducibility [4–7]. Many validated studies reported that LA ɛ showed sensitive changes in LV diastolic dysfunc- tion preceding LA volume enlargement [4–6]. LA remod- eling due to atrial fibrillation causes changes in LV compli- ance [8] and LA ɛ [2]. In addition, its capacity to screen LA thrombus has been recently reported [7].
Currently, normal reference values for the three com- ponents of LA function have been demonstrated in adults [9–12]. However, this method has not yet been validated in children, and the volume of data are inadequate to determine the normal range of the LA ɛ and strain rate (SR). Moreover, whether LA function assessed by 2DSTE can be applied to children as well as adults because its interpretation depends on age, body surface area (BSA) or heart rate is unclear [13].
Thus, this study aimed (1) to report the normal reference values for LA ɛ and SR in healthy school children and (2) to investigate methods of interpreting LA functions according to maturational changes using 2DSTE.
Materials and methods Subjects
This was a cross-sectional single-center trial conducted from May 2016 to December 2017. We recruited 153 patients (age range 6–16 years) who were screened for heart murmur, non- specific chest pain, and palpitation. They were investigated if
their medical history and physical examination results indi- cated that they were free of cardiac disease. We excluded 13 patients (8.4%) who were found to have heart disease (n = 7) or abnormal ECGs (n = 6) after cardiac screenings. The data of the remaining 140 patients with normal echocardio- graphic findings were included. Demographic and echocar- diographic parameters were collected. Blood pressure was measured in the supine position at the beginning of the echo- cardiography. BSA was calculated using the DuBois formula [14]. The research protocol was approved by our institutional ethics committee, and the requirement for informed consent was waived on the condition that the project opt-out was disclosed on the internet (RK-171212-07).
Echocardiography
Studies were performed using Artida (CANON Medical Sys- tems, Tochigi, Japan) at high frame rates (mean 93.5 ± 21 frames/s) using a 2.5–5 MHz transducer. All 2D data sets were able to be obtained without sedation. Left ventricular (LV) ejection fraction (LVEF) was calculated in the apical four-chamber view using the biplane modified Simpson’s method and the diameter of the LV outflow tract (LVOT) was measured in the parasternal long-axis view in mid-sys- tole. In the apical four-chamber view, peak E (early diastolic filling) and A (late diastolic filling) wave velocities were recorded from the LV inflow waveforms obtained during pulsed-Doppler echocardiography. Tissue Doppler imaging was used to measure the lateral mitral annular velocity (E′).
Fig. 1 Schematic representa- tion of LA functions during the cardiac cycle. a ECG. b Transmitral Doppler flow veloc- ity profiles. c LA strain curve.
d LA strain rate curve. ɛCD
conduit strain, ɛCT contractile
strain, ɛRS reservoir strain, SR
strain rate, SR
ENearly negative
strain rate, SR
LNlate negative
strain rate, SR
POSpositive strain
rate
The mitral annular plane systolic excursion (MAPSE) was extracted from the lateral mitral annulus by M mode echo- cardiography in the same view. Pulsed-Doppler interrogation of time-velocity integrals (VTI) in the LVOT was manipu- lated while maintaining the beam axis at an angle that was as close as possible to parallel with the LVOT flow in the apical five-chamber view. Stroke volume (SV) was estimated using the following formula [15]:
LA volumes were measured using the biplane-area-length method. Maximum LA volume (LAV max) and minimum LA volume (LAV min) were calculated in the apical four- and two-chamber views at ventricular end-systole and end- diastole, respectively [16]. These values were corrected according to each patient’s BSA [left atrial volume index (LAVI max) and minimum left atrial volume index (LAVI min)].
All Doppler measurements were averaged over three con- secutive cardiac cycles to account for respiratory variation in accordance with the ASE guidelines [17].
Echocardiographic imaging and 2DSTE analysis Two-dimensional image clips of five consecutive cardiac cycles (as raw data) obtained from the apical four-chamber view were acquired in the Digital Imaging and Communica- tions in Medicine format for further analysis. The following precautions were taken to acquire good LA images: (1) to ensure inclusion of the LA wall, the image was obtained in the left lateral recumbent position; (2) to optimize endocar- dial definition, the gain was set at a slightly higher level;
(3) to maintain an identical frame rate and heart rate (HR), the depth and sector size were controlled, thus reducing the amount of information that needed to be processed. As for those children who were able to hold their breath, images were acquired during the end-expiratory phase with hold- ing breath. LA ɛ and SR were analyzed offline using 2D software (2D Cardiac Performance Analysis, TomTec Imag- ing system, Munich, Germany). The LA was visualized as shown in Fig. 2a. Three points (septal and lateral corners of the mitral annulus and LA roof) were plotted manually using a point-and-click technique followed by automatic tracing of the endocardial LA borders. The epicardial line was the region of interest which was divided into three regions as follows: lateral wall, medial wall, and roof. The atrial appendage and pulmonary veins were excluded from the LA cavity. The image quality was visually checked using animation. We excluded the subjects if we could not track all segments, and we modified the method to retrace any seg- ments not tracked in any part of the endocardial LA wall to obtain good images. The global longitudinal LA ɛ curve was SV = Cross-sectional area of the LVOT ( cm
2)
× LVOT VTI ( cm )
displayed, which was set to start at the beginning of the QRS wave by default. The most suitable cardiac cycle was chosen for analysis and was set to change the reference point of the trigger as the P wave (Fig. 2b). Based on the LA volume curve which was derived simultaneously, the marker of end- systole (eS) was moved to the maximum LA cavity and the marker of end-diastole (eD) was shifted to the beginning of the P wave on the ECG. Because the P trigger was adopted as the calculation for LA ɛ, asymmetric sinusoidal curves with two peaks were recorded. The first negative peak and the second positive peak were measured as the contractile ɛ (ɛ CT: atrial contraction) and conduit ɛ (ɛ CD: LV fill- ing), respectively. The reservoir ɛ (ɛ RS) was calculated as the sum of these two strains. Each of the three segments and an average of these SR curves were measured at the same time (Fig. 2c). SR in late diastole (SR
LN), ventricular systole (SR
POS), and early diastole (SR
EN) were measured along the average SR curve as the parameters of contractile, reservoir, and conduit function, respectively. Three consecu- tive cardiac cycles were analyzed in each data set, and the mean of these measurements was used for further analysis to minimize random error.
Intraobserver and interobserver variability
The intraobserver agreements, interobserver agreements, and test–retest variability were assessed using intraclass correlation coefficients (ICC) in 20 randomly selected sub- jects. The parameters of LA volume, LA ɛ, and SR were re-measured by the same observer over 1 month after the initial evaluation and a second observer performed the same measurements on separate occasions without knowledge of the results of the first observer. To determine test–retest vari- ability, 2D data sets acquired by the same methodology were reanalyzed 1 h after the initial study.
Statistical analysis
All continuous data are presented as means ± standard deviations (SD) or as median with interquartile ranges if it shows skewed distribution. The categorical variables are expressed in percentages. The Kolmogorov–Smirnov test was used to check the normal distribution of the variables.
Normally distributed continuous data were compared with the unpaired Student’s t test and the continuous data with skewed distribution were assessed by Mann–Whitney U test for statistical significance. To compare the LA strains and the pulsed-Doppler echocardiographic indices or LA vol- umes, Pearson’s correlation coefficient was used for data with normal distributions and Spearman’s correlation coef- ficient was used for data with skewed distributions.
Comparisons of clinical characteristics and echocardio-
graphic parameters, along with LA ɛ and SR among the
three age groups, were analyzed using a one-way analy- sis of variance (ANOVA) for normally distributed data or Kruskal–Wallis test for data with skewed distribution. In this study, the lambda-mu-sigma (LMS) method was used for the description of pediatric anthropometric data, allow- ing the calculation of percentiles and accurately normal- ized Z-scores and accounting for nonlinearity and a skewed distribution of reference data sets [18]. The LMS method describes the distribution of the measurement Y by its median (M), the coefficient of variation (S), and a measure of skewness (L) required to transform the data to normality, and the Z-score is calculated as follows:
Z-score = {[ Y ∕ M ( t )] L ( t ) − 1 }∕[ L ( t ) × S ( t )] .
In this equation, Y is the individual LA strain measure- ment, and L, M, and S originate from the specific reference values for age, BSA, and HR (t), respectively. We describe the Z-score curves for each LA strain with lines indicating the − 2.5, − 2.0, − 1.0, 0, 1.0, 2.0, and 2.5 SD boundaries (corresponding to the 0.6, 2.3, 15.9, 50.0, 84.1, 97.7, and 99.4 percentiles, respectively). Detailed methods for devel- oping the LMS models were previously reported [19]. The model with the lowest Akaike information criterion value was selected as the best model. Data analyses and calcu- lations were performed using commercially available soft- ware, EZR (Saitama Medical Center, Jichi Medical Uni- versity, Saitama, Japan) [20] and R version 3.4.0 (The R Foundation for Statistical Computing Vienna, Austria). A p value < 0.05 was considered statistically significant.
Fig. 2 LA functional analysis using the 2D speckle tracking method obtained from an apical four-chamber view. a Two-dimensional images obtained from the apical four-chamber view were acquired for analysis. Three points (septal and lateral corners of the mitral annu- lus and LA roof) were plotted manually using a point-and-click tech- nique followed by automatic tracing of the endocardial LA borders.
The epicardial line was created as the region of interest which was divided into the following regions: lateral wall, medial wall, and roof.
(b, Top) the LA global strain (yellow line) curve. (b, Bottom) the LA volume curve (red line). To match the phase of the cardiac cycle, the end systole line was fixed to the maximum LA volume along the LA volume curve. The end diastole line was set to the beginning of the P wave as P trigger. The blue line shows the derived LA volume with respect to time. c The strain rate (SR) for each segment was obtained.
The longitudinal average strain rate is shown on the white line
Results
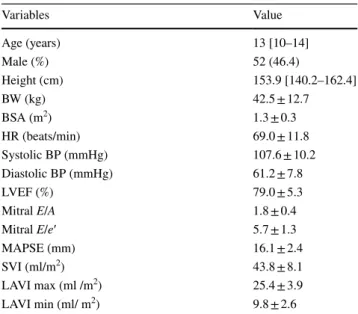
LA ɛ and SR measurements were obtained from 140 patients; however, measurements of 28 patients were elimi- nated due to poor echocardiographic image quality. The final study population included 112 patients (median 12.0 years, range 6–16 years). Their demographic and echocardio- graphic data are shown in Tables 1, 2 and 3. There were no sex-specific differences in age, BSA, HR, LA ɛ, or LA SR.
Table 4 summarizes the correlations between each strain parameters and pulsed-Doppler indices or LA volumes.
Among the pulsed-Doppler index results, the E/A ratio showed that a modest negative correlation with SR
LN. E/e′
was negatively correlated with ɛ RS and ɛ CD. No signifi- cant association was observed between E/e′ and the three SR. MAPSE was positively correlated with ɛ RS, ɛ CD, and SRpos respectively (p < 0.01, r = 0.36, 0.36, 0.32, respec- tively). SR
ENwas modestly correlated with the stroke vol- ume index (SVI) and LAVI max or LAVI min (p = 0.02, r = − 0.21, − 0.22, − 0.22, respectively). SR
LNwas modestly correlated with the LAVI min (p < 0.01, r = − 0.24).
The Z-score curves are shown in Fig. 3. With increasing age and BSA, the three ɛ showed slightly falling lines or flat lines. The three SR also showed a negative correlation with these parameters, and these slopes were steeper than those of
Table 1 Clinical and echocardiographic characteristics of the study populations (n = 112)
Data are expressed as mean ± SD, median [interquartile range] or n (%)
BSA body surface area, BP blood pressure, HR heart rate, LAVI max maximum left atrial volume indexed to BSA, LAVI min minimum left atrial volume indexed to BSA, LVEF Left ventricular ejection frac- tion, MAPSE mitral annular plane systolic excursion, SVI stroke vol- ume indexed to BSA
Variables Value
Age (years) 13 [10–14]
Male (%) 52 (46.4)
Height (cm) 153.9 [140.2–162.4]
BW (kg) 42.5 ± 12.7
BSA (m
2) 1.3 ± 0.3
HR (beats/min) 69.0 ± 11.8
Systolic BP (mmHg) 107.6 ± 10.2
Diastolic BP (mmHg) 61.2 ± 7.8
LVEF (%) 79.0 ± 5.3
Mitral E/A 1.8 ± 0.4
Mitral E/e′ 5.7 ± 1.3
MAPSE (mm) 16.1 ± 2.4
SVI (ml/m
2) 43.8 ± 8.1
LAVI max (ml /m
2) 25.4 ± 3.9
LAVI min (ml/ m
2) 9.8 ± 2.6
Table 2 Clinical characteristics and reference value of echocardiographic parameters by age groups
BSA body surface area, BP blood pressure, F female, HR heart rate, LAVI max maximum left atrial volume indexed to BSA, LAVI min minimum left atrial volume indexed to BSA, LVEF left ventricular ejection fraction, M male, MAPSE mitral annular plane systolic excursion, SVI stroke volume indexed to BSA
*Statistically difference among groups. Data are expressed as mean ± SD or median [interquartile range]
Variables Age P value
6–9 years (n = 25: M13/F12) 10–12 years (n = 28: M14/F14) 13–16 years (n = 59: M25/F34)
Age (years) 8 [7, 8] 12 [11, 12] 14 [13, 14] < 0.01*
Height (cm) 126.1 [121.0–134.6] 151.0 [145.2–154.3] 161.0 [156.1–166.6] < 0.01*
BW (kg) 26.1 ± 6.0 40.5 ± 8.4 50.3 ± 9.0 < 0.01*
BSA (m
2) 0.96 ± 0.1 1.3 ± 0.2 1.51 ± 0.1 < 0.01*
HR (beats/min) 77.4 ± 10.7 72.5 ± 12.4 63.7 ± 9.0 < 0.01*
Systolic BP (mmHg) 101.7 ± 9.3 107.2 ± 10.1 110.4 ± 9.6 < 0.01*
Diastolic BP (mmHg) 57.8 ± 7.1 62.3 ± 7.4 62.2 ± 7.9 0.04*
LVEF (%) 79.3 ± 5.3 78.2 ± 5.8 79.2 ± 5.1 0.67
Mitral E/A 1.7 ± 0.4 1.7 ± 0.4 1.9 ± 0.4 0.25
Mitral E/e′ 5.9 ± 1.7 5.6 ± 1.3 5.8 ± 1.1 0.61
SVI (ml/ m
2) 40.4 ± 6.8 44.4 ± 8.4 44.9 ± 8.2 0.06
MAPSE (mm) 14.8 ± 2.5 16.4 ± 2.4 16.5 ± 2.2 < 0.01*
LAVI max (ml/m
2) 22.5 ± 4.6 25.9 ± 3.5 26.4 ± 3.2 < 0.01*
LAVI min Total (ml/ m
2) 8.5 ± 2.1 10.4 ± 3.0 10.1 ± 2.5 0.02*
ɛ. In the part of higher HR, SR
ENand SR
LNwere more likely to have higher values. The ɛ CT showed the same tendency.
However, ɛ RS, ɛ CD, and SR
POSwere less affected by the change in HR.
The reproducibility of LA volume, LA strains, and SR is shown in Table 5. All parameters showed good favorable agreement; however, the LAV min had the lowest interob- server variability.
Discussion
In this study, we demonstrated the normal reference values for LA ɛ and SR in healthy school children using vendor- independent 2DSTE software (TomTec), which was devel- oped for the LA analysis in this study. To the best of our knowledge, no previously published data exist on the normal reference values of the three components of LA ɛ and SR using Z-score models in this age range.
Previous studies
To date, there have been three published reports about the normal range of LA ɛ and SR in children [1, 13, 21].
According to these works, ɛ RS was affected by age; one study reported that LA ɛ increased with age [21] and the other showed controversial results [1]. This might have been caused by differences in the modality or LA analysis soft- ware, which is still an issue when interpreting LA ɛ and SR.
In this study, we could show that ɛRS did not increase with age and that it decreased slightly in this cohort using 2D vendor-independent software. Moreover, there seemed to be a drastic change of LA ɛ and SR at the younger age group especially in children below 5 years old [13]. Even if HR variability was reported to affect LA ɛ and SR, it is unknown whether this trend could be explained only by the matura- tional change. For these reasons, we excluded the younger age group (younger than 5 years) including neonates from this study because of the difficulty in obtaining good images for analysis and because fluctuation may occur even without sedation.
Table 3 Reference value of LA ɛ and SR parameters by age groups
ɛ CD conduit strain, ɛ CT contractile strain, ɛ RS reservoir strain, F female, M male, SR
ENearly negative strain rate, SR
LNlate negative strain rate, SR
POSpositive strain rate
*
Statistically significance among groups. Data are expressed as mean ± SD or median [interquartile range]
Variables Age P value
6–9 years (n = 25: M13/F12) 10–12 years (n = 28: M14/F14) 13–16 years (n = 59: M25/F34)
ɛ RS (%) 34.5 ± 7.8 34.5 ± 8.6 31.3 ± 7.5 0.10
ɛ CD (%) 26.0 ± 7.6 26.0 ± 9.0 23.7 ± 7.1 0.31
ɛ CT (%) − 8.6 ± 2.9 − 8.5 ± 2.8 − 7.6 ± 2.6 0.19
SR
POS(S
−1) 1.3 ± 0.3 1.2 ± 0.3 1.1 ± 0.3 0.03*
SR
EN(S
−1) − 1.7 ± 0.5 − 1.3 ± 0.4 − 1.2 ± 0.3 < 0.01*
SR
LN(S
−1) − 0.7 [− 0.8 to − 0.6] − 0.5 [− 0.6 to − 0.4] − 0.5 [− 0.6 to − 0.4] < 0.01*
Table 4 Correlations of LA strains (ɛ) and strain rate (SR) with Doppler echocardiographic indices and LA volumes
Pearson’s correlation coefficient or spearman’s rank correlation coefficient *Statistically different ɛ CD, ɛ CT, and SR
LNare expressed as absolute values
LAVI max maximum left atrial volume indexed to BSA, LAVI min minimum left atrial volume indexed to BSA, MAPSE mitral annular plane sys- tolic excursion, SVI stroke volume indexed to BSA
LA ɛ: r (p) SR: r (p)
ε RS ɛ CD ɛ CT SR
POSSR
ENSR
LNE/A 0.08 (0.43) 0.07 (0.42) 0 (0.98) 0.13 (0.19) 0.03 (0.76) − 0.2 (0.04) *
E/e′ − 0.21 (0.03)* − 0.20 (0.03)* − 0.02 (0.82) 0.02 (0.82) − 0.01 (0.9) − 0.13 (0.19)
SVI − 0.06 (0.55) − 0.06 (0.56) 0 (0.94) − 0.17 (0.07) − 0.21 (0.02) * − 0.14 (0.15)
MAPSE 0.36 (< 0.01)* 0.36 (< 0.01)* 0.01 (0.94) 0.32 (< 0.01)* − 0.09 (0.36) − 0.07 (0.48)
LAVI max − 0.03 (0.72) − 0.07 (0.50) 0.08 (0.38) 0 (0.98) − 0.22 (0.02) * − 0.04 (0.66)
LAVI min − 0.13 (0.16) − 0.1 (0.28) − 0.1 (0.3) − 0.18 (0.06) − 0.22 (0.02)* − 0.24 (< 0.01) *
Fig. 3 Z-score curves of the LA ɛ and SR using the LMS models based on age, BSA, and HR. BSA body surface area, HR heart rate, LA left atrium, LMS lambda-mu-sigma. Z-score curves for each LA
strain and SR with lines indicate the − 2.5, − 2.0, − 1.0, 0, 1.0, 2.0,
and 2.5 standard deviation (SD) boundaries, respectively
There were several matters of concern about the LA ɛ and SR measurements, and LA ɛ was reported as a useful param- eter when evaluating cardiac dysfunction in children with atrial septal defect [22], valve aortic stenosis [23], Kawasaki disease [24], and diseases that cause LA enlargement [25].
Even in complex heart structures, strains have been reported as a sensitive marker of single ventricle function after the Fontan procedure during follow-up [26, 27]. Additionally, the possibility of their clinical applicability for monitoring the health of obese children [28] and athletes [29] has been reported. Our study showed that SR had a better tempo- ral resolution than ɛ. Furthermore, ɛ has been reported that to respond to loading conditions to some extent [30, 31];
however, it would be useful to evaluate the deformation of the myocardium in the age group in which HR could be kept constant. On the contrary, our study might suggest that SR would be a suitable parameter for the assessment of the younger age group which would show a higher HR with great maturational changes. To apply the LA mechanics of children in clinical use, continuous assessments of LA ɛ and LA SR are crucial. The three SR segments were not vali- dated in this study; however, their values may enable a better understanding of the adaptation of LA function [32]. Future studies are needed to evaluate these parameters in detail.
There are many reports on the measurement of the phasic LA volume curve using the 2DSTE method [33–37]. Nota- bly, it enabled the volume-based assessment of LA func- tion, which correlated with the conventional Doppler param- eters, ɛ, and SR in the same phases of the cardiac cycle.
A good correlation was found between the data obtained by 2DSTE and manual trace [33, 36]; however, LA volume derived from 2DSTE has been reported to be greater than that derived from the biplane area-length method because of the extra inclusion of entry sites of pulmonary veins as a part of the left atrium [37]. Therefore, LA volume was assessed by the biplane area-length method in our study, according to the ASE guidelines [16].
Parameters affected by LA ɛ and SR
The LA ɛ and SR cannot be discussed without considera- tion of the maturational changes of the LA myocardium. A matter of concern is what factor is most affected by LA ɛ or SR. All ɛ and SR in this population showed less influence on age. As for BSA, the Z-score curves of three LA ɛ showed weak downward slopes with leveling off. These trends were similar to those of age, while SR
ENand SR
LNwere decreased with increasing BSA, and this finding may suggest that SR would have a tendency to be influenced by HR. In this study, we were able to evaluate the effects of HR on LA ɛ and SR in the groups which were expected to have relatively small fluctuations with age and BSA. SR
POSand all LA ɛ, except ɛ CT were less influenced by HR. In contrast, SR
ENand SR
LNsignificantly increased with increased HR. The reason why ɛ CT, SR
EN, and SR
LNwere influenced by HR was that these parameters reflected mainly in diastole and tachycardia would shorten the cardiac cycles more in diastole than in systole. Careful interpretation of SR values considering HR is needed in further study. Although healthy school children were recruited for our study, we should consider afterload and preload, which are affected by volume status in addi- tion to maturational changes when evaluated in children with heart disease. According to a previous study that reported the cut-off value for discriminating healthy children from those with juvenile cardiomyopathies, ɛRS ≥ 40.4% (sensi- tivity, 98%; specificity, 99%) and SR
pos≥ 1.39 s
−1(sensitiv- ity, 88%; specificity, 90%) were optimal [38]. Maturational factors were not considered throughout that study; however, both values were between Z + 0 and Z + 1.0 in our study.
Further studies are needed to determine the cutoff on this Z score curve.
Table 5 Intraclass correlation coefficients of the LA volume, LA strain (ɛ), and LA strain rate (SR)
CL confidence limits, ɛ CD conduit strain, ɛ CT contractile strain, ɛ RS reservoir strain, ICC intraclass cor- relation coefficients, LAV max maximum left atrial volume, LAV min minimum left atrial volume, SR
ENearly negative strain rate, SR
LNlate negative strain rate, SR
POSpositive strain rate
Variable Intraobserver Interobserver Test–retest
ICC 95% CL ICC 95% CL ICC 95% CL
LAV max 0.969 0.926–0.988 0.900 0.765–0.959 0.952 0.856–0.985
LAV min 0.889 0.746–0.954 0.711 0.406–0.874 0.741 0.361–0.912
ɛ RS 0.921 0.771–0.975 0.869 0.626–0.958 0.937 0.814–0.98
ɛ CD 0.882 0.671–0.962 0.834 0.538–0.946 0.898 0.709–0.967
ɛ CT 0.849 0.589–0.951 0.797 0.454–0.934 0.84 0.571–0.948
SR
POS0.917 0.759–0.974 0.832 0.55–0.945 0.870 0.625–0.956
SR
EN0.899 0.713–0.968 0.791 0.456–0.931 0.879 0.661–0.961
SR
LN0.848 0.588–0.951 0.809 0.483–0.938 0.804 0.49–0.935
Application of LA analysis
A consensus is lacking regarding if a practical algorithm for grading diastolic function in adults could be applied to children with congenital and acquired heart disease [39].
Some validated reports, which organized the pulsed-Doppler and tissue Doppler velocities in children are useful [39–41];
however, these have limitations regarding angle and volume dependence. Moreover, the correlation between LVEDP and these parameters are reportedly weak [42] and its ten- dency is more remarkable in LV systolic dysfunction [43], because they are easily affected by LV motion. Therefore, many researchers have been seeking the optimal parameters to improve the diagnostic accuracy of the diastolic dysfunc- tion in children [25, 44]. 2DSTE could be one of the diag- nostic tools for assessing LA phasic function although many potential confounders like age, BSA, or HR are unavoidable with pediatric echocardiography. We hope that this method would facilitate the assessment of diastolic function in the pediatric field, which may lead to favorable management of heart disease in the future by combining it with conventional pulse-Doppler parameters.
Two issues should be discussed for the application of LA analysis in children. First, the zero-reference point in the LA analysis can be determined in two ways. In our study, we selected the P wave as a reference point because the ɛ CT was derived more clearly with the P trigger compared to the R trigger. Some authors have indicated that the P trigger is more suitable than the R trigger when analyzing the LA strain because the R wave peak represents the electrical sig- nal associated with LV contraction, which is not the same as the point at which minimum LA volume should be measured [45]. This gap might affect children more because of their relatively higher HR. Second, there is still no consensus as to whether 2D or 3D should be chosen for the LA analysis.
The analyses using 3DSTE obtain full volumes of images precisely, rapidly, and with good reproducibility compared to 2DSTE [2]. Moreover, its characteristics make it possi- ble to evaluate not only the longitudinal strain but also the circumferential strain [1, 2]. On the contrary, the strength of 2DSTE is its high temporal resolution, which could allow for the analysis of rapid events, such as the isovolumic phases and diastole when evaluating children with tachycardia [10].
Practically, the 2D analysis does not require short periods of breath-holding to obtain adequate images, which is some- times a challenge for children when taking 3D images.
Modelling of child growth data
In our study, we chose the LMS method to derive the Z-score curve of LA ɛ and SR in children. This method has become standard for the modeling of child growth data [46] and has been adopted by the Centers for Disease Control and
Prevention (CDC) for assessing growth. Until now, growth charts were established based on the cross-sectional data;
however, the LMS method can be transformed to normal- ize the actual resource using Box–Cox power, and it avoids bias by regression to the mean. We searched for and finally selected the minimum Akaike information criterion for each model to avoid overfitting models in this study. Generally, the statistical power relies on the sample size, and the LMS method is not an exception to this rule. Recently, the Gauss- ian process regression (GPR) method has been reported to detect Z-scores with good accuracy compared to the LMS method in children [47]. In future studies, GPR with a suffi- cient population larger than the one used for this study needs to be investigated to determine a better prediction model.
Study limitations
We acknowledge the limitations of our study. First, there was a relatively small number of participants, and only those of certain ages were involved in the study. This might have influenced the correlations between age, BSA, and HR and LA ɛ or SR. We intended to recruit sufficient sam- ple sizes for each age range based on the study design to derive the Z-score curve; however, many images had to be omitted from the study because of low image quality and insufficient information regarding the echocardiographic Doppler parameters. This was a retrospective single-center study; therefore, sampling bias might have been introduced.
Moreover, we recognized that we should establish the nor-
mal value of the younger age group in a future study, as this
was not determined in this study. Second, there were actu-
ally a few subjects of the younger age group whose image
acquisition could not be performed during the end-expira-
tory phase. Both LA ɛ and SR can be affected by respiration
with increased LA volume during inspiration, secondary
to negative intrathoracic pressure. As respiration influ-
ences preload for the left atrium, average data were used for
analysis; however, the variation related to respiratory cycles
was inevitable. Third, the 2DSTE method generally requires
appropriate machine settings to obtain the desirable qual-
ity of the 2D images based on frame rate, grayscale, depth
of field, the region of interest, and timing of initial onset
(P wave or QRS wave). Although difficulties with machine
settings cause limitations in normal reference value compari-
sons, the analysis of LA functions using 2DSTE is expected
to promote a better understanding of LA mechanics. This
is the first study to use vendor-independent 2D software to
determine the normal range of strain and SR in the LA of
young children. Therefore, we expect that the results could
help echocardiography experts working in various centers
to validate their data.
Conclusion
We provided normal reference values for the three compo- nents for LA ɛ and SR in children using a Z-score model derived by the LMS method. The measurements of LA ɛ and SR using the 2DSTE method were easy to perform with good reproducibility. There were small maturational changes in LA ɛ that were probably clinically irrelevant. However, the LA SR should be evaluated together with changes in LA ɛ for precise evaluation of LA dysfunction, in consideration of maturational changes including age, BSA, and HR. Future studies will need to collect data from a greater number of healthy children and adolescents for clinical use.
Acknowledgements We thank Masashi Mikami, MS, for his statistical support with the Z-score models.
Compliance with ethical standards
Conflict of interest The authors declare that they have no conflict of interest.
References
1. Ghelani SJ, Brown DW, Kuebler JD, Perrin D, Shakti D, Wil- liams DN, Marx GR, Colan SD, Geva T, Harrild DM (2017) Left atrial volumes and strain in healthy children measured by three- dimensional echocardiography: normal values and maturational changes. J Am Soc Echocardiogr 31:187–193
2. Mochizuki A, Yuda S, Oi Y, Kawamukai M, Nishida J, Kouzu H, Muranaka A, Kokubu N, Shimoshige S, Hashimoto A, Tsuchi- hashi K, Watanabe N, Miura T (2013) Assessment of left atrial deformation and synchrony by three-dimensional speckle-track- ing echocardiography: comparative studies in healthy subjects and patients with atrial fibrillation. J Am Soc Echocardiogr 26:165–174
3. To AC, Flamm SD, Marwick TH, Klein AL (2011) Clinical utility of multimodality la imaging: assessment of size, function, and structure. JACC Cardiovasc Imaging 4:788–798
4. Brecht A, Oertelt-Prigione S, Seeland U, Rücke M, Hättasch R, Wagelöhner T, Regitz-Zagrosek V, Baumann G, Knebel F, Stangl V (2016) Left atrial function in preclinical diastolic dysfunction:
two-dimensional speckle-tracking echocardiography-derived results from the BEFRI trial. J Am Soc Echocardiogr 29:750–758 5. Singh A, Addetia K, Maffessanti F, Mor-Avi V, Lang RM (2017)
LA Strain For Categorization of LV diastolic dysfunction. JACC Cardiovasc Imaging 10:735–743
6. Xu TY, Sun JP, Lee AP, Yang XS, Ji L, Zhang Z, Li Y, Yu CM, Wang JG (2015) Left atrial function as assessed by speckle- tracking echocardiography in hypertension. Medicine (Baltimore) 94(6):e526
7. Zhu MR, Wang M, Ma XX, Zheng DY, Zhang YL (2018) The value of left atrial strain and strain rate in predicting left atrial appendage stasis in patients with nonvalvular atrial fibrillation.
Cardiol J 25:87–96
8. Uetake S, Maruyama M, Mitsuishi T, Takahashi K, Miyauchi Y, Seino Y, Shimizu W (2019) Diastolic wall strain predicts progres- sion from paroxysmal to persistent or permanent atrial fibrillation in structurally normal hearts. J Cardiol 74:339–346
9. Pathan F, D’Elia N, Nolan MT, Marwick TH, Negishi K (2017) Normal ranges of left atrial strain by speckle-tracking echocar- diography: a systematic review and meta-analysis. J Am Soc Echocardiogr 30:59–70.e8
10. Mor-Avi V, Lang RM, Badano LP, Belohlavek M, Cardim NM, Derumeaux G, Galderisi M, Marwick T, Nagueh SF, Sengupta PP, Sicari R, Smiseth OA, Smulevitz B, Takeuchi M, Thomas JD, Vannan M, Voigt JU, Zamorano JL (2011) Current and evolving echocardiographic techniques for the quantitative evaluation of cardiac mechanics: ASE/EAE consensus statement on methodol- ogy and indications endorsed by the Japanese society of echocar- diography. Eur J Echocardiogr 12:167–205
11. Miglioranza MH, Badano LP, Mihăilă S, Peluso D, Cucchini U, Soriani N, Iliceto S, Muraru D (2016) Physiologic determinants of left atrial longitudinal strain: a two-dimensional speckle-tracking and three-dimensional echocardiographic study in healthy volun- teers. J Am Soc Echocardiogr 29:1023–1034.e3
12. Sugimoto T, Robinet S, Dulgheru R, Bernard A, Ilardi F, Contu L, Addetia K, Caballero L, Kacharava G, Athanassopoulos GD, Barone D, Baroni M, Cardim N, Hagendorff A, Hristova K, Lopez T, De La Morena G, Popescu BA, Penicka M, Ozyigit T, Rodrigo Carbonero JD, Van De Veire N, Von Bardeleben RS, Vinereanu D, Zamorano JL, Go YY, Marchetta S, Nchimi A, Rosca M, Calin A, Moonen M, Cimino S, Magne J, Cosyns B, Galli E, Donal E, Habib G, Esposito R, Galderisi M, Badano LP, Lang RM, Lancel- lotti P (2018) Echocardiographic reference ranges for normal left atrial function parameters: results from the EACVI NORRE study.
Eur Heart J Cardiovasc Imaging 19:630–638
13. Kutty S, Padiyath A, Li L, Peng Q, Rangamani S, Schuster A, Danford DA (2013) Functional maturation of left and right atrial systolic and diastolic performance in infants, children, and ado- lescents. J Am Soc Echocardiogr 26:398–409.e2
14. Du Bois D, Du Bois EF (1916) Clinical calorimetry: tenth paper a formula to estimate the approximate surface area if height and weight be known. Arch Intern Med XVII:863–871
15. Porter TR, Shillcutt SK, Adams MS, Desjardins G, Glas KE, Olson JJ, Troughton RW (2015) Guidelines for the use of echo- cardiography as a monitor for therapeutic intervention in adults:
a report from the American society of echocardiography. J Am Soc Echocardiogr 28:40–56
16. Lang RM, Badano LP, Mor-Avi V, Afilalo J, Armstrong A, Ernande L, Flachskampf FA, Foster E, Goldstein SA, Kuznetsova T, Lancellotti P, Muraru D, Picard MH, Rietzschel ER, Rudski L, Spencer KT, Tsang W, Voigt JU (2015) Recommendations for cardiac chamber quantification by echocardiography in adults:
an update from the American society of echocardiography and the European association of cardiovascular imaging. J Am Soc Echocardiogr 28:1–39.e14
17. Lopez L, Colan SD, Frommelt PC, Ensing GJ, Kendall K, You- noszai AK, Lai WW, Geva T (2010) Recommendations for quantification methods during the performance of a pediatric echocardiogram: a report from the Pediatric Measurements Writ- ing Group of the American Society of Echocardiography Pediatric and Congenital Heart Disease Council. J Am Soc Echocardiogr 23:465–495
18. Cole TJ, Green PJ (1992) Smoothing reference centile curves: The LMS method and penalized likelihood. Stat Med 11:1305–1319 19. Kobayashi T, Fuse S, Sakamoto N, Mikami M, Ogawa S, Hama-
oka K, Arakaki Y, Nakamura T, Nagasawa H, Kato T, Jibiki T,
Iwashima S, Yamakawa M, Ohkubo T, Shimoyama S, Aso K,
Sato S, Saji T, Z Score Project Investigators (2016) A new Z score
curve of the coronary arterial internal diameter using the lambda-
mu-sigma method in a pediatric population. J Am Soc Echocardi-
ogr 29:794–801.e29
20. Kanda Y (2013) Investigation of the freely available easy-to-use software “EZR” for medical statistics. Bone Marrow Transpl 48:452–458
21. Cantinotti M, Scalese M, Giordano R, Franchi E, Assanta N, Molinaro S, Iervasi G, Santoro G, Koestenberger M, Kutty S (2019) Left and right atrial strain in healthy caucasian children by two-dimensional speckle-tracking echocardiography. J Am Soc Echocardiogr 32:165–168.e3
22. Di Salvo G, Drago M, Pacileo G, Rea A, Carrozza M, Santoro G, Bigazzi MC, Caso P, Russo MG, Carminati M, Calabro R (2005) Atrial function after surgical and percutaneous closure of atrial septal defect: A strain rate imaging study. J Am Soc Echocardiogr 18:930–933
23. Shakti D, Friedman KG, Harrild DM, Gauvreau K, Geva T, Colan SD, Brown DW (2018) Left atrial size and function in patients with congenital aortic valve stenosis. Am J Cardiol 122:1541–1545
24. Kang SJ, Ha J, Hwang SJ, Kim HJ (2018) Long term outcomes of left atrial reservoir function in children with a history of Kawasaki disease. J Cardiovasc Ultrasound 26:26–32
25. Hope KD, Wang Y, Banerjee MM, Montero AE, Pandian NG, Banerjee A (2019) Left atrial mechanics in children: insights from new applications of strain imaging. Int J Cardiovasc Imag- ing 35:57–65
26. Khoo NS, Smallhorn JF, Kaneko S, Kutty S, Altamirano L, Tham EB (2013) The assessment of atrial function in single ventricle hearts from birth to Fontan: a speckle-tracking study by using strain and strain rate. J Am Soc Echocardiogr 26:756–764 27. Ishizaki U, Nagao M, Shiina Y, Inai K, Mori H, Takahashi T,
Sakai S (2019) Global strain and dyssynchrony of the single ven- tricle predict adverse cardiac events after the Fontan procedure:
analysis using feature-tracking cine magnetic resonance imaging.
J Cardiol 73:163–170
28. Zhang C, Deng Y, Liu Y, Xu Y, Liu Y, Zhang L, Chen X, Xie M, Ge S (2018) Preclinical cardiovascular changes in children with obesity: a real-time 3-dimensional speckle tracking imaging study.
PLoS ONE 13(10):e0205177
29. D’Ascenzi F, Anselmi F, Focardi M, Mondillo S (2018) Atrial enlargement in the athlete’s heart: assessment of atrial function may help distinguish adaptive from pathologic remodeling. J Am Soc Echocardiogr 31:148–157
30. Genovese D, Singh A, Volpato V, Kruse E, Weinert L, Yamat M, Mor-Avi V, Addetia K, Lang RM (2018) Load dependency of left atrial strain in normal subjects. J Am Soc Echocardiogr 31:1221–1228
31. Burns AT, La Gerche A, D’hooge J, Macisaac AI, Prior DL (2010) Left ventricular strain and strain rate: characterization of the effect of load in human subjects. Eur J Echocardiogr 11:283–289 32. Vianna-Pinton R, Moreno CA, Baxter CM, Lee KS, Tsang TS,
Appleton CP (2009) Two-dimensional speckle-tracking echocardi- ography of the left atrium: feasibility and regional contraction and relaxation differences in normal subjects. J Am Soc Echocardiogr 22:299–305
33. Okamatsu K, Takeuchi M, Nakai H, Nishikage T, Salgo IS, Hus- son S, Otsuji Y, Lang RM (2009) Effects of aging on left atrial function assessed by two-dimensional speckle tracking echocar- diography. J Am Soc Echocardiogr 22:70–75
34. Sakata M, Hayabuchi Y, Inoue M, Onishi T, Kagami S (2013) Left atrial volume change throughout the cardiac cycle in children with congenital heart disease associated with increased pulmonary blood flow: evaluation using a novel left atrium-tracking method.
Pediatr Cardiol 34:105–111
35. Rimbaş RC, Mihăilă S, Vinereanu D (2016) Sources of variation in assessing left atrial functions by 2D speckle-tracking echocar- diography. Heart Vessels 31:370–381
36. Tanaka S, Noda T, Kawasaki M, Segawa T, Tsugita N, Fuseya T, Kubota T, Iwama M, Nishigaki K, Watanabe S, Minagawa T, Ohashi H, Minatoguchi S (2019) Relationship between electrical conduction and phasic left atrial function: P-wave signal-averaged electrocardiography and time-left atrial volume curve assessments using two-dimensional speckle-tracking echocardiography. Heart Vessels 34:1212–1220
37. de Waal K, Phad N, Boyle A (2018) Left atrium function and deformation in very preterm infants with and without volume load. Echocardiography 35:1818–1826
38. Sabatino J, Di SG, Prota C, Bucciarelli V, Josen M, Paredes J, Borrelli N, Sirico D, Prasad S, Indolfi C, Fraisse A, Daubeney PEF (2019) Left atrial strain to identify diastolic dysfunction in children with cardiomyopathies. J Clin Med 8(8):E1243 39. Cantinotti M, Lopez L (2013) Nomograms for blood flow and tis-
sue Doppler velocities to evaluate diastolic function in children: a critical review. J Am Soc Echocardiogr 26:126–141
40. Cantinotti M, Giordano R, Scalese M, Murzi B, Assanta N, Spa- doni I, Crocetti M, Marotta M, Molinaro S, Kutty S, Iervasi G (2016) Nomograms for mitral inflow Doppler and tissue Doppler velocities in Caucasian children. J Cardiol 68:288–299
41. Dallaire F, Slorach C, Hui W, Sarkola T, Friedberg MK, Bradley TJ, Jaeggi E, Dragulescu A, Har RLH, Cherney DZI, Mertens L (2015) Reference values for pulse wave doppler and tissue doppler imaging in pediatric echocardiography. Circ Cardiovasc Imaging 8:1–9
42. Masutani S, Saiki H, Kurishima C, Kuwata S, Tamura M, Senzaki H (2014) Assessment of ventricular relaxation and stiffness using early diastolic mitral annular and inflow velocities in pediatric patients with heart disease. Heart Vessels 29:825–833
43. Cameli M, Sparla S, Losito M, Righini FM, Menci D, Lisi M, D’Ascenzi F, Focardi M, Favilli R, Pierli C, Fineschi M, Mondillo S (2016) Correlation of left atrial strain and Doppler measure- ments with invasive measurement of left ventricular end-diastolic pressure in patients stratified for different values of ejection frac- tion. Echocardiography 33:398–405
44. Takahashi K, Nii M, Takigiku K, Toyono M, Iwashima S, Inoue N, Tanaka N, Matsui K, Shigemitsu S, Yamada M, Kobayashi M, Yazaki K, Itatani K, Shimizu T (2019) Development of suction force during early diastole from the left atrium to the left ventricle in infants, children, and adolescents. Heart Vessels 34:296–306 45. Hayashi S, Yamada H, Bando M, Saijo Y, Nishio S, Hirata Y,
Klein AL, Sata M (2015) Optimal analysis of left atrial strain by speckle tracking echocardiography: P-wave versus R-wave trigger.
Echocardiography 32:1241–1249
46. Ryan L (2019) Four papers on child growth modelling. Stat Med 38:3505–3506
47. Martinez-Millana A, Hulst JM, Boon M, Witters P, Fernandez- Llatas C, Asseiceira I, Calvo-Lerma J, Basagoiti I, Traver V, De Boeck K, Ribes-Koninckx C (2018) Optimisation of children z-score calculation based on new statistical techniques. PLoS ONE 13(12):e0208362
Publisher’s Note Springer Nature remains neutral with regard to
jurisdictional claims in published maps and institutional affiliations.
1
Normal reference values for left atrial strains and strain rates in school children assessed using two-dimensional speckle-tracking echocardiography
2D
スペックルトラッキング法による正常小児の左房機能評価背景 左房機能には左室収縮期に肺静脈から血流を受ける
Reservoir
機能、左室拡張早期に左 房から左室へ血液が移動するConduit
機能、左室拡張末期に心房収縮により左房内血液を押し 出すContractile
機能の3
つが存在する(図1)。近年では3Dスペックルトラッキングや CT
またはMRI
を用いた左房解析が報告されている。しかし2D
スペックルトラッキング(2DSTE)法によるストレイン(ɛ)およびストレインレート(SR)の解析は、より簡便かつ時
間分解能に優れており、各相毎の左房機能評価が可能で、成人の領域では左室機能障害を鋭敏 に反映する早期指標として有用であると報告され、基準値もすでに確立している。しかし小児 領域においては左房 ɛ およびSR
を用いた左房機能解析に関する報告は少ないうえに、成熟段 階に伴う心拍数の変化、体格の変化が及ぼす各値への影響に関する検討が十分でない。このた め本研究では、2DSTE法を用い、正常小児における左房 ɛ(Reservoirストレイン:ɛRS,Conduit
ストレイン:ɛCD, Contractileストレイン:ɛCT)およびSR (positive SR :SR
POS, early negative SR :SR
EN, late negative SR :SR
LN)の計測値からzスコアカーブを求め、成長による変化
が各値に及ぼす影響を調べる目的で検討した。方法 本研究は
2016
年5
月から2017
年12
月の間、心雑音や胸痛および動悸などの循環器症 状を主訴に来院した患者153
名に対し、心スクリーニングを行い、器質的心疾患を認めた13
名を除外した140
名(年齢6
歳から16
歳まで)を対象とした。対象者に対し、Artida (CANONMedical Systems,Tochigi, Japan)を使用し、左室収縮能、従来のパルスドプラー法を用い左室拡
張能の指標(E/A, E/e’)および左室流出路面積より一回拍出量を計測した。また、Biplanearea length method
法により左房容積を求めた。さらに、左室機能との相関を調べる目的でM mode
法を用いて僧帽弁輪収縮期移動距離(mitral annular plane systolic excursion: MAPSE)を併せて計測した。その後、図2に示すように、汎用画像診断装置ワークステーション用プロ グラム(2D Cardiac Performance Analysis, TomTec Imaging system)を用い、左房ストレイン
(ɛ)およびストレインレート(SR)を計測した。計測した各指標は
lambda-mu-sigma (LMS)
法を用いて年齢、体表面積、心拍数それぞれを横軸にz
スコア化した。体表面積はDuBois
法 で求めた。結果 左房解析の結果、画質不良ゆえ
28
名が解析困難であったため112
名のデータを最終的 に用い検討した。対象者の特徴およびエコーデータを表1~3に示す。各計測値に性差は認め2
す。E/Aは
SR
LNと弱い負の相関を示した。E/e’は ɛRSと ɛCDに負の相関を示したがいずれのSR
にも相関を示さなかった。MAPSEは ɛRS, ɛCD, SRPOSにそれぞれ正の相関を認めた(P<0.01, r=0.36, 0.36, 0.32)。作成した
z score
カーブを図3に示す。年齢と体表面積に関し ては、ɛ およびSR
ともにほぼ横ばいあるいは軽度の下降スロープを描き、下降の程度は ɛ よ りもSR
で顕著であった。一方、心拍数に関しては ɛCTをのぞく ɛ およびSR
POSはほどんど影 響をうけず、ほぼ横ばいであったが、ɛCT ,SRENおよびSR
LNは、高心拍数になるにつれカーブ の上昇の傾向を認めた。検査者間および検査者内の再現性について表5に示す。いずれの指標 も良好な再現性を認めた。考察
本研究では、健常学童における左房 ɛ および
SR
のz score
カーブを作成した。2DSTEの汎用 画像診断装置ワークステーション用プログラムを用い、この年齢層における各指標について、年齢、体表面積および心拍数をもとにzスコアカーブを作成したのは本論文が最初である。ま た、過去の報告に西洋人と日本人の ɛ および
SR
との比較がないため、本研究は日本人の小児 のみを対象として左房 ɛ およびSR
を検討した初めての報告となる。過去の報告との比較
これまで、小児の領域における左房解析は、心房中隔欠損症[22]、大動脈弁狭窄症[23]ほか、
左房拡大をきたす疾患の心機能障害を評価する指標として有用との報告[25]がされている。心 房中隔欠損症では、Amplatzer septal occluderによるカテーテル治療と外科的閉鎖術の二つが あるが、術後遠隔期の比較では明らかに外科的閉鎖術のほうが、ɛRSおよび
SRpos
ともに低下 しているとの報告がある。これは、術後切開線をめぐる心房筋の線維化という心房性不整脈発 生の原因を反映していると考えられる。そして、低侵襲というだけでなく、心房機能の意味に おいても、適応のある心房中隔欠損症にはカテーテル治療を推奨する根拠となりうる。単に遺 残短絡の有無という術後評価にとどまらずに心房機能を評価することが、小児から成人へ移行 する際の長期管理の上で重要になってくるであろう。また、大動脈弁狭窄症においては、左室 拡張末期圧上昇を反映し、ɛCTが顕著に上昇していると報告されている。先天性の場合、重症 なほど出生後すぐにバルーン拡張術を施行するが、術後再狭窄に伴う左室機能評価の際に、左 室拡張末期圧が推測できるとすれば、大変有用と考えられる。実際、e’/E を ɛRSで除した式で 求めるnoninvasive LA stiffness(%
-1)という値は、左室拡張末期圧と良好な相関を示したとのデ
ータがある。左房拡大をきたしうる左右シャントを有する疾患や心筋症の患者において従来の ドップラー指標と組み合わせて活用することは、より精度の高い拡張能障害診断の一助となる であろう。また、小児の心筋症における左房機能を活用した報告では、ɛRS≧40.4%(感度98%、特異度 99%)、SRpos≧1.39s
-1(感度 88%、特異度 90%)で肥大型心筋症、拡張型心筋症
や拘束型心筋症といった心筋症から鑑別するカットオフ値としている。これは本研究のz
スコ アでいうとz0またはz+1に相当する。今後実際の症例を計測しながらz
スコアを当てはめて3
の報告[29]もある。アスリートは、突然死の予防からも心スクリーニングが欠かせないが、ト レーニングによる酸素消費量の増大に伴い、循環血液量が増加し、心エコーでは左房拡大をみ ることが多い。この場合、拡張能障害に起因する左房拡大との鑑別において左房ストレインが 有用であると報告されている。また、成人を対象にした
MRI
による検討ではあるが、肥満およ び2
型糖尿病を合併した群では、コントロール群との比較において左房拡大や左室機能の有意 差はないものの有意に左房ストレインの低下を認めた。さらに、MRIで計測した心外膜脂肪量 およびBMI
に対し左房ストレインと負の相関を認めたと報告されている[#1]。収縮能が保たれ た心不全を合併しやすい肥満の心スクリーニングにおいても左房機能は今後さらに注目される 可能性がある。また、今回対象とした小児の年齢の範囲においては、成人の基準値(ɛRS39%、ɛCD23%、ɛCT17%)と比較した場合[9]、z
スコア上収縮期の指標である ɛRS およびɛCDはほぼz=0の位置にあるが、拡張期後期の指標である ɛCTに関しては、z=+1.0か ら+2.0の位置であり、加齢による左室の
stiffness
の増大が拡張期後期の指標に影響したか、あるいは成人との心拍数の相違が一因と考えられる。逆に、収縮期および拡張早期の左房スト レインに関しては本研究の対象年齢ですでに成人と変わらない程度に成熟し安定していると考 えてよいかもしれない。
本研究の結果解釈
パルスドップラー指標と本研究で得られた左房ストレイン値を比較すると、E/Aおよび
E/e’に
関しては、全値との相関は本研究では得られなかった。これまでの研究で、ある程度の相関が 示されているデータがある以上断定はできないが、本研究結果の全体的なばらつきの要因の一 つにはパルスドップラー指標のもつ、角度依存性や容量依存性の問題が考えられる。また、A 波および e’の指標は顕著に心拍数と相関を示すことがわかっており[39]、成人の検討でも心拍 数が10
回/分上昇するごとにE/A
は0.5~0.9
上昇するとの報告[#2]もある。本研究では鎮静 をしていない、心拍数が一定と仮定できない小児が対象ゆえ、心拍数のゆらぎが影響した可能 性がある。唯一関連のあったSR
LNは高心拍数によるA
波への影響と相関したのかもしれな い。またE/e’に関しては ɛCD
およびSR
ENとの相関を期待したが、SRENとの相関はなかった。心筋の収縮(または拡張)力を反映する
SR
よりも、ɛ は各心周期における左房の変化率をみて いるため、従来のドップラー指標に近似するは ɛ の方なのかもしれない。収縮期に焦点をあて れば、MAPSEは ɛRSおよびSRpos
と相関がみられた。体表面積で補正した左房容量と1
回拍 出量においてSR
ENが弱いながらも負の相関を示したことは、拡張早期に左室に流入する血液が 体格的に少ないほうが、拡張早期の左房筋の収縮は速いという事実を示している。容量負荷の かかる心疾患の評価では、鋭敏に反応する指標として有用かもしれない。ここで過去の研究と本研究の結果を踏まえ、左房 ɛ と
SR
のデータをどのように小児に適用す るか提案してみたい。左房ではなく左室機能を対象とした研究ではあるが、小児の心拍数との関連を調べた研究で は、心拍数は各心周期における左室 ɛ と相関し、左室
SR
に関しては拡張後期の左室SR
のみ影4
では、今回の研究では、SRは ɛ に比べて良好な時間分解能ゆえ、とくに拡張期の指標で大いに 心拍数の影響をうけた。心拍数と、収縮期・拡張早期・拡張後期それぞれの時間の相関を示し た過去の報告によると[#3]、心拍数が
100
回/分を超えるまでは拡張早期時間は指数関数的に 減少し、他は心拍数の増加に比例して時間の減少を認めている。このことは100
回/分を超え る高心拍領域では、心拍数100
回/分より低い場合に比べ、拡張期における後期(心房収縮 期)の占める割合が、高いことを示唆している。よって、本研究で対象にした小児の年齢にお いては心拍数では ɛCTの増加はなだらかな上昇にとどまったが、基本的には拡張期の指標は ɛ もSR
も影響をうけると考えてデータを解釈すべきであろう。心拍数は、小児から成人への成 長過程における一回心拍出量の増加に伴い減少するため、年齢や体格と元来密接な関係があ る。よって年齢や体表面積の解釈には心拍数の影響が避けられない。ɛ とSR
のどちらが評価に 有用であるかの結論は本研究の範囲では収まらない今後の検討課題である。心拍数100
回/分 を超える領域の拡張早期および後期の指標に関しては、年齢や体表面積よりもまず心拍数をも とにしたグラフから求めたz
スコアから判定していくとよいだろう。とくに、SRは時間分解能 がよいため、今回の対象からは除外した5
歳以下の高心拍数下ではより期待できる指標となり うるが、この点に関しても今後の検討課題である。小児の左房機能解析における今後の応用について
拡張能評価には左室流入血流速度波形(拡張早期最大流速
E
波、心房収縮期最大流速A
波)、僧帽弁輪組織パルスドップラー法(僧帽弁輪収縮期運動速度
e’、僧帽弁輪拡張早期運動速度
a’、僧帽弁輪心房収縮期運動速度s‘)、肺静脈血流波形、Tei
インデックスがあり、小児の心エコーでもこれらを成人同様に駆使して評価している。しかし、小児の左室拡張能障害の評価に 関しては、成人のアルゴリズムを小児にそのまま適応してよいのかという議論がある。現状で は、スペックルトラッキング法を用いる心機能解析に関しては、左房よりも先にデータが蓄積 されている左室に関してすら小児科領域では臨床に普及しているとは言えない。また、これま では左室解析用のソフトを代用していたが、近年本研究で使用した左房解析のためのソフトが 開発され、基準値の集積が始まったばかりである。本研究で得られた ɛ および
SR
の値は、従 来の拡張能指標と十分な相関を示さなかった。しかし、従来の指標が左室拡張末期圧を反映せ ず[42]、左室収縮能に影響を受ける[43]指標だとすれば、今回のスペックルトラッキング法を 用いた左房機能解析は年齢、体表面積、心拍数といった因子の考慮が必要ながらも、従来の指 標に加えることにより、より精度の高い左室拡張能評価を実現する可能性がある。そのために は、これまでの研究で行われているように、観血的あるいは非観血的な手法で左房圧近似のデ ータを求め、あるいは臨床症状との相関を示していくことが重要と考える。実際の小児への応 用に関しては2つ議論すべき点がある。1点目は計測のタイミングに関して、Pトリガー法と Rトリガー法がある。今回はPトリガー法を用いたが、心拍数の早い小児にはPトリガー法の ほうが、ɛCTが明瞭に描出できるため推奨される。2点目はスペックルトラッキング心エコー 法による計測に関して、2Dと3Dがある。近年では3Dを用いた研究により2Dに比べて良5
計測できる利点もある。しかし、息止めの困難な小児では3D計測が困難なケースも存在する ほか、2Dは3Dにくらべ優れた時間分解能ゆえ、高心拍数の小児では依然として有用と考え られる。
本研究の限界
本研究の限界について述べる。まず
1
点目は、zスコア表の作成において対象者数が少ないこ とはサンプリングバイアスを引き起こす危険がある。しかし、当研究は後方視研究であり、デ ータの不ぞろい、描出画像の精度などの影響で、サンプル数が少なくなってしまった。また、本研究の対象外とした
6
歳未満の小児においても十分な症例数を用いた同様の検討が今後必要 であろう。2点目に、小児を対象としたため、呼気終末での画像取得が困難な症例が含まれて いたことである。左房機能は呼吸に影響するため、これを克服するため3
心拍の平均を値とし て用いるようにした。3点目にコントロール群の抽出方法であるが、心スクリーニングの時点 で正常心であった対象者を抽出したが、完全には代謝性疾患の素因を有するものを除外できた とは断言できない。4点目には、左房機能解析のための画像取得にある一定の技術を要するこ とである。画像の精度はRegion of interest
やFrame rate
の設定や、グレースケールの設定、被検者の体位などが大きく影響する。鎮静が得られない年齢における小児では、こうした準備 が時に困難であることは否めない。しかし3Dに比べ、2Dでは左房に焦点を当てた四腔像の 記録だけであとはオフラインで解析できるため、日ごろのスクリーニングに特別な画像を加え る必要がないという点で、今後小児における心機能評価として普及する可能性を十分に秘めて いると考えられる。最後に、一般的には心エコー検査装置の世界市場では
Philips, GE,
CANON
の3
社でスペックルトラッキング解析が行われているが、この3
社では得られるストレイン値にばらつきがあることが指摘されており[#4]、本研究では汎用画像診断装置ワークス テーション用プログラムを用いて解析を行った。しかし実際にはこの
2Dsoftware (2D Cardiac Performance Analysis, TomTec Imaging system, Munich, Germany)をもっている小児科は非常
に少ないのが現状であり、主流3
社の値と本ソフトウェアで得られた解析値との相関を検討す ることは、本研究で得られたz
スコア値を臨床応用するための重要な今後の課題であろう。結語 ɛ は本研究の対象年齢においてはほぼ横ばいであったが、拡張期を示す指標に関して は、とくに