ORIGINAL ARTICLE
EFFECT OF INITIAL BLOOD GLUCOSE LEVEL ON TRANSIENT PHYSICAL STRESS
Mitsuhiro Tanaka
1,2),Takashi Umeda
1),Ippei Takahashi
1),Ritsuko Kasai
1,3), Motoko Matsuda
1,4),Kaori Iwane
1),Noriyuki Okubo
1),Naoko Wada
1,5),
Kensuke Iwabuchi
1)and Shigeyuki Nakaji
1)Abstract We evaluated the effect of blood glucose level before transient physical exercise on an athlete’s physical condition and neutrophil functions. The changes and associations between blood glucose level immediately before training and neutrophil function at rest were investigated in female long-distance runners. Seventeen females in a university track team were divided into 2 groups by medial blood glucose levels: 9 subjects were in the high blood glucose group (HBG group) and 8 subjects in the low blood glucose group (LBG group). Myogenic enzymes, immunoglobulines, complements and neutrophil function such as reactive oxygen species (ROS) production capability were measured. The post-practice rate of change in ALT and C3 levels were significantly higher in the LBG group compared to the HBG group. At pre-practice, total ROS production capability was significantly lower in the HBG group compared to LBG group. Total ROS production capability increased significantly post-practice (“normal pattern”) in the HBG group, though it tended to decrease (“abnormal pattern”) in the LBG group. In conclusion, an adequate blood glucose level in athletes prior to exercise is suggested to be effective not only to supply energy to the body, but also to maintain normal immune function which is potentially suppressed during exercise.
Hirosaki Med.J. 64:71―83,2013
Key words: Glucose; exercise; neutrophil function; long-distance runner.
原 著
運動実施前の血糖値レベルが運動実施による一過性の 身体ストレスに及ぼす影響
田 中 充 洋
1,2)梅 田 孝
1)高 橋 一 平
1)笠 井 里津子
1,3)松 田 基 子
1,4)岩 根 かほり
1)大久保 礼 由
1)和 田 尚 子
1,5)岩 渕 健 輔
1)中 路 重 之
1)抄録 大学女子長距離選手17名を対象に,練習開始直前の血糖値が安静時・運動負荷時の好中球機能に及ぼす影響を検 討した.練習開始前の血糖値の中央値で低血糖群 8 名と高血糖群 9 名の 2 群に分けた.対象者に 2 時間15分のトレー ニングを実施させ,その前後に,白血球数,好中球数,肝機能項目(Alanine aminotransferase, ALTなど),好中球活性 酸素種(reactive oxygen species: ROS)産生能及び貪食能を測定した.その結果,ALT は低血糖群のみで有意に上昇し,
その練習前後の変化率は高血糖群に比べ低血糖群で有意に大きかった,また,練習前(安静時)の ROS 産生量が,高血糖 群で低血糖群より有意に少なく,練習前後の変化率は有意に大きかった.以上より,低血糖群に比較し,高血糖群では 酸化ストレスの影響が小さいく,かつ,運動負荷に対し好中球機能が正常に機能した可能性が示唆された.
弘前医学 64:71―83,2013
キーワード:糖質;運動;好中球機能;長距離ランナー.
1)Department of Social Medicine, Hirosaki University Graduate School of Medicine
2)School of Business Administration, Meiji University
3)Nippon Sport Science University
4)Osaka University of Health and Sports Sciences
5)Department of Plastic and Reconstructive Surgery, Hirosaki University Graduate School of Medicine Correspondence: S. Nakaji
Received for publication, December 26, 2012 Accepted for publication, January 4, 2013
1)弘前大学大学院医学研究科社会医学講座
2)明治大学経営学部
3)日本体育大学
4)大阪体育大学
5)弘前大学大学院医学研究科形成外科学講座
別刷請求先:中路重之 平成24年12月26日受付 平成25年 1 月 4 日受理
Introduction
Many long-distance runners practice running over long distances on a daily basis, trying to beat their personal best time, and previous studies have pointed out the potential danger of the high physical and mental burdens on athletes causing chronic sports disorders. Long-distance runners in particular are at high risk of the overuse syndrome such as fatigue fractures of the shinbones and splint bones, shin splints and inflammation in the iliotibial band as well as the overtraining syndrome including sports anemia
1, 2). For many athletes including long-distance runners, the availability of glucose in the bloodstream is known to be the most important nutrient in the body as a main energy source.
When an athlete carries out highly intensive exercise that requires anaerobic energy, glucose metabolism is accelerated in active muscles which in turn increases the demand for more glucose. Unfortunately, the amount of sugar which can be stored in the body is limited and thus it is considered important for athletes to build up their glucose levels as much as possible before performing anaerobic/aerobic exercise
3, 4)
. Moreover, some researchers reported that sufficient storage of sugar in the body can prevent and reduce the occurrence of over- reaching and/or over-training
5, 6).
In other previous studies, immunosuppression was observed in athletes who carried out highly- intensive, highly-frequent as well as extended periods of physical exercise. Also, they were reported to be at high risk of infections including upper respiratory tract infection
7, 8). Our research group also investigated the effect of highly- intensive transient exercise on immune functions such as neutrophil function of athletes including long-distance runners, and have found that exercise can cause immunosuppression and oxidative stress in athletes
9-15). We have also suggested that monitoring neutrophil functions
over short or long period of time can be useful as a conditioning index and an effective method to manage athletes’ health
16, 17).
Previous studies, which investigated the relationship between blood glucose and immune function in athletes, showed that glucose depletes after extended periods of exercise the production of IL-6 is increased, IL-6 being an inflammatory cytokine
18, 19). Also, other researchers have reported that glucose supplementation during extended training can suppress IL-6 and IL- 10 synthesis, which are activated by physical exercise, while inhibiting increased of neutrophil counts and decreased T-cell function
2 0 -2 4). However, in spite of the associations between blood glucose and immune function reported previously, detailed mechanisms as well as their relationship still remain unclear. Furthermore, no other researchers have reported on the relationship between blood glucose and neutrophil function, which is known to be the first line of defense in the immune system.
The present study therefore investigated the changes in and associations between blood glucose levels immediately before a training session and neutrophil function at rest in female long-distance runners based on changes in their blood biochemical parameters, reactive oxygen species (ROS) production capability and phagocytic activity (PA). In other words, the present study investigated the effect of blood glucose availability before transient physical exercise and its effects on changes in neutrophil functions during transient exercise.
Subjects and Methods
1. Subjects and research period
The study subjects were 17 female long- distance runners in a university track team.
They were divided into 2 groups based on their
median blood glucose level immediately before
the training: 9 subjects were assigned to the
high blood glucose group (HBG group) and 8 to the low blood glucose group (LBG group).
The average blood glucose levels before the practice in the LBG and HBG groups were 84.8
± 4.8mg/dl and 95.8 ± 3.5 mg/dl, respectively
(Table 1).
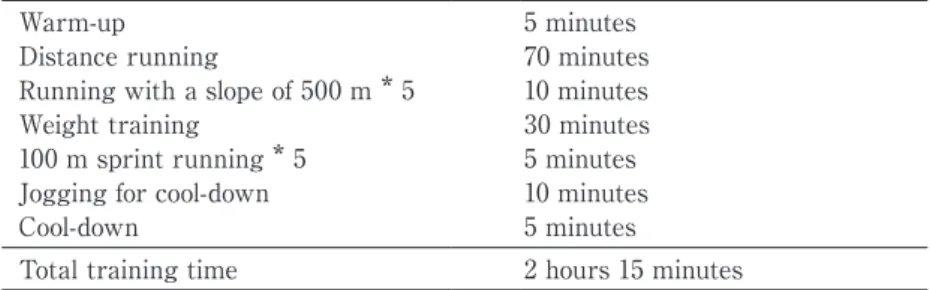
The physical characteristics of the study subjects were shown in Table 1. The investigation was conducted on in March of 2009. All subjects trained for their normal 2 hours and 15 minutes and a number of parameters were measured.
The training menu was shown in the Table 2. Although the rehydration regimen was not investigated in detail the present study, they were asked to drink plenty of water before the training.
The study was approved by the Ethics Committee of Hirosaki University School of Medicine. The study protocol and purpose were thoroughly explained to, and written consent
was obtained from, all subjects prior to the investigation.
2. Body compositions
After subjects’ heights were measured, their body weight, body fat percentage and fat-free mass were measured by the impedance method using a multi-frequency body composition meter
(MC-190, TANITA, Tokyo, Japan).
3. Blood biochemical parameters
Blood samples (15 ml) were taken when subjects were at rest before practice (pre- practice) and immediately after practice (post- practice). Five milliliters of the sample was used to analyze the blood cell components, and the remaining 10 ml was centrifuged at 3,000 rpm for 10 minutes to extract blood serum for further analysis.
Table 1 Physical characteristics and the changes in body weight after the training session in the low and high blood glucose groups
Low blood glucose
group (n=8) High blood glucose group (n=9)
Age (Years) 19.6 ± 0.9 19.8 ± 0.8
Height (cm) 160.7 ± 4.8 159.2 ± 5.1
Body weight (kg)
Pre 50.2 ± 3.6 48.8 ± 6.1
Post 49.0 ± 3.5 * 48.1 ± 5.9 **
Relative body fat (%) 18.3 ± 3.7 17.7 ± 4.6
Fat-free mass (kg) 40.9 ± 2.8 40.0 ± 3.7
Pre-value of blood glucose 84.8 ± 4.8 95.1 ± 3.5 ††
Values are shown as the mean ± standard deviation.
Pre: pre-training. Post: post-training.
*: p<0.05, **: p<0.01, significant difference from the pre-value
††: p<0.01, significant difference from the value in the low blood glucose group
Table 2 Contents of the training program performed by subjects
Warm-up 5 minutes
Distance running 70 minutes
Running with a slope of 500 m * 5 10 minutes
Weight training 30 minutes
100 m sprint running * 5 5 minutes
Jogging for cool-down 10 minutes
Cool-down 5 minutes
Total training time 2 hours 15 minutes
For investigation of immune-related functions, leukocyte, neutrophil and lymphocyte counts were determined. Myogenic enzymes including aspartate aminotransferase (AST), alanine aminotransferase (ALT), lactate dehydrogenase
(LDH) and creatine kinase (CK) as well as immunoglobulins (IgG, IgA and IgM) and complements (C3 and C4) were measured. In order to determine the anti-oxidative function of blood serum, the activities of superoxide dismutase (SOD) and thiobarbituric acid reactive substance (TBARS) were also measured.
All blood cell components were measured using an Automated Blood Cell Analyzer
(System XE-2100 and SE-9000 Kobe, Japan), and levels of AST, ALT, LDH and CK were measured using the JSCC standardized method.
For measurements of immunoglobulins and complements, the turbidimetric immunoassay
(TIA) was used. The SOD activity and TBARS activity were measured with the NBT reduction method.
As dehydration of the subjects was observed based on the weight loss after the race and changes in the levels of hemoglobin and hematocrit, these items were measured using the plasma volume method after correcting for dehydration
25). All measurements of blood biochemical items were consigned to an independent laboratory (Mitsubishi Chemical Medience).
4 . Me a s u r e m e n t m e t h o d o f n e u t r o p h i l RO S production capability and phagocytic capability Leukocyte and neutrophil counts were measured with an automated blood cell analyzer
(Sysmex XE-2100 SE-9000, Kobe, Japan). ROS generation and the PA of peripheral blood neutrophils were determined with a FACScan system (Becton Dickinson, San Jose, CA) using two-color flow cytometry. Hydroethidine (HE;
44.4 µmol/L, Polyscience Inc., Warrington, PA)
was used as an indicator for the ROS production capability, and opsonized zymosan (OZ) particles
labeled with fluorescein isothiocyanate (FITC;
Sigma Chemical Co., St. Louis, MO, USA) were used as an indicator for PA. Zymosan was purchased from Sigma Chemical Co. (St. Louis, MO, USA).
Briefly, 100 µL of heparinized whole blood was mixed with 22 µL of HE (final concentration, f.c. 8 µmol/L) and incubated at 37ºC for 5 min.
After the addition of 25 µL of FITC-labeled OZ (FITC-OZ; f.c. 5 mg/mL), the samples were incubated at 37ºC for 35 min. Neutrophils labeled with only HE served as the control to measure non-stimulated neutrophil function and basal ROS generation. After incubation, Lyse and Fix (IMMUNOTECH, Marseille, France)
was added to lyse the erythrocytes and to fix the samples. The samples were washed twice in phosphate-buffered saline with sodium azide, and the fluorescence intensity (FI) in activated neutrophils was measured with the FACScan system. 30 µL of Trypan blue (0.25 mg/mL, pH 4.5) was added just before the assay to differentiate between attached and ingested FITC-OZ by fluorescence quenching
26, 27).
5. Statistical analysis
All values were presented as means ± standard deviation. Differences in mean values between before and after the practice in each group were tested with the generalized Wilcoxon t-test. Also, the Mann-Whitney U-test was used to analyze the change rates of mean values before and after the practice. All values were considered to be statistically significant at p<0.05.
Results
Table 1 shows the physical characteristics of
subjects and changes in body weight from pre-
practice to post-practice. There was no significant
difference in height, body fat percentage or fat-
free mass between the two groups. Their body
weight decreased significantly at post-practice
in both groups (p<0.05 for the LBG group and p<0.01 for the HBG group).
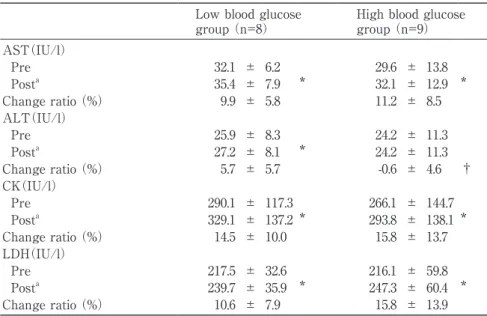
Changes in myogenic enzymes after the practice are shown in Table 3. For both groups, levels of AST, CK and LDH increased significantly post-practice (p<0.05 for all). However, a
significant increase in ALT was only observed in the LBG group (p<0.05). The post-practice rate of change in ALT levels was significantly higher in the LBG group compared to the HBG group
(p<0.05).
Table 4 shows the changes in leukocyte and
Table 3 Changes in serum myogenic enzyme values between the pre- and post- training assessments in the low and high blood glucose groups
Low blood glucose
group (n=8) High blood glucose group (n=9)
AST(IU/l)
Pre 32.1 ± 6.2 29.6 ± 13.8
Posta 35.4 ± 7.9 * 32.1 ± 12.9 *
Change ratio (%) 9.9 ± 5.8 11.2 ± 8.5
ALT(IU/l)
Pre 25.9 ± 8.3 24.2 ± 11.3
Posta 27.2 ± 8.1 * 24.2 ± 11.3
Change ratio (%) 5.7 ± 5.7 -0.6 ± 4.6 †
CK(IU/l)
Pre 290.1 ± 117.3 266.1 ± 144.7
Posta 329.1 ± 137.2 * 293.8 ± 138.1 *
Change ratio (%) 14.5 ± 10.0 15.8 ± 13.7
LDH(IU/l)
Pre 217.5 ± 32.6 216.1 ± 59.8
Posta 239.7 ± 35.9 * 247.3 ± 60.4 *
Change ratio (%) 10.6 ± 7.9 15.8 ± 13.9
Values are shown as the mean ± standard deviation.
Pre: pre-training. Post: post-training.
Change ratio = (pre-value - post-value)/pre-value*100 a: pre-values were adjusted for dehydration by plasma volume.
*: p<0.05, significant difference from pre-value
†: p<0.05, significant difference from the value in the low blood glucose group
Table 4 Changes in the values of blood leukocyte and neutrophil cell counts between the pre- and post-training assessments in the low and high blood glucose groups
Low blood glucose
group (n=8) High blood glucose group (n=9)
Leukocyte counts (/μl)
Pre 5000 ± 1374 5689 ± 1315
Posta 4840 ± 1129 5510 ± 1384
Change ratio (%) -1.7 ± 10.4 -3.1 ± 10.6
Neutrophil counts (/μl)
Pre 2964 ± 1013 3480 ± 997
Posta 3002 ± 842 3646 ± 1189
Change ratio (%) 4.1 ± 17.5 5.1 ± 20.9
Values are shown as the mean ± standard deviation.
Pre: pre-training. Post: post-training.
a: pre-values were adjusted for dehydration by plasma volume.
Change ratio = (pre-value - post-value)/pre-value*100
neutrophil counts after the practice. There were no significant differences in either component between pre- and post-practice in both groups.
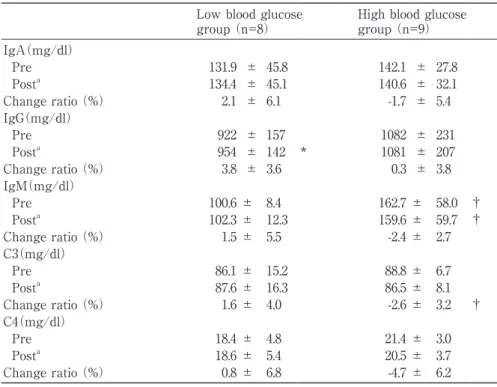
Table 5 shows the difference in changes of immunoglobulins and complements levels between pre- and post-practice in both groups.
The level of IgM in the LBG group at both pre- and post-practice was significantly higher compared with the HBG group (p<0.05 for both). Also, a significant increase in IgG levels was observed post-practice in the LBG group
(p<0.05) but bot in the HBG group. The rate of change in the C3 level was significantly low in the HBG group compared to the LBG group
(p<0.05).
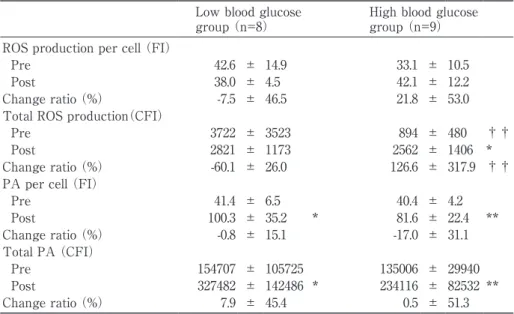
Differences in neutrophil functions between pre- and post-practice are shown in Table 6. At pre-practice, total ROS production capability was
significantly lower in the HBG group compared to LBG group (p<0.01). Total ROS production capability and total PA increased significantly post-practice (“normal pattern”) in the HBG group (p<0.05 for both), though total ROS production capability tended to decrease and total PA increased significantly (p<0.05) post- practice (“abnormal pattern”) in the LBG group.
Table 7 shows the changes in serum SOD activity and TBARS between pre- and post- practice. No significant differences were observed in pre-practice SOD activity or TBARS between the two groups. A significant decrease in SOD activity at post-practice was observed in HBG group (p<0.05), but not in the LBG group.
Table 5 Changes in serum immunoglobulins and complements values between the pre- and post-training assessments in the low and high blood glucose groups
Low blood glucose
group (n=8) High blood glucose group (n=9)
IgA(mg/dl)
Pre 131.9 ± 45.8 142.1 ± 27.8
Posta 134.4 ± 45.1 140.6 ± 32.1
Change ratio (%) 2.1 ± 6.1 -1.7 ± 5.4
IgG(mg/dl)
Pre 922 ± 157 1082 ± 231
Posta 954 ± 142 * 1081 ± 207
Change ratio (%) 3.8 ± 3.6 0.3 ± 3.8
IgM(mg/dl)
Pre 100.6 ± 8.4 162.7 ± 58.0 †
Posta 102.3 ± 12.3 159.6 ± 59.7 †
Change ratio (%) 1.5 ± 5.5 -2.4 ± 2.7
C3(mg/dl)
Pre 86.1 ± 15.2 88.8 ± 6.7
Posta 87.6 ± 16.3 86.5 ± 8.1
Change ratio (%) 1.6 ± 4.0 -2.6 ± 3.2 †
C4(mg/dl)
Pre 18.4 ± 4.8 21.4 ± 3.0
Posta 18.6 ± 5.4 20.5 ± 3.7
Change ratio (%) 0.8 ± 6.8 -4.7 ± 6.2
Values are shown as the mean ± standard deviation.
Pre: pre-training. Post: post-training.
a: pre-values were adjusted for dehydration by plasma volume.
Change ratio = (pre-value - post-value)/pre-value*100
*: p<0.05, significant difference from pre-value
†: p<0.05, significant difference from values in the low blood glucose group
Discussion
A number of researchers have reported that muscle contractions accompanied by intensive
exercise can damage/change muscle tissues and accelerates the permeability of the fascia, causing the release of serum myogenic enzymes into the bloodstream
28, 29). Additionally, levels of
Table 6 Changes in neutrophil function values between the pre- and post-training assessments in the low and high blood glucose groups
Low blood glucose
group (n=8) High blood glucose group (n=9)
ROS production per cell (FI)
Pre 42.6 ± 14.9 33.1 ± 10.5
Post 38.0 ± 4.5 42.1 ± 12.2
Change ratio (%) -7.5 ± 46.5 21.8 ± 53.0
Total ROS production(CFI)
Pre 3722 ± 3523 894 ± 480 ††
Post 2821 ± 1173 2562 ± 1406 *
Change ratio (%) -60.1 ± 26.0 126.6 ± 317.9 ††
PA per cell (FI)
Pre 41.4 ± 6.5 40.4 ± 4.2
Post 100.3 ± 35.2 * 81.6 ± 22.4 **
Change ratio (%) -0.8 ± 15.1 -17.0 ± 31.1
Total PA (CFI)
Pre 154707 ± 105725 135006 ± 29940
Post 327482 ± 142486 * 234116 ± 82532 **
Change ratio (%) 7.9 ± 45.4 0.5 ± 51.3
Values are shown as the mean ± standard deviation.
Pre: pre-training. Post: post-training.
ROS production: reactive oxygen species production in neutrophils.
Change ratio = (pre-value - post-value)/pre-value*100 PA: phagocytic activity in neutrophils.
*: p<0.05, **: p<0.01, significant difference from pre-values
††: p<0.01, significant difference from the value in the low blood glucose group
Table 7 Changes in serum SOD and TBARS values between the pre- and post-training assessments in the low and high blood glucose groups
Low blood glucose
group (n=8) High blood glucose group(n=9)
SOD (%)
Pre 2.9 ± 0.7 3.6 ± 1.5
Posta 2.0 ± 1.0 2.4 ± 1.4 *
Change ratio (%) -1.0 ± 1.3 -1.2 ± 1.4
TBARS(nmol/mL)
Pre 4.4 ± 0.8 4.9 ± 1.1
Posta 4.4 ± 1.0 5.1 ± 1.5
Change ratio (%) 0.7 ± 14.4 6.1 ± 27.1
Values are shown as the mean ± standard deviation.
Pre: pre-training. Post: post-training.
a: pre-values were adjusted for dehydration by plasma volume.
Change ratio = (pre-value - post-value)/pre-value*100 SOD: superoxide dismutase
TBARS: thiobarbituric acid reactive substance
*: p<0.05, significant difference from pre-value
myogenic enzymes including AST, ALT, CK and LDH have been shown to be effective indices for muscle fatigue in athletes, as they reflect the extent of the changes in and damage to muscle tissues and their activities
30).
In the present study, the post-practice levels of AST, CK and LDH increased significantly in both groups, suggesting the extent of the usual training carried out by athletes was considered high enough to cause changes in and damage to muscle tissues. In terms of changes in those levels, the rate of change in ALT was the only one that was observed to be significantly high in the LBG group compared to the HBG group, and none of the other myogenic enzymes changed significantly. Thus, the difference in blood glucose level before the practice was not considered to have much effect on muscle damage or changes, or protein catabolism accompanied by the accelerated energy metabolism during exercise
31,32)
.
Many researchers have reported an increased leukocyte count after transient physical exercise, the extent of which depending on exercise intensity
33). Also, physical exercise is known to cause an increase in leukocytes, such as lymphocytes and neutrophils, and these increases are part of the inflammatory reaction driven by muscle tissue damage. Certain stress hormones such as catecholamine and cortisol are also known to be associated with such reactions
33-35). In addition, other studies showed that physical exercise not only accelerates the inflammatory reaction that is induced secondarily by increases in these hormones, but also directly stimulates the secretion of growth hormones and stress hormones including adrenaline and noradrenaline
35).
The present results indicated no significant differences in the pre-practice leukocyte / neutrophil counts in the rates of change between pre-and post-practice. Thus, blood sugar levels before the training was not considered to have
any effects on leukocyte / neutrophil count in the present study.
Immunoglobulins and complements are important blood components responsible for immunity
33). However, the results of previous studies that have investigated the association between these components and physical exercise have been inconsistent
36-39).
Dufaux and Order reported that levels of C3 and C4 increased after 2.5 hours of running, and muscle damage caused by highly intensive exercise was found to trigger the activation of complements
40). A study by Mashiko and colleagues observed significant muscle damage- mediated decreases in immunoglobulins and complements after a rugby match, as well as an accelerated inflammatory reaction leading to reduced blood circulation
41).
In this study, the level of IgM was significantly higher in the HBG group compared to the LBG group. Although not statistically significant, other immunoglobulin levels also tended to be higher in the HBG group than the LBG group. The reason for such difference may be due to the higher consumption of immunoglobulins against ROS in the LBG group compared to the BG group, which was evident from the greater total ROS production capability in the LBG than in the HBG group.
Neutrophils have an important immune
function including opsonization of both endogenous
and exogenous foreign substances to effectively
sterilize them through phagocytosis
42). Neutrophils
produce ROS to sterilize foreign substances,
however, ROS overproduction can cause damage
to normal cells through oxidative stress
43, 44). Thus,
a significant increase in ROS production capability
per neutrophil seen post-practice in both groups
in the present study was probably due to an
accelerated stress reaction caused by practice,
and/or an inflammatory reaction induced by
morphological changes in and/or damage to
muscles.
Our research group has investigated the roles of neutrophil functions under various conditions including different degrees of exercise intensity
(physical intensity and period of training), different environmental conditions (under conditions of normal training, intensive training, weight-controlling and tournaments or matches)
and under different health conditions (normal conditions or physical fatigue)
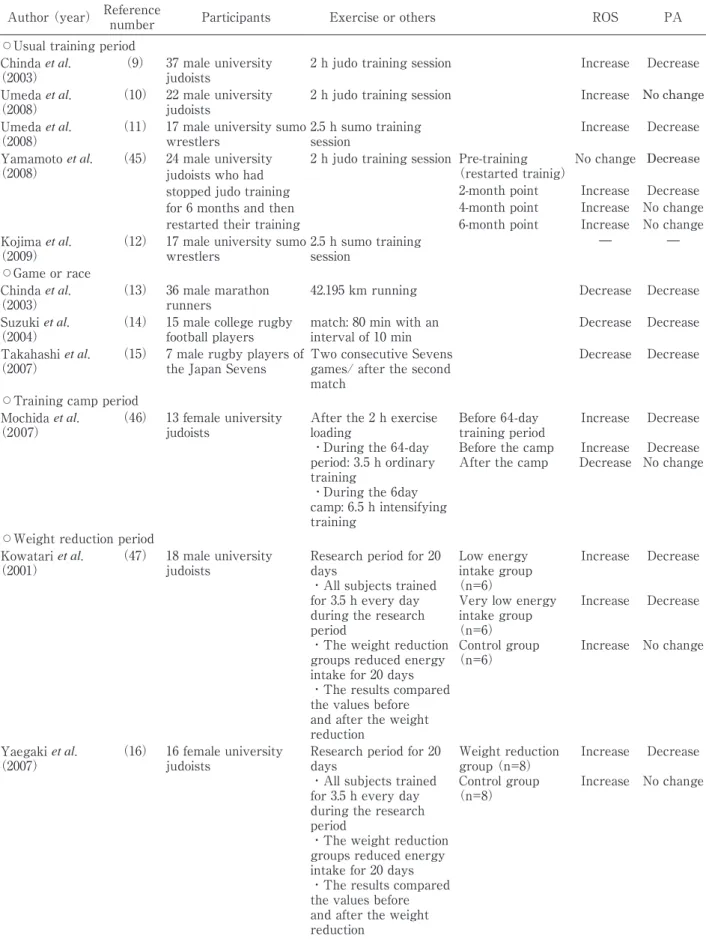
9-17, 45-48). As a result, we have found that neutrophil function exerts its power through a complex mechanism. Although its mechanism may seem unpredictable, it was found to function following a certain rule.
In our past studies, we have observed increased ROS production capability and decreased PA after physical exercise during a normal training period, and this combination was considered as the “normal pattern” of neutrophils
9-12, 17, 45). On the other hand, physical exercise with high intensity or sports performed for an extended period such as marathon races or rugby matches can exceed the capability of the neutrophil function even in well-conditioned athletes, causing decreases in both neutrophil function and PA, and this was referred to as the “abnormal pattern”
of neutrophil functions
13-15). As for these two patterns, the results in our previous studies are shown in Table 8.
From this point of view, the results obtained in this study in the HBG group were considered to follow the “normal pattern” of neutrophil function, where PA or total PA per neutrophil decreased and ROS production capability increased significantly. On the other hand, the LBG group showed a different result from the HBG group, where increased PA and decreased ROS production capability were observed, and thus was considered to follow the “abnormal pattern” of neutrophil function.
Considering the different response of neutrophil function after the same amount of physical exercise, subjects in the HBG group was thought to be better-conditioned compared to LBG group
members. These findings also suggested that the neutrophil function of those who had sufficient and appropriate glucose levels at the beginning of the practice session were able to maintain normal neutrophil functions.
In the present study, ROS production capability per neutrophil in the LBG group was significantly high at rest compared to the HBG group, suggesting that a higher level of ROS was being produced in the LBG group before the day of the study than in the HBG group. In other words, subjects in the LBG group were thought to be much more affected by oxidative stress at rest compared to the HBG group. This result did not coincide with the results in previous studies.
Previous studies investigating the relationship between basal ROS production and blood glucose levels in individuals with diabetes reported that hyperglycemia causes oxidative stress through basal ROS production by neutrophils
49, 50). It was suggested that hyperglycemia enhances NADPH oxidase activity during neutrophil ROS production
51, 52). According to such differences, the subjects in the current study may be considered to have normal blood glucose levels.
SOD is present in blood, and has the
scavenger function of deleting excessive
amounts of ROS
53). Also, transient exercise has
been reported to accelerate ROS production,
leading to increased serum SOD activity as
an anti-oxidative reaction
54, 55). In the present
research, SOD activity was found to be reduced
significantly only in the HBG group. The possible
reason is as follows. Total ROS production
increased after exercise in the HBG group,
and the amount of SOD was reduced as these
subjects were used to lower ROS levels. Also,
the reason why accelerated SOD activity was
observed immediately after exercise in previous
studies and not in this study was considered to
be due to the difference in the physical exercise
intensity, time duration and/or timing of blood
collection etc…
Table 8 Relationships between exercise and neutrophil immune functions from our previous studies
Author (year) Reference number Participants Exercise or others ROS PA
⃝Usual training period Chinda et al.
(2003) (9) 37 male university
judoists 2 h judo training session Increase Decrease
Umeda et al.
(2008) (10) 22 male university
judoists 2 h judo training session Increase No change
Umeda et al.
(2008) (11) 17 male university sumo
wrestlers 2.5 h sumo training
session Increase Decrease
Yamamoto et al.
(2008) (45) 24 male university judoists who had stopped judo training for 6 months and then restarted their training
2 h judo training session Pre-training
(restarted trainig)No change Decrease 2-month point Increase Decrease 4-month point Increase No change 6-month point Increase No change Kojima et al.
(2009) (12) 17 male university sumo
wrestlers 2.5 h sumo training
session ― ―
⃝Game or race Chinda et al.
(2003) (13) 36 male marathon
runners 42.195 km running Decrease Decrease
Suzuki et al.
(2004) (14) 15 male college rugby
football players match: 80 min with an
interval of 10 min Decrease Decrease
Takahashi et al.
(2007) (15) 7 male rugby players of
the Japan Sevens Two consecutive Sevens games/ after the second match
Decrease Decrease
⃝Training camp period Mochida et al.
(2007) (46) 13 female university
judoists After the 2 h exercise loading
・During the 64-day period: 3.5 h ordinary training
・During the 6day camp: 6.5 h intensifying training
Before 64-day training period Before the camp After the camp
Increase Increase Decrease
Decrease Decrease No change
⃝Weight reduction period Kowatari et al.
(2001) (47) 18 male university
judoists Research period for 20 days・All subjects trained for 3.5 h every day during the research period
・The weight reduction groups reduced energy intake for 20 days
・The results compared the values before and after the weight reduction
Low energy intake group
(n=6)
Very low energy intake group
(n=6)
Control group
(n=6)
Increase
Increase
Increase
Decrease
Decrease
No change
Yaegaki et al.
(2007) (16) 16 female university
judoists Research period for 20 days・All subjects trained for 3.5 h every day during the research period
・The weight reduction groups reduced energy intake for 20 days
・The results compared the values before and after the weight reduction
Weight reduction group (n=8)
Control group
(n=8)
Increase Increase
Decrease No change
ROS: reactive oxygen species, PA: phagocytic activity, SOA: serum opsonic activity.
Therefore, having a high blood glucose concentration prior to exercise can maintain the neutrophil function even with the induction of exercise-mediated stress. Also, adequate blood glucose levels in athletes prior to exercise is suggested to be effective not only to supply energy to the body, but also to maintain a normal immune function which is considered to be suppressed during exercise.
Acknowledgement
The authors would like to thank the members of the track team of Nippon Sport University as well as many other researchers for their generous support.
References
1)Van Mechelen W. Running injuries. A review of the epidemiological literature. Sports Med 1992;14:320-35.
2)Morgan WP, Brown DR, Raglin JS, O'Connor PJ, Ellickson KA. Psychological monitoring of overtraining and staleness. Br J Sports Med 1987;21:107-14.
3)Sherman WM. Metabolism of sugars and physical performance. Am J Clin Nutr 1995;62(1 Suppl):
228S-41S.
4)Tsintzas K, Williams C. Human muscle glycogen metabolism during exercise. Effect of carbohydrate supplementation. Sports Med 1998;25:7-23.
5)Sherman WM, Wimer GS. Insufficient dietary carbohydrate during training: does it impair athletic performance? Int J Sport Nutr 1991;1:28-44.
6)Simonsen JC, Sherman WM, Lamb DR, Dernbach AR, Doyle JA, Strauss R. Dietary carbohydrate, muscle glycogen, and power output during rowing training. J Appl Physiol 1991;70:1500-5.
7)Shinkai S, Konish M, Shephard RJ. Aging, exercise, training, and the immune system. Exerc Immunol Rev 1997;3:68-95.
8)Nieman DC. Exercise immunology: future directions for research related to athletes, nutrition, and the elderly. Int J Sports Med 2000;21 Suppl 1:S61-8.
9)Chinda D, Umeda T, Shimoyama T, Kojima A, Tanabe M, Nakaji S, Sugawara K. The acute response of neutrophil function to a bout of judo training. Luminescence 2003;18:278-82.
10)Umeda T, Yamai K, Takahashi I, Kojima A, Yamamoto Y, Tanabe M, Totsuka M, et al. The effects of a two-hour judo training session on the neutrophil immune functions in university judoists. Luminescence 2008;23:49-53.
11)Umeda T, Saito K, Matsuzaka M, Nakaji S, Totsuka M, Okumura T, Tsukamoto T, et al.
Effects of a bout of traditional and original sumo training on neutrophil immune function in amateur university sumo wrestlers. Luminescence 2008;23:115-20.
12)Kojima A, Umeda T, Saito K, Ookubo Y, Sato J, Nakaji S, Matsuzaka M, et al. Effects of 2.5 hour sumo training on serum opsonic activity.
Luminescence 2009;24:224-9.
13)Chinda D, Nakaji S, Umeda T, Shimoyama T, Kurakake S, Okamura N, Kumae T, et al. A competitive marathon race decreases neutrophil functions in athletes. Luminescence 2003;18:324-9.
14)Suzuki M, Umeda T, Nakaji S, Shimoyama T, Mashiko T, Sugawara K. Effect of incorporating low intensity exercise into the recovery period after a rugby match. Br J Sports Med 2004;38:436- 40.
15)Takahashi I, Umeda T, Mashiko T, Chinda D, Oyama T, Sugawara K, Nakaji S. Effects rugby sevens matches on human neutrophil-related non- specific immunity. Br J Sports Med 2007;41:13-8.
16)Yaegaki M, Umeda T, Takahashi I, Matsuzaka M, Sugawara N, Shimaya S, Tanabe M, et al. Change in the capability of reactive oxygen species production by neutrophils following weight reduction in female judoists. Br J Sports Med 2007;41:322-7.
17)Suda Y, Umeda T, Watanebe K, Kuroiwa J, Sasaki E, Tsukamoto T, Takahashi I, et al. Changes in neutrophil functions during a 10-month soccer season and their effects on the physical
condition of professional Japanese soccer players.
Luminescence 2013 Mar;28(2):121-8. doi: 10.1002/
bio.2350.
18)Steensberg A, van Hall G, Osada T, Sacchetti M, Saltin B, Klarlund Pedersen B. Production of interleukin-6 in contracting human skeletal muscles can account for the exercise-induced increase in plasma interleukin-6. J Physiol 2000;
529:237-42.
19)Steensberg A, Febbraio MA, Osada T, Schjerling P, van Hall G, Saltin B, Pedersen BK. Interleukin-6 production in contracting human skeletal muscle is influenced by pre-exercise muscle glycogen content. J Physiol 2001;537(Pt 2):633-9.
20)Chen YJ, Wong SH, Wong CK, Lam CW, Huang YJ, Siu PM. The effect of a pre-exercise carbohydrate meal on immune responses to an endurance performance run. Br J Nutr 2008;
100:1260-8.
21)Green KJ, Croaker SJ, Rowbottom DG. Carbo- hydrate supplementation and exercise-induced changes in T-lymphocyte function. J Appl Physiol 2003;95:1216-23.
22)Henson DA, Nieman DC, Parker JC, Rainwater MK, Butterworth DE, Warren BJ, Utter A, et al.
Carbohydrate supplementation and the lympho- cyte proliferative response to long endurance running. Int J Sports Med 1998;19:574-80.
23)Nehlsen-Cannarella SL, Fagoaga OR, Nieman DC, Henson DA, Butterworth DE, Schmitt RL, Bailey EM, et al. Carbohydrate and the cytokine response to 2.5 h of running. J Appl Physiol 1997;
82:1662-7.
24)Scharhag J, Meyer T, Auracher M, Gabriel HH, Kindermann W. Effects of graded carbohydrate supplementation on the immune response in cycling. Med Sci Sports Exerc 2006;38:286-92.
25)Elkinton JR, Danowski TS, Winkler AW. He- modynamic changes in salt depletion and in dehydration. J Clin Invest 1946;25:120-9.
26)Hed J. The extinction of fluorescence by crystal violet and its use to differentiate between attached and ingested micro-organisms in phagocytosis. FEMS Microbiol Lett 1977;1:357-61.
27)Sahlin S, Hed J, Rundquist I. Differentiation be- tween attached and ingested immune complexes by a fluorescence quenching cytofluorometric assay. J Immunol Methods 1983;60:115-24.
28)Flynn MG, Pizza FX, Boone Jr JB, Andres FF, Michaud TA, Rodriguez Zayas JR. Indices of training stress during competitive running and swimming seasons. Int J Sports Med 1994;15:21-6.
29)Koutedakis Y, Raafat A, Sharp NC, Rosmarin MN, Beard MJ, Robbins SW. Serum enzyme activities in individuals with different levels of physical fitness. J Sports Med Phys Fitness 1993;33:252-7.
30)Olerud JE, Homer LD, Carroll HW. Incidence of acute exertional rhabdomyolysis. Serum myoglobin and enzyme levels as indicators of muscle injury.
Arch Intern Med 1976;136:692-7.
31)Lemon PW, Mullin JP. Effect of initial muscle glycogen levels on protein catabolism during exercise. J Appl Physiol 1980;48:624-9.
32)Ebbeling CB, Clarkson PM. Exercise-induced muscle damage and adaptation. Sports Med 1989;
7:207-34.
33)Pedersen BK, Nielsen HB. Acute exercise and immune system. Pedersen BK, ed. Exercise and immunology. New York: Springer; 1997. p.5-38.
34)Pedersen BK, Rohde T, Bruunsgaard H. Exercise and cytokines. Pedersen BK, ed. Exercise and immunology. New York: Springer; 1997. p.89-111.
35)Pedersen BK, Kappel M, Klokker M. Possible role of stress hormones in exercise-induced im- munomodulation. Pedersen BK, ed. Exercise and immunology. New York: Springer; 1997. p.39-60.
36)MacKinon LT, Jenkins DG. Decreased salivary immunoglobulins after intense interval exercise before and after training. Med Sci Sports Exerc 1993;25:678-83.
37)Nieman DC, Tan SA, Lee JW, Berk LS. Comple- ment and immunoglobulin levels in athletes and sedentary controls. Int J Sports Med 1989;10:124-8.
38)Dufaux B, Order U, Liesen H. Effect of a short maximal physical exercise coagulation, fibrinolysis, and complement system. Int J Sports Med 1991;12
(suppl 1):S38-42.
39)Thomsen BS, Rodgaard A, Tvede N, Hansen FR, Steensberg J, Halkjaer Kristensen J, et al. Levels of complement receptor type one (CR1, CD35) on erythrocytes, circulating immune complexes and complement C3 splint products C3d and C3s are not changed by short-term physical exercise or training. Int J Sports Med 1992;13:172-5.
40)Dufaux B, Order U. Complement activation after prolonged exercise. Clinica Chimica Acta 1989;179:45-50.
41)Mashiko T, Umeda T, Nakaji S, Sugawara K.
Position-related analysis of the appearance of and relationship between post-match physical and mental fatigue in university rugby football players. Br J Sports Med 2004;38:617-21.
42)Silva MT. Neutrophils and macrophages work in concert as inducers and effectors of adaptive immunity against extracellular and intracellular microbial pathogens. J Leukoc Biol 2010;87:805-13.
43)Pyne DB. Exercise-induced muscle damage and inflammation: a review. Aust J Sci Med Sport 1994;26:49-58.
44)Duarte JA, Appell HJ, Carvalho F, Bastos ML, Soares JM. Endothelium-derived oxidative stress may contribute to exercise-induced muscle damage. Int J Sports Med 1993;14:440-3.
45)Yamamoto Y, Nakaji S, Umeda T, Matsuzaka M, Takahashi I, Tanabe M, Danjo K, et al. Effects of long-term training on neutrophil function in male university judoists. Br J Sports Med 2008;42:255-9.
46)Mochida N, Umeda T, Yamamoto Y, Tanabe M, Kojima A, Sugawara K, Nakaji S. The main neutrophil and neutrophil-related functions may compensate for each other following exercise
−a finding from training in university judoists.
Luminescence 2007;22:20-8.
47)Kowatari K, Umeda T, Shimoyama T, Nakaji S, Yamamoto Y, Sugawara K. Exercise training and energy restriction decrease neutrophil phagocytic activity in judoists. Med Sci Sports Exer 2001;33:
519-24.
48)Koga T, Umeda T, Kojima A, Tanabe M, Yamamoto Y, Takahashi I, Iwasaki H, et al.
Influence of a 3-month training program on muscular damage and neutrophil function in male university freshman judoists. Luminescence 2013 Mar;28(2):136-42. doi: 10.1002/bio.2352.
49)Hand WL, Hand DL, Vasquez Y. Increased polymorphonuclearleukocyte respiratory burst function in type 2 diabetes. Diabetes Res Clin Pract 2007;76:44-50.
50)Yasunari K, Maeda K, Nakamura M, Yoshikawa J. Oxidative stress in leukocytes is a possible link between blood pressure, blood glucose, and C-reacting protein. Hypertension 2002;39:777-80.
51)Karima M, Kantarci A, Ohira T, Hasturk H, Jones VL, Nam BH, Malabanan A, et al. Enhanced superoxide release and elevated protein kinase C activity in neutrophils from diabetic patients:
association with periodontitis. J Leukoc Biol 2005;78:862-70.
52)Omori K, Ohira T, Uchida Y, Ayilavarapu S, Batista EL Jr, Yagi M, Iwata T, et al. Priming of neutrophil oxidative burst in diabetes requires preassembly of the NADPH oxidase. J Leukoc Biol 2008;84:292-301.
53)Dékány M, Nemeskéri V, Györe I, Harbula I, Malomsoki J, Pucsok J. Antioxidant status of interval-trained athletes in various sports. Int J Sports Med 2006;27:112-6.
54)Buczynski A, Kedziora J, Tkaczewski W, Wachowicz B. Effect of submaximal physical exercise on antioxidative protection of human blood platelets. Int J Sports Med 1991;12:52-4.
55)Mena P, Maynar M, Gutierrez JM, Maynar J, Timon J, Campillo JE. Erythrocyte free radical scavenger enzymes in bicycle professional racers.
Adaptation to training. Int J Sports Med 1991;
12:563-6.