1
Pretreatment immune status correlates with progression-free survival in chemotherapy-treated metastatic colorectal cancer patients
Kohei Tada1,2,3, Shigehisa Kitano4,5, Hirokazu Shoji6, Takashi Nishimura7, Yasuhiro Shimada6, Kengo Nagashima8, Kazunori Aoki9, Nobuyoshi Hiraoka10, Yoshitaka Honma6, Satoru Iwasa6, Natsuko Okita6, Atsuo Takashima6, Ken Kato6, Yasuhide Yamada6, Naoyuki Katayama2, Narikazu Boku6, Yuji Heike1,3, Tetsuya Hamaguchi6
1National Cancer Center Hospital, Tokyo, Japan
2Department of Hematology and Oncology, Mie University Graduate School of Medicine, Mie, Japan
3Immunotherapy and Cell Therapy Service, St. Luke’s International Hospital, Tokyo, Japan
4Department of Experimental Therapeutics (ex. Phase I trial center), National Cancer Center Hospital, Tokyo, Japan
5Exploratory Oncology Research & Clinical Trial Center, Division of Cancer Immunotherapy, National Cancer Center, Tokyo, Japan
6Gastrointestinal Medical Oncology Division, National Cancer Center Hospital, Tokyo, Japan
7Department of Gastrointestinal Medicine, Tokyo Jikei Medical University, Tokyo, Japan
8Department of Global Clinical Research, Graduate School of Medicine, Chiba University, Chiba, Japan
9Division of Molecular and Cellular Medicine, National Cancer Center Research Institute, Tokyo, Japan
10Division of Molecular Pathology, National Cancer Center Research Institute, Tokyo, Japan
2
Corresponding author: Yuji Heike, Immunotherapy and Cell Therapy Service, St. Luke’s International Hospital, 9-1, Akashi-Cho, Chuo-ku, Tokyo, 104-8560, Japan.
Tel: +81-3-3541-5151; Fax: +81-3-5550-7532; E-mail: [email protected]
Content count: text: 3848 words; abstract: 249words; 2 figures; 3 tables; 33 references; 4 supplemental tables; 2 supplemental figures
Financial support
This work was supported in part by JSPS KAKENHI(Grants-in-Aid for Scientific Research), a Grant-in-Aid for Cancer Research from the Ministry of Health, Labor and Welfare of Japan and the National Cancer Center Research and Development Fund (23-A-44 and 26-A-11).
Conflicts of interest
The authors have no conflicts of interest to declare.
Synopsis
It was not clear whether immune cell subsets in peripheral blood have prognostic value for patients about to undergo first-line chemotherapy. This prospective study revealed an immune signature that correlated with significantly longer progression-free survival.
Abstract
It remains unclear whether the immunological status of cells in peripheral blood can be used as
3
a prognostic indicator of response to treatment for patients with unresectable metastatic colorectal cancer (MCRC). We therefore investigated the relationship between the pretreatment immunological status of 40 MCRC patients who planned to receive the first-line chemotherapy and their progression-free survival. Twenty-five immune cell subsets, including monocytic myeloid-derived suppressor cells (M-MDSC) and effector memory T cells (TEM), were measured by multicolor-flow cytometry. We divided patients into high and low (above and below the median, respectively) groups based on the median value for each immune cell subset and compared progression-free survival of the two groups. Patients with high M-MDSC, low CD4+ TEM, or low CD8+ TEM quantities had significantly shorter progression-free survival (P = 0.004, 0.005, and 0.002, respectively). Patients were classified into two prognostic groups based on numbers of adverse factors; having two or three adverse factors (n = 21, 52.5%) correlated with significantly shorter progression-free survival compared to none or 1 (n = 19, 47.5%) (P <
0.001). The presence of two or three adverse factors was an independent poor prognostic factor for progression-free survival (HR, 9.2; 95% CI, 2.5-34.2; P < 0.001). These results provide evidence that pretreatment peripheral immune status can inform the outcome of MCRC patients treated with first-line chemotherapy.
Introduction
Effector T cells in cancer patients respond to tumor cells. Cytotoxic CD4+ or CD8+ T cells recognize tumor-specific antigens or tumor-associated antigens and exert direct cytotoxic actions against tumor cells. Colorectal cancer was the first neoplasia found to be under immune surveillance (1, 2). An increased quantity of tumor-infiltrating lymphocytes (TILs), CD3+ cells, CD8+ cells, and Th1 cells in surgically resected colorectal tumor specimens is associated with an
4
improved prognosis (1, 3-11). In a more detailed analysis of the infiltrating T cells, the quantity of CD45RO+ cells (memory T cells) or effector memory (TEM) cells in a colorectal tumor was shown to have strong prognostic significance after surgery (12, 13).
However, it has not been determined whether the quantity of T cells or memory T cells correlates with the outcome of unresectable metastatic colorectal cancer (MCRC) patients treated with systemic chemotherapy. Because of the limited opportunities for obtaining resected specimens in MCRC patients, TIL analyses are difficult to conduct, and thus alternative immunological parameters for determination of prognosis are needed. Peripheral blood is easily obtained with little burden on patients. Our preliminary study, which quantified the immune cells in peripheral blood of gastrointestinal patients treated with a peptide vaccine, suggested that patients with a high quantity of memory T cells in peripheral blood at pretreatment had durable stable disease, whereas patients with a low quantity had early progressed disease (unpublished data). Memory T cells are subdivided into TEM and central memory (TCM) cells.
The former play an important role in antitumor immunity (12, 14, 15). Therefore, we hypothesized that the quantity of TEM cells in peripheral blood might correlate with prognoses of MCRC patients.
Immune-suppressive cells, including myeloid-derived suppressor cells (MDSC), inhibit the activation and proliferation of effector T cells, such that the tumor can evade the host immune response. Large numbers of MDSC are a poor prognostic factor for various cancer patients (16-20). Therefore, we also hypothesized that the quantity of MDSCs might affect the prognosis of MCRC patients.
In the current prospective study, the primary objective was to investigate the relationship between the quantity of TEM cells or MDSCs in peripheral blood and the progression-free survival (PFS) of unresectable MCRC patients who had received first-line chemotherapy. We
5
also carried out an exploratory investigation of the relationship between the quantity of other immune cells and PFS of those patients.
Materials and Methods Patients
Patients (n = 40) were prospectively enrolled to this study if they met the following criteria:
at least 20 years of age; histologically proven adenocarcinoma of the colorectum; curatively unresectable, metastatic or recurrent disease; scheduled to receive oxaliplatin-based first line chemotherapy; no active viral infection such as with the human immunodeficiency virus, hepatitis B and/or C. Attending physicians chose either the fluorouracil, folinic acid, and oxaliplatin (FOLFOX) regimen or the capecitabine plus oxaliplatin (XELOX) regimen combined with bevacizumab (BV). The FOLFOX regimen consisted of a simultaneous intravenous infusion of 85 mg/m2 oxaliplatin (2h), 200mg/m2 l-leucovorin (2h) and 400mg/m2 bolus fluorouracil on day 1, followed by a continuous infusion of 2400mg/m2 fluorouracil (46h), repeated every 2 weeks(21). The XELOX regimen consisted of 130mg/m2 oxaliplatin (2h) on day 1 plus oral capecitabine 1000mg/m2 twice daily for 2 weeks, repeated every 3 weeks(22).
BV was administered before oxaliplatin at a dose of 5mg/kg (FOLFOX) or 7.5mg/kg (XELOX) on day 1 of each cycle. These treatments were repeated until disease progression, unacceptable toxicities or patient’s refusal. The FOLFOX without BV regimen was used only when a patient had a history of vascular complications. To evaluate treatment efficacy, systemic computed tomography was repeated every two months. All of the patients provided fully informed consent for study registration and blood collection. The study protocol was reviewed and approved by the institutional ethics committee of the National Cancer Center
6 Staining of peripheral blood mononuclear cells
Peripheral blood was collected within 5 days before initial chemotherapy administration. The second and 3rd blood collection was performed just before the 5th cycle (9th week) in the FOLFOX±BV cohort or the 3rd cycle (7th week) in the XELOX+BV cohort, and at 6 months after initial chemotherapy, respectively. If chemotherapy was terminated because of disease progression or an adverse event before the 2nd or 3rd blood collection, blood was collected at that time.
Blood samples were centrifuged and the separated plasma was cryopreserved. Peripheral blood mononuclear cells (PBMCs) were isolated from peripheral blood by density gradient centrifugation. MDSCs were measured in fresh PBMC samples, because a previous study demonstrated that the MDSC fraction is decreased by cryopreservation(23). Dendritic cells (DCs) were measured at the same time as measurement of the MDSC because a common flow cytometry panel was used for both cell subsets. The remaining PBMCs were cryopreserved and used for measurements of T cells, regulatory T cells (Treg), and NK cells.
Aliquots containing 2.5 x 10⁵ - 5 x 10⁵ PBMCs were suspended in 100 μL staining buffer (phosphate buffered saline containing 2% fetal bovine serum [FBS]). The antibodies for surface markers were then added followed by a 30-minute incubation at 4 ˚C. For staining of
intracellular proteins (Ki-67, FOXP3, perforin, and granzyme B), FOXP3/Transcription Factor for Staining Buffer Set (eBioscience) was used according to the manufacturer’s protocol. The antibodies used were as follows: Lineage (Lin, CD3/CD16/CD19/CD20/CD56) cocktail FITC (fluorescein isothiocyanate), CD14–PerCP (peridinin chlorophyll protein)-Cy5.5, CD11b–APC (allophycocyanin)-Cy7, CD33–PE (phycoerythrin)-Cy7, CD11c–Alexa Fluor700 , CD123–
Brilliant Violet 421, CD15–V500, CD3-APC, Ki-67–Alexa Fluor700, CD8–APC-Cy7, granzyme B–FITC, CD56–PE-CF594 (BD Pharmingen), CD4–Brilliant Violet 650, CD16–
7
PerCP-Cy5.5, CCR7–PerCP-Cy5.5 (Biolegend), FOXP3–PE, CD66b–APC (eBioscience), CD45RA–FITC, HLA-DR–ECD (Beckman Coulter), and perforin-PE (Cell Sciences). Isotype controls included the appropriate fluorochrome-conjugated mouse IgG1, IgG1/, or IgG2a/.
The stained cells were detected using a LSR II Fortessa with FACS Diva software (BD Biosciences). All analyses were carried out using FlowJo software (Tree star).
Definition and analysis of immune cell subsets
We analyzed 25 immune cell subsets in this study. The immune cell subsets were defined as follows: monocytic MDSC (M-MDSC), Lin–CD14+CD33+CD11b+HLA-DRlow/–,
Granulocytic MDSC (Gr-MDSC), CD33dimCD15+CD66+CD11b+, naive Treg,
CD3+CD4+CD45RA+FOXP3low, effector Treg, CD3+CD4+CD45RA–FOXP3high, plasmacytoid DC, Lin–CD14–CD123+HLA-DRhigh, myeloid DC, Lin–CD14-CD11c+HLA-DRhigh. T cells were classified as naïve (CD45RA+CCR7+), central memory (CD45RA–CCR7+), effector memory (CD45RA–CCR7–), and terminally differentiated effector cells (CD45RA+CCR7–) in CD4+ or CD8+ cells. Expression of granzyme B, perforin, and Ki-67 was also assessed in CD4+ or CD8+ T cells. Appropriate isotype controls served as the cut-off levels between positivity and
negativity. A positive gate was set to include less than 0.1% cells in each specimen with a matched isotype control.
The proportion of lymphoid subsets was obtained by dividing the cell number of each subset by the cell number of the lymphocyte fraction based on the results of flow cytometric analysis.
Absolute counts of lymphoid subsets (/μL) were estimated using the following formula:
(Proportion of each lymphoid subset) x (absolute count of lymphocytes [/μL]). The M-MDSC proportion in the monocytes was obtained by dividing the cell number of HLA-DRlow/– by the cell number of Lin-CD14+CD33+CD11b+. The absolute count of M-MDSC (/μL) in peripheral
8
blood was estimated using the formula: (Proportion of M-MDSCs) x (absolute count of monocytes /μL) (19).
Measurement of cytokines in plasma
Cryopreserved plasma was used for measuring vascular endothelial growth factor (VEGF)-A, VEGF-C, VEGF-D, interleukin (IL)2, IL6, IL8, IL10, interferon (IFN)-γ, tumor necrosis factor (TNF)α, and granulocyte macrophage colony-stimulating factor (GM-CSF). These cytokines were simultaneously measured on an MSD SECTOR Imager 2400 instrument (Meso Scale Discovery, Inc) according to the manufacturer’s protocol.
Statistical analysis
The primary objective of the analysis was to describe the relationship between pretreatment peripheral immune status and PFS. Based on the median values for proportion of or absolute counts for each immune cell subset or cytokine value, the patients were divided into high (above median) and low (below median) groups. PFS was defined as the time period from the day of initial chemotherapy until disease progression or death from any cause. Disease progression was judged according to the Response Evaluation Criteria in Solid Tumors guidelines (Version 1.1).
Cox proportional hazards models were used to estimate the effect of immune status. The proportional hazards assumption was confirmed by a score test for proportional hazards (24); no relevant violations of the assumption were found. The following model building process was done. Step 1: Variables included twenty-five immune cell subsets. Variables with a P value <
0.05 on univariate analysis were considered candidate variables. Finally, the candidate variables were combined into a single variable of immune status, because the absolute values of these coefficients were similar. Step 2: As the final analysis, a multivariate Cox proportional hazards
9
model was used after adjustment for important covariates. An important covariate is defined as a characteristic that meets any of the following criteria; it is a known prognostic factor (e.g., use of bevacizumab); removal of the covariate has produced an important change (more than 10 %) in the coefficient of the immune status. This final model was chosen based on a clinical and statistical perspective by reference to a previously published approach(25).
For the patient characteristics, summary statistics comprise frequencies and proportions for categorical variables, and median and range for a continuous variable. Between-group differences in patient characteristics were analyzed with Fisher’s exact test. The Kaplan–Meier method was used to estimate the PFS, and the differences were compared using the log-rank test.
The Student t test was used for comparisons of measured values of cytokines. Pearson correlation was used to evaluate for relationships between two immune cell subsets.
All P values are two-sided. P values of < 0.05 were considered to indicate statistical significance, and 95% confidence intervals were calculated. All statistical analyses were performed using SAS software version 9.4 (SAS Institute, Cary, NC, USA).
Results
Patient characteristics
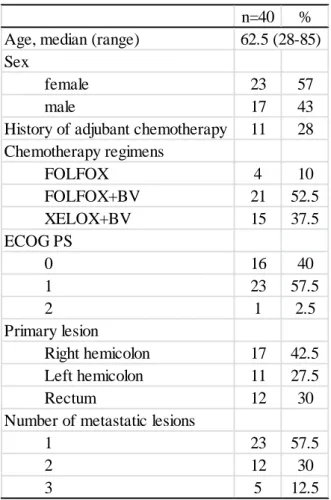
Patient characteristics are presented in Table 1: 21 (52.5%) and 15 (37.5%) patients were treated with FOLFOX+BV and XELOX+BV, respectively; 4 (10%) patients received FOLFOX without BV because they had past history of vascular complication; and 39 (97.5%) patients had good performance status (PS, 0-1).
Associations between the quantity of each immune cell subset and PFS
The gating strategy and representative dot plots for M-MDSCs and effector memory cells in
10
CD4+ or CD8+ T cell fractions (CD4+ TEM or CD8+ TEM) are shown in Fig. 1A and B. The median values of the proportion and absolute count for each immune cell subset were 13.3%
(range, 0.7-59.0) and 40.5/μL (range, 1.5-536.3) for M-MDSC, 7.1% (range, 2.8-21.5) and 86.5/μL (range, 36.9-326.8) for CD4+TEM, and 9.9% (range, 1.5-14.3) and 75.1/μL (range, 13.9-274.0) for CD8+TEM, respectively. The gating strategy and representative dot plots for other immune cell subsets (Gr-MDSC, Treg, DC, NK cells, Granzyme B+, Perforin+, or Ki-67+ cells) are shown in Supplementary Fig. S1.
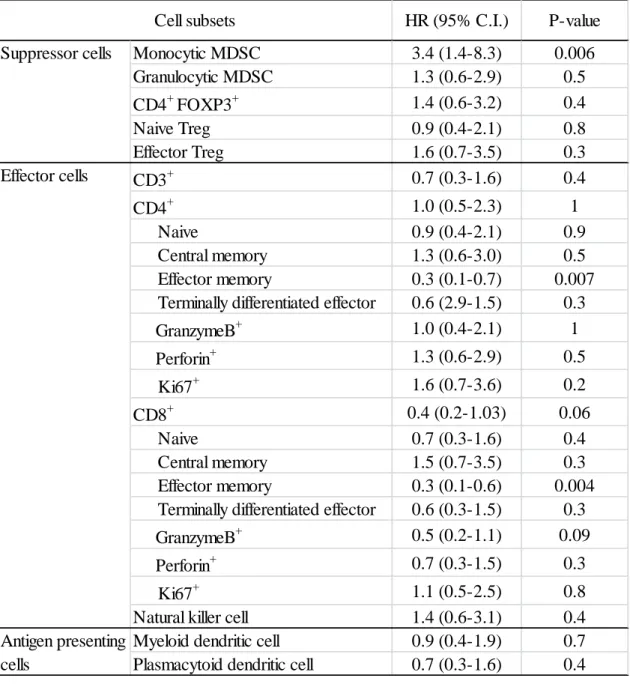
Patients were divided into high (>median) and low (<median) groups based on the median value of the proportion for each immune cell subset, and PFS was then compared between each pair of groups (Table 2). A high proportion of M-MDSCs, low proportion of CD4+ TEM and low proportion of CD8+ TEM were associated with significantly shorter PFS (median PFS, not reached vs. 8.5, not reached vs 8.5, not reached vs. 9.0 months; p=0.004, 0.005, and 0.002, respectively, Fig. 1C). A high absolute count of M-MDSCs, low absolute count of CD4+ TEM, and low absolute count of CD8+ TEM were also associated with significantly shorter PFS (p=0.005, 0.03, and 0.046, respectively).
Correlations between quantities of M-MDSC, CD4+ TEM, and CD8+ TEM
Because the quantities of M-MDSC, CD4+ TEM, or CD8+ TEM each correlated with PFS, correlations between each pair among the proportions of M-MDSC, CD4+ TEM, and CD8+ TEM
were investigated (Fig. 2A). A weak inverse correlation between M-MDSC and CD4+ TEM was observed (r=-0.33, p=0.03): 14 (35%) patients presented with high M-MDSC and low CD4+ TEM, while 14 (35%) patients had low M-MDSC and high CD4+ TEM. This inverse correlation is reasonable because MDSCs are immune suppressive cells that inhibit the proliferation and activation of T cells. However, the quantities of M-MDSCs and CD4+ TEM were somewhat
11
discrepant: 6 (15%) patients presented with low M-MDSCs with low CD4+ TEM, whereas 6 (15%) had high M-MDSC with high CD4+ TEM. Similarly, there was a trend toward an inverse correlation between M-MDSC and CD8+ TEM, although the difference did not reach statistical significance (r = -0.28, P = 0.08): 13 (32.5%) patients each presented with high M-MDSC and low CD8+ TEM, or low M-MDSC and CD8+ TEM, whereas 7 (17.5%) each had low M-MDSC with low CD8+ TEM, and high M-MDSC with high CD8+ TEM. In addition, a weak positive correlation between CD4+ TEM and CD8+ TEM was observed (r = 0.32, P = 0.045): 14 (35%) patients each presented with high CD4+ TEM and high CD8+ TEM, or low CD4+ TEM and low CD8+ TEM, whereas 6 (15%) each had low CD4+ TEM with high CD8+ TEM, and high CD4+ TEM
with low CD8+ TEM.
Based on this grouping, univariate analyses were performed to estimate the hazard ratio (HR) of each immunologically distinct subgroup (Supplemental Table S1). Patients with high M-MDSC and low CD4+ TEM values had significantly higher HR than those with low M-MDSC and high CD4+ TEM (HR 6.9; 95% confidence interval [CI], 2.1-22.9; P = 0.001). Similarly, patients with high M-MDSC and low CD8+ TEM values had significantly higher HR than those with low M-MDSC and high CD8+ TEM values (HR 9.1; 95% CI, 2.4-34.7; P = 0.001). In addition, patients with low CD4+ TEM and low CD8+ TEM values had significantly higher HR than those with high CD4+ TEM and high CD8+ TEM values (HR 7.2; 95% CI, 2.2-23.8; P = 0.001).
Combined M-MDSC, CD4+TEM, and CD8+TEM assessments improved PFS prediction High M-MDSC, low CD4+ TEM, or low CD8+ TEM values were adverse immunological factors.
We also noted that approximately 70% of patients presented with concordance between the quantity of M-MDSC and that of CD4+ TEM or CD8+ TEM, whereas approximately 30% showed
12
discrepant results for these quantities. Therefore, we investigated whether a combined
assessment of the immune suppressive cells (M-MDSCs) and effector memory cells (CD4+ TEM
and CD8+ TEM) would increase the accuracy of predicting clinical outcomes for the different patient groups. Patients were divided into four groups based on the numbers of adverse
immunological factors; Group 1, no adverse factors (n = 11, 27.5%); Group 2, one (n = 8, 20%);
Group 3, two (n = 11, 27.5%); Group 4, three (n = 10, 25%) (Fig. 2B). The Kaplan-Meier curves for the PFS of each group are shown in Fig. 2C. The curve of Group 1 overlapped that of Group 2, and the curve of Group 3 overlapped that of Group 4. These findings suggest that Groups 1 and 2 have an equivalent prognosis, as do Groups 3 and 4. Therefore, Groups 1 and 2 were combined, as were Groups 3 and 4. The Kaplan-Meier curves of Group 1/2 and Group 3/4 are shown in Fig. 2D. Group 3/4 had significantly shorter PFS than Group 1/2 (median PFS, not reached vs. 8.0 months, p<0.001).
Next, patient characteristics were compared between Group 1/2 and Group 3/4
(Supplemental Table S2). Group 3/4 included a significantly higher number of patients with elevated alkaline phosphatase (ALP) values (> normal range) (P = 0.02), but the differences between Group 1/2 and Group 3/4 with regard to other characteristics such as age, sex, history of adjuvant chemotherapy, use of BV, ECOG PS, primary lesion, and number of metastatic lesions were not significant.
Finally, the uni- and multivariate analyses for PFS were performed on different Groups, patient characteristics, and cytokine values (Table 3 and Supplemental Table S3). The
multivariate analysis demonstrated Group 3/4 to have a significantly higher HR than Group 1/2 (HR 9.2; 95% CI, 2.5-34.2; p<0.001) after adjusting for important covariates which were chosen based on the criteria as described in Statistical analysis.
13
Comparison of plasma cytokine concentrations between Group 1/2 and Group 3/4 We measured the concentration of 10 plasma cytokines to assess any differences between Group 1/2 and Group 3/4 (Supplemental Table S4). Concentrations of VEGF-A in Group 3/4 were significantly higher than that in Group 1/2 (mean ± SD, 87.0 ± 62.5 v.s. 35.6 ± 21.4; P = 0.002, Fig. 2E), and IL6 was also significantly higher in Group 3/4 than in Group 1/2 (mean ± SD, 5.2 ± 4.7 v.s. 1.9 ± 1.9; P = 0.007, Fig. 2E). The two groups had no significant differences in other cytokines, such as VEGF-C, VEGF-D, IL2, IL8, IL10, IFN-γ, TNFα, and GM-CSF.
Quantitative changes in M-MDSC and TEM after chemotherapy and their impact on PFS We also analyzed the quantity of M-MDSC and TEM cells after chemotherapy. Although a 2nd blood collection was performed in all patients (n = 40), a 3rd blood collection was done only in 31 patients because of discontinuance of chemotherapy or patients’ withdrawal. The means of %M-MDSC or %TEM were compared between before (1st blood collection) and after chemotherapy (2nd or 3rd blood collection) using a paired-t test; however, no tendency for an increase or decrease of any immune cell subset was noted (Supplemental Fig. S2A). Regarding changes in immune cell subsets from before chemotherapy to the 2nd blood sample, M-MDSC increased in 18 (45%) patients and decreased in 22 (55%), CD4+TEM increased in 18 (45%) and decreased in 22 (55%), and CD8+TEM increased in 25 (62.5%) and decreased in 15 (37.5%). PFS was then compared between patients who showed an increase or decrease in those cells;
however, no significant differences were found (patients with increased vs. decreased M-MDSC, CD4+TEM and CD8+TEM; P = 0.3, 0.9, and 0.3, respectively) (Supplemental Fig. S2B).
Comparison of PFS between before chemotherapy and the 3rd blood sample was not performed because patients who underwent a 3rd blood collection were selected patients who could continue initial chemotherapy for up to 6 months.
14 Discussion
The present study demonstrated that pretreatment immune status correlates with the PFS of patients with unresectable MCRC given first-line chemotherapy. We analyzed 25 immune cell subsets and identified high M-MDSC, low CD4+ TEM, and low CD8+ TEM values as adverse prognostic factors for PFS. Additionally, combined assessment of all three adverse factors demonstrated the outcomes of patients who had two or three of these factors (Group 3/4) to be significantly poorer than those of patients who had zero or 1 adverse factor (Group 1/2). This negative impact remained significant in multivariate analysis. Although many retrospective studies have already shown that the quantity of TILs in surgically-resected specimens correlates the outcomes of patients with resectable colorectal cancer (1, 3-13, 26), this prospective study has demonstrated that the quantity of immune cells in peripheral blood correlates the outcomes of those with unresectable tumors.
Approximately 27.5% of the patients in this study had low M-MDSC, high CD4+TEM, and high CD8+TEM values(Group 1), whereas 25% of patients had high M-MDSC, low CD4+TEM, and low CD8+TEM values (Group 4). This inverse correlation between M-MDSC and effecter memory T cells is reasonable because MDSC are immune suppressive cells that inhibit the proliferation and activation of T cells. However, the remaining 47.5% of patients (Groups 2 and 3) showed discrepant results for the quantities of M-MDSC, CD4+TEM, and CD8+TEM. These results suggest that the quantities of M-MDSCs, CD4+TEM, and CD8+TEM are specific for each patient (Fig. 2B and Supplemental Fig. S2). Therefore, combined assessment of the immune suppressive cells (M-MDSC) and the cytotoxic effector cells (CD4+TEM and CD8+TEM) may provide a more appropriate reflection of the immune status of each patient and would also, presumably, illustrate the correlation between immune status and prognosis more accurately
15
than individual assessments of these cell subsets. For example, a patient with a high quantity of M-MDSCs would generally have a short PFS, but the negative impact might be canceled in the presence of high quantities of CD4+TEM and/or CD8+TEM. Similarly, although a patient with a low quantity of CD8+TEM might be expected to have a short PFS, the negative impact could be canceled in the presence of a low M-MDSC and a high CD4+TEM value. In fact, we
demonstrated that PFS in Group 2, which consisted of such patients, is equivalent to that in Group 1 comprised of patients with low M-MDSC, high CD4+TEM and high CD8+TEM values ( Fig. 2C). Our results demonstrate that individual assessments of M-MDSC and effector memory T cells have potential prognostic value for PFS and that the combined assessment of these cell subsets predicts PFS with greater accuracy than that of any one cell subset alone.
We demonstrated that the immune status at pretreatment correlated with PFS, however, changes of those cells after chemotherapy did not correlate with PFS. It is very likely that change of immune status after chemotherapy is influenced by several factors, such as direct cytotoxicity from therapeutic agents, disease progression or regression, incidence of adverse event and so on. These various factors may make it difficult to interpret the correlation between change of immune status and PFS.
We also analyzed plasma cytokines that affect the formation of immune cell subsets. We found that VEGF-A and IL6 were significantly higher in Group 3/4 than in Group 1/2. VEGF-A contributes to not only tumor angiogenesis but also formation of the immunosuppressive microenvironment in tumors (27). VEGF-A augments MDSCs (28, 29) and inhibits DC maturation (30, 31), directly inhibits the activation and proliferation of T cells (32), and upregulates expression of the programmed death-1 molecule on T cells (33). IL6 is a
multifunctional cytokine with pro- and anti-inflammatory activities. Under certain pathological circumstances, IL6 augments MDSCs. Based on these findings, increased VEGF-A and IL6
16
concentrations in our cohort may have contributed to the adverse immune status, which resulted in shorter PFS.
Our present prospective study included a rather small number of patients. Nevertheless, we identified statistically significant prognostic factors for PFS. Assessment of the impact on overall survival requires an additional follow-up period because only 8 of our patients did not survive. Despite this limitation, our results have meaningful clinical implications; antitumor immunity may be helpful for the effects of chemotherapy, and thus provide a rationale for developing a regimen combining chemotherapy with immunotherapy. An immunotherapeutic approach that reduces M-MDSC or increases effector memory T cells might overcome immunologically-mediated adverse impacts on prognosis.
In conclusion, we analyzed 25 immune cell subsets in peripheral blood from patients with unresectable MCRC before first-line chemotherapy and identified high M-MDSC, low
CD4+TEM and CD8+TEM quantities as significant adverse factors for PFS. Combining the assessment of these three adverse factors gave greater accuracy of PFS prediction for the immunologically different patient subgroups. These results suggest that pretreatment peripheral immune status correlates with the outcomes of patients with unresectable MCRC receiving first-line chemotherapy. Further studies involving patients with other types of cancer are warranted to assess our results.
Acknowledgments
We thank Kei Nakano-Miura and Tsukasa Shinohara, who provided invaluable technical support. We also thank Dr. Yoichi Takaue for reviewing the manuscript.
17 References
1. House AK, Watt AG. Survival and the immune response in patients with carcinoma of the colorectum. Gut. 1979;20(10):868-74. Epub 1979/10/01.
2. Kroemer G, Galluzzi L, Zitvogel L, Fridman WH. Colorectal cancer: the first neoplasia found to be under immunosurveillance and the last one to respond to immunotherapy?
Oncoimmunology. 2015;4(7):e1058597. Epub 2015/07/04.
3. Chiba T, Ohtani H, Mizoi T, Naito Y, Sato E, Nagura H, et al. Intraepithelial CD8+
T-cell-count becomes a prognostic factor after a longer follow-up period in human colorectal carcinoma: possible association with suppression of micrometastasis. British journal of cancer.
2004;91(9):1711-7. Epub 2004/10/21.
4. Galon J, Costes A, Sanchez-Cabo F, Kirilovsky A, Mlecnik B, Lagorce-Pages C, et al.
Type, density, and location of immune cells within human colorectal tumors predict clinical outcome. Science. 2006;313(5795):1960-4. Epub 2006/09/30.
5. Halvorsen TB, Seim E. Association between invasiveness, inflammatory reaction, desmoplasia and survival in colorectal cancer. Journal of clinical pathology. 1989;42(2):162-6.
Epub 1989/02/01.
6. Jass JR. Lymphocytic infiltration and survival in rectal cancer. Journal of clinical pathology. 1986;39(6):585-9. Epub 1986/06/01.
7. Menon AG, Janssen-van Rhijn CM, Morreau H, Putter H, Tollenaar RA, van de Velde CJ, et al. Immune system and prognosis in colorectal cancer: a detailed immunohistochemical analysis. Laboratory investigation; a journal of technical methods and pathology.
2004;84(4):493-501. Epub 2004/02/18.
8. Mlecnik B, Tosolini M, Kirilovsky A, Berger A, Bindea G, Meatchi T, et al.
Histopathologic-based prognostic factors of colorectal cancers are associated with the state of the local immune reaction. Journal of clinical oncology : official journal of the American Society of Clinical Oncology. 2011;29(6):610-8. Epub 2011/01/20.
9. Naito Y, Saito K, Shiiba K, Ohuchi A, Saigenji K, Nagura H, et al. CD8+ T cells infiltrated within cancer cell nests as a prognostic factor in human colorectal cancer. Cancer research. 1998;58(16):3491-4. Epub 1998/08/29.
10. Prall F, Duhrkop T, Weirich V, Ostwald C, Lenz P, Nizze H, et al. Prognostic role of CD8+ tumor-infiltrating lymphocytes in stage III colorectal cancer with and without microsatellite instability. Human pathology. 2004;35(7):808-16. Epub 2004/07/17.
11. Tosolini M, Kirilovsky A, Mlecnik B, Fredriksen T, Mauger S, Bindea G, et al.
Clinical impact of different classes of infiltrating T cytotoxic and helper cells (Th1, th2, treg, th17) in patients with colorectal cancer. Cancer research. 2011;71(4):1263-71. Epub 2011/02/10.
12. Pages F, Berger A, Camus M, Sanchez-Cabo F, Costes A, Molidor R, et al. Effector
18
memory T cells, early metastasis, and survival in colorectal cancer. The New England journal of medicine. 2005;353(25):2654-66. Epub 2005/12/24.
13. Pages F, Kirilovsky A, Mlecnik B, Asslaber M, Tosolini M, Bindea G, et al. In situ cytotoxic and memory T cells predict outcome in patients with early-stage colorectal cancer.
Journal of clinical oncology : official journal of the American Society of Clinical Oncology.
2009;27(35):5944-51. Epub 2009/10/28.
14. Fridman WH, Pages F, Sautes-Fridman C, Galon J. The immune contexture in human tumours: impact on clinical outcome. Nature reviews Cancer. 2012;12(4):298-306. Epub 2012/03/16.
15. Rizvi NA, Hellmann MD, Snyder A, Kvistborg P, Makarov V, Havel JJ, et al. Cancer immunology. Mutational landscape determines sensitivity to PD-1 blockade in non-small cell lung cancer. Science. 2015;348(6230):124-8. Epub 2015/03/15.
16. Arihara F, Mizukoshi E, Kitahara M, Takata Y, Arai K, Yamashita T, et al. Increase in CD14+HLA-DR -/low myeloid-derived suppressor cells in hepatocellular carcinoma patients and its impact on prognosis. Cancer immunology, immunotherapy : CII. 2013;62(8):1421-30.
Epub 2013/06/15.
17. Drews-Elger K, Iorns E, Dias A, Miller P, Ward TM, Dean S, et al. Infiltrating S100A8+ myeloid cells promote metastatic spread of human breast cancer and predict poor clinical outcome. Breast cancer research and treatment. 2014;148(1):41-59. Epub 2014/10/02.
18. Gabitass RF, Annels NE, Stocken DD, Pandha HA, Middleton GW. Elevated myeloid-derived suppressor cells in pancreatic, esophageal and gastric cancer are an independent prognostic factor and are associated with significant elevation of the Th2 cytokine interleukin-13. Cancer immunology, immunotherapy : CII. 2011;60(10):1419-30. Epub 2011/06/07.
19. Kitano S, Postow MA, Ziegler CG, Kuk D, Panageas KS, Cortez C, et al.
Computational algorithm-driven evaluation of monocytic myeloid-derived suppressor cell frequency for prediction of clinical outcomes. Cancer immunology research. 2014;2(8):812-21.
Epub 2014/05/23.
20. Walter S, Weinschenk T, Stenzl A, Zdrojowy R, Pluzanska A, Szczylik C, et al.
Multipeptide immune response to cancer vaccine IMA901 after single-dose cyclophosphamide associates with longer patient survival. Nature medicine. 2012;18(8):1254-61. Epub 2012/07/31.
21. Hochster HS, Hart LL, Ramanathan RK, Childs BH, Hainsworth JD, Cohn AL, et al.
Safety and efficacy of oxaliplatin and fluoropyrimidine regimens with or without bevacizumab as first-line treatment of metastatic colorectal cancer: results of the TREE Study. Journal of clinical oncology : official journal of the American Society of Clinical Oncology.
2008;26(21):3523-9. Epub 2008/07/22.
19
22. Cassidy J, Clarke S, Diaz-Rubio E, Scheithauer W, Figer A, Wong R, et al.
Randomized phase III study of capecitabine plus oxaliplatin compared with fluorouracil/folinic acid plus oxaliplatin as first-line therapy for metastatic colorectal cancer. Journal of clinical oncology : official journal of the American Society of Clinical Oncology. 2008;26(12):2006-12.
Epub 2008/04/19.
23. Kotsakis A, Harasymczuk M, Schilling B, Georgoulias V, Argiris A, Whiteside TL.
Myeloid-derived suppressor cell measurements in fresh and cryopreserved blood samples.
Journal of immunological methods. 2012;381(1-2):14-22. Epub 2012/04/24.
24. Grambsch PM, TM. T. Proportional hazards tests and diagnostics based on weighted residuals. Biometrika. 1994;81(3):515-26.
25. Hosmer DW, Lemeshow S, S M. Applied Survival Analysis: Regression Modeling of Time-to-Event Data, 2nd. Edition. New York: Wiley. 2008.
26. Salama P, Phillips M, Grieu F, Morris M, Zeps N, Joseph D, et al. Tumor-infiltrating FOXP3+ T regulatory cells show strong prognostic significance in colorectal cancer. Journal of clinical oncology : official journal of the American Society of Clinical Oncology.
2009;27(2):186-92. Epub 2008/12/10.
27. Huang Y, Goel S, Duda DG, Fukumura D, Jain RK. Vascular normalization as an emerging strategy to enhance cancer immunotherapy. Cancer research. 2013;73(10):2943-8.
Epub 2013/02/27.
28. Gabrilovich D, Ishida T, Oyama T, Ran S, Kravtsov V, Nadaf S, et al. Vascular endothelial growth factor inhibits the development of dendritic cells and dramatically affects the differentiation of multiple hematopoietic lineages in vivo. Blood. 1998;92(11):4150-66. Epub 1998/12/03.
29. Huang Y, Chen X, Dikov MM, Novitskiy SV, Mosse CA, Yang L, et al. Distinct roles of VEGFR-1 and VEGFR-2 in the aberrant hematopoiesis associated with elevated levels of VEGF. Blood. 2007;110(2):624-31. Epub 2007/03/23.
30. Oyama T, Ran S, Ishida T, Nadaf S, Kerr L, Carbone DP, et al. Vascular endothelial growth factor affects dendritic cell maturation through the inhibition of nuclear factor-kappa B activation in hemopoietic progenitor cells. J Immunol. 1998;160(3):1224-32. Epub 1998/05/07.
31. Dikov MM, Ohm JE, Ray N, Tchekneva EE, Burlison J, Moghanaki D, et al.
Differential roles of vascular endothelial growth factor receptors 1 and 2 in dendritic cell differentiation. J Immunol. 2005;174(1):215-22. Epub 2004/12/22.
32. Ziogas AC, Gavalas NG, Tsiatas M, Tsitsilonis O, Politi E, Terpos E, et al. VEGF directly suppresses activation of T cells from ovarian cancer patients and healthy individuals via VEGF receptor Type 2. International journal of cancer Journal international du cancer.
2012;130(4):857-64. Epub 2011/03/30.
20
33. Voron T, Colussi O, Marcheteau E, Pernot S, Nizard M, Pointet AL, et al. VEGF-A modulates expression of inhibitory checkpoints on CD8+ T cells in tumors. The Journal of experimental medicine. 2015;212(2):139-48. Epub 2015/01/21.
21 Tables
Table 1 Patient characteristics
n=40 %
Age, median (range) Sex
female 23 57
male 17 43
History of adjubant chemotherapy 11 28 Chemotherapy regimens
FOLFOX 4 10
FOLFOX+BV 21 52.5
XELOX+BV 15 37.5
ECOG PS
0 16 40
1 23 57.5
2 1 2.5
Primary lesion
Right hemicolon 17 42.5
Left hemicolon 11 27.5
Rectum 12 30
Number of metastatic lesions
1 23 57.5
2 12 30
3 5 12.5
62.5 (28-85)
22
Table 2 Associations between the proportion of each immune cell subset and PFS
Patients were divided into high (> median) and low (< median) groups based on the median value of the proportion of each immune cell subset, and univariate analyses for PFS were performed by using Cox proportional hazards models. The reference for the hazard ratio is a low group of each immune cell subset.
Abbreviations: MDSC, myeloid-derived suppressor cell; Treg, regulatory T cell
Monocytic MDSC 3.4 (1.4-8.3) 0.006
Granulocytic MDSC 1.3 (0.6-2.9) 0.5
CD4
+FOXP3
+1.4 (0.6-3.2) 0.4
Naive Treg 0.9 (0.4-2.1) 0.8
Effector Treg 1.6 (0.7-3.5) 0.3
CD3
+0.7 (0.3-1.6) 0.4
CD4
+1.0 (0.5-2.3) 1
Naive
0.9 (0.4-2.1) 0.9
Central memory1.3 (0.6-3.0) 0.5
Effector memory0.3 (0.1-0.7) 0.007
Terminally differentiated effector0.6 (2.9-1.5) 0.3
GranzymeB
+1.0 (0.4-2.1) 1
Perforin
+1.3 (0.6-2.9) 0.5
Ki67
+1.6 (0.7-3.6) 0.2
CD8
+0.4 (0.2-1.03) 0.06
Naive
0.7 (0.3-1.6) 0.4
Central memory1.5 (0.7-3.5) 0.3
Effector memory0.3 (0.1-0.6) 0.004
Terminally differentiated effector0.6 (0.3-1.5) 0.3
GranzymeB
+0.5 (0.2-1.1) 0.09
Perforin
+0.7 (0.3-1.5) 0.3
Ki67
+1.1 (0.5-2.5) 0.8
Natural killer cell 1.4 (0.6-3.1) 0.4
Myeloid dendritic cell 0.9 (0.4-1.9) 0.7 Plasmacytoid dendritic cell 0.7 (0.3-1.6) 0.4
Cell subsets Suppressor cells
Effector cells
Antigen presenting cells
HR (95% C.I.) P-value
23 Table 3 Multivariate analysis for PFS
Multivariate analysis for PFS was performed on different immune Groups, patient characteristics, and cytokine values by using a Cox proportional hazards model. Covariates were chosen based on the criteria described in Statistical analysis.
HR 95% C.I. P-value
Group
1/2 Reference
3/4 9.2 2.5-34.2 <.001
Use of bevacizumab
Used Reference
Not used 2.5 0.7-9.3 0.2
Primary lesion
Right hemicolon Reference
Left hemicolon 0.5 0.1-1.7 0.3
Rectum 0.5 0.2-1.7 0.3
IFN-γ
Low Reference
High 1.6 0.6-4.6 0.4
IL-8
Low Reference
High 2.7 0.9-8.7 0.09
Covariates Multivariate analysis (n = 40)
24 Figure Legends
Figure 1
Gating strategy and representative dot plots for M-MDSCs (A) and naïve/memory cells in T cell fractions (B). Two independent dot plots are shown as high and low M-MDSCs (A), and high and low effector memory T cells (B). The Kaplan-Meier curves for PFS are shown according to the pretreatment quantities of M-MDSCs, effector memory CD4+ T cells, and CD8+ T cells (C).
M-MDSCs, monocytic myeloid-derived suppressor cells; N, naïve; CM, central memory; EM, effector memory; TE, terminally differentiated effector
Figure 2 Combined M-MDSC, CD4+TEM, and CD8+TEM assessments
(A) Correlations between each pair of the proportions of M-MDSCs, CD4+ TEM, and CD8+ TEM
cells are shown in dot plots. Pearson’s correlation coefficient is indicated as ‘r’.
(B) Analysis of patient groups with different numbers of the adverse factors of high M-MDSC, low CD4+ TEM, and low CD8+ TEM, which we identified as adverse immunological factors as shown in Fig. 1(C) and Table 2. Patients were divided into four groups based on the number of adverse factors of each patient: Group 1, no adverse factor (n = 11); Group 2, one (n = 8);
Group 3, two (n = 11); Group 4, three (n = 10). Blue and red colors in the heat map indicate that a patient has low (< median value) or high (> median value) quantities, respectively of the corresponding immune cell.
(C, D) Kaplan-Meier curves for PFS of the four different immunological groups are shown in (C). Since the curve of Group 1 overlapped that of Group 2, and the curve of Group 3 overlapped with that of Group 4, the Groups 1 and 2 were combined, as were Groups 3 and 4.
The Kaplan-Meier curves of Group 1/2 and Group 3/4 are shown in (D). P values were calculated by the log-rank test.
25
(E) Values of VEGF-A and IL6 were compared between Group 1/2 and 3/4 by using a t-test.
The long and short horizontal lines in the figure indicate the mean and standard deviations, respectively. Comparison of other cytokines values are listed in Supplemental Table S4.
Figure 1.
26
Figure 2.
27
Supplemental Table 1 Combined assessment of quantities of two values from among M-MDSC, CD4+ TEM, and CD8+ TEM cells for correlation with PFS
Because each patient had different quantities of M-MDSC and T
EMcells, patients were divided into 4 groups based on two values from among the M-MDSC, CD4
+T
EM, and CD8
+T
EMcells. Univariate analyses for PFS were then performed on each of the 4 groups.
HR 95% C.I. P-value
low high 14 Reference
low low 6 3.1 0.8-12.4 0.1
high high 6 3.3 0.8-13.3 0.1
high low 14 6.9 2.1-22.9 0.001
M-MDSC Univariate analysis
CD4
+T
EMn
HR 95% C.I. P-value
low high 13 Reference
low low 7 5.5 1.3-23.5 0.02
high high 7 5.0 1.1-23.0 0.04
high low 13 9.1 2.4-34.7 0.001
M-MDSC CD8
+T
EMn Univariate analysis
HR 95% C.I. P-value
high high 14 Reference
low high 6 2.9 0.7-12.0 0.1
high low 6 2.4 0.5-10.6 0.3
low low 14 7.2 2.2-23.8 0.001
CD4
+T
EMCD8
+T
EMn Univariate analysis
28
Supplemental Table 2 Comparison of patient characteristics between Group 1/2 and Group 3/4
Fisher’s exact test was performed to determine whether there was a difference in each patient characteristic between Group 1/2 and Group 3/4.
Group 1/2 (n=19)
Group 3/4 (n=21)
Age 0.8
< 65 10 (53) 13 (62)
>= 65 9 (47) 8 (38)
Sex
female 13 (68) 10 (48) 0.2
male 6 (32) 11 (52)
History of adjuvant chemotherapy
Used 7 (37) 4 (19) 0.3
Not Used 12 (63) 17 (81)
Use of bevacizumab
Used 18 (95) 18 (86) 0.6
Not Used 1 (5) 3 (14)
ECOG PS
0 9 (47) 7 (33) 0.5
1 10 (53) 13 (62)
2 0 1 (5)
Primary lesion
Right hemicolon 10 (53) 7 (33) 0.4
Left hemicolon 5 (26) 6 (29)
Rectum 4 (21) 8 (38)
ALP
< normal value 17 (89) 11 (52) 0.02
> normal value 2 (11) 10 (48)
Number of metastatic lesions
0-1 13 (68) 10 (48) 0.2
>= 2 6 (32) 11 (52)
n (%)
Characteristics P-value
29
Supplemental Table 3 Univariate analysis of the covariates patient characteristics and
cytokines for PFS
Univariate analyses for PFS were performed on patient characteristics and cytokine values by using a Cox proportional hazards model. Patients were divided into high (>median) and low (<median) groups based on the median value for each cytokine.
* Reference for the hazard ratio is a low group in each cytokine value.
HR (95% CI) P-value Patient characteristics Age (<65 vs. >65) 0.9 (1.4-2.1) 0.9
Sex (F vs. M) 0.6 (0.7-3.6) 0.3
Adjuvant chemotherapy (Used vs. not used) 1.6 (0.6-4.2) 0.4 Primary lesion (Right vs. Left) 1.2 (0.5-3.2) 0.7 (Right vs. Rectum) 1.0 (0.4-2.5) 0.9 Number of metastatic sites (0-1 vs. >2) 1.6 (0.7-3.5) 0.3
ALP (<359 vs. >359) 2.5 (1.1-5.5) 0.03
Bevacizumab (Used vs. not used) 3.1 (1.01-9.4) 0.048
PS (0 vs. 1-2) 2.3 (0.95-5.6) 0.06
Cytokine values* VEGF-A 2.3 (0.97-5.3) 0.06
VEGF-C 0.9 (0.4-1.9) 0.7
VEGF-D 0.5 (0.2-1.2) 0.1
GM-CSF 1.0 (0.5-2.3) 0.9
IFN-γ 1.3 (0.6-3.0) 0.5
IL-2 0.9 (0.4-1.9) 0.7
IL-6 3.1 (1.3-7.3) 0.01
IL-8 3.6 (1.5-8.8) 0.005
IL-10 3.3 (1.4-8.1) 0.007
TNF-α 2.2 (0.95-5.1) 0.06
Covariates Univariate analysis (n = 40)
30
Supplemental Table 4 Comparisons of 10 cytokine concentrations in plasma between Group
1/2 and Group 3/4
Student’s
t test was performed to compare each cytokine value between Group1/2 andGroup 3/4.
VEGF-A 35.6
±21.4 87.0 ± 62.5 0.002 VEGF-C 41.9 ± 26.7 46.0 ± 26.9 0.6 VEGF-D 838.7 ± 208.1 927.2 ± 352.2 0.3
IL-2 0.2 ± 0.1 0.3 ± 0.2 0.4
IL-6 1.9 ± 1.9 5.2 ± 4.7 0.007
IL-8 40.3 ± 89.7 191.9 ± 470.0 0.2
IL-10 0.4 ± 0.2 0.9 ± 1.7 0.2
IFN-γ 12.3 ± 12.2 10.9 ± 11.1
0.7TNF-α 2.6 ± 1.0 3.8 ± 2.9
0.1GM-CSF 0.2 ± 0.1 0.5 ± 1.4
0.3Group 1/2 (n=19)
Group 3/4 (n=21)
mean ± SD (pg/mL)P-value
31 Supplemental figure Legends
Supplemental Figure 1
Gating strategy and representative dot plots for G-MDSCs, DC (A), Treg, NK, Granzyme B+, Perforin+ and Ki-67+ cells (B).
Gr-MDSC, Granulocytic myeloid-derived suppressor cell; DC, dendritic cell; Treg, regulatory T cell; NK, natural killer cell
Supplemental Figure 2
Blood collection was generally performed at pre-treatment (1
st), from 7 to 9 weeks (2
nd)
and 6 months (3
rd) after chemotherapy. Change in each immune cell type over time is
shown in graph (A). The means of %M-MDSC or %T
EMwere compared between before
and after (2
ndor 3
rdblood collection) chemotherapy using a paired-t test.
Based on the change from before chemotherapy to the 2
ndblood sample, patients were
divided into groups that showed an increase or a decrease in each cell type.
Kaplan-Meier curves for PFS of the 2 groups are shown in (B). P value was calculated
by the log-rank test.
32 Supplemental figure
Supplemental figure 1 (A)
(B)
33 Supplemental figure 2
(A)
(B)