DISCUSSION PAPER No.198
日本の多国籍企業における海外研究開発と特許出願
Global Knowledge Flow and Japanese
Multinational Firms’ Offshore R&D Allocation and Patenting
2021 年 7 月
文部科学省 科学技術・学術政策研究所 第 1 研究グループ
伊藤 恵子 池内 健太 大光 太朗
本 DISCUSSION PAPER は、所内での討論に用いるとともに、関係の方々からの御意見を頂く ことを目的に作成したものである。
また、本 DISCUSSION PAPER の内容は、執筆者の見解に基づいてまとめられたものであり、
必ずしも機関の公式の見解を示すものではないことに留意されたい。
The DISCUSSION PAPER series is published for discussion within the National Institute of Science and Technology Policy (NISTEP) as well as receiving comments from the community.
It should be noticed that the opinions in this DISCUSSION PAPER are the sole responsibility of the author(s) and do not necessarily reflect the official views of NISTEP.
【執筆者】
伊藤 恵子 中央大学商学部 教授
池内 健太 経済産業研究所 上席研究員(政策エコノミスト)
文部科学省科学技術・学術政策研究所 客員研究官 大光 太朗 特許庁 情報技術統括室室長補佐
東京工業大学博士課程
【Authors】
ITO Keiko Professor, Faculty of Commerce, Chuo University
IKEUCHI Kenta Senior Fellow (Policy Economist), Research Institute of Economy, Trade and Industry (RIETI)
Affiliated Fellow, National Institute of Science and Technology Policy (NISTEP), MEXT
DAIKO Taro Deputy Director, Information Technology Planning Section, Japan Patent Office
Ph.D. Candidate, Tokyo Institute of Technology
本報告書の引用を行う際には、以下を参考に出典を明記願います。
Please specify reference as the following example when citing this paper.
伊藤恵子・池内健太・大光太朗(2021) 「日本の多国籍企業における海外研究開発と特許出願」,
NISTEP DISCUSSION PAPER,No.198,文部科学省科学技術・学術政策研究所.
DOI: https://doi.org/10.15108/dp198
ITO Keiko, IKEUCHI Kenta, and DAIKO Taro (2021) “Global Knowledge Flow and Japanese Multinational Firms’ Offshore R&D Allocation and Patenting,” NISTEP DISCUSSION PAPER, No.198, National Institute of Science and Technology Policy, Tokyo.
DOI: https://doi.org/10.15108/dp198
日本の多国籍企業における海外研究開発と特許出願
文部科学省 科学技術・学術政策研究所 第1研究グループ
要旨
本稿では、多国籍企業内における国境を越えた研究開発(R&D)活動の配分と R&D 成果との 関係を分析する。より具体的には、R&D成果を特許出願数やその質の指標を用いて計測し、知識 フロー・ネットワークの中心により近い国・産業により多くの R&D を配分することが、多国籍企業の
R&D 成果につながるのかどうかに注目する。我々は、日本の製造業多国籍企業について、本社
企業とその海外現地法人の企業レベルのデータに、各多国籍企業の特許出願状況を接続したデ ータセットを用いる。さらに、世界各国で出願された特許の引用情報を用いて、世界の知識フロー・
ネットワークを可視化し、そこから各国・産業のネットワーク中心性指標を計測する。固有ベクトル中 心性指標を用い、この中心性が高い国・産業ほど、より多くの国・産業と特許の引用・被引用関係 を持ち、世界の知識フロー・ネットワークの中でより中心に近いと解釈する。
本稿の分析によると、知識フロー・ネットワークの中心性が高い国・産業により多くのR&D活動を 配分している多国籍企業ほど、質を考慮した特許出願数が多くなることが確認された。一方、質を 考慮しない特許出願数と、R&Dの配分との間には、統計的に有意な関係は見いだされなかった。
Global Knowledge Flow and Japanese Multinational Firms’ Offshore R&D Allocation and Patenting
First Theory-Oriented Research Group, National Institute of Science and Technology Policy (NISTEP), MEXT
ABSTRACT
This paper examines whether allocating more research and development (R&D) activities to a country-industry pair with a higher intensity of knowledge flows improves the innovation performance of multinational enterprises (MNEs). We use the number of patent applications as a proxy for innovation outcome and construct firm-patent-matched data for Japanese manufacturing MNEs, including data on MNEs’ offshore R&D expenditure and information on patents filed by both parent firms and overseas affiliates. Moreover, as a proxy for the intensity of knowledge flows, we use the eigenvector centrality of each country- industry pair in the global knowledge flow network, utilizing patent citation information.
We find that the quality-adjusted number of patent applications tends to be higher for MNEs that allocate more R&D activities to country-industry pairs that are more central in the network of global knowledge flows. However, we did not find any significant relationship between the country and industry distribution of offshore R&D and the number of patent applications.
[空白のページ]
1
概要
2 1.研究の背景と目的
1990 年代以降、世界的に生産工程の国際分業(フラグメンテーション)が進展し 、多くの 企業が生産工程のオフショアリング(自社の海外拠点で実施ないし海外の他社に委託するこ と)を拡大してきた。フ ラグメンテーションの進展において日本の多国籍企業も含め、国境を 越えて事業展開する多国籍企業が重要な役割を果たしてきた。多国籍企業の生産活動と比 べると 、研究開発(R&D)活動は国境を越えて分散させずに本社近隣で集中的に行わ れる 傾向が強いものの、近年は R&D活動のオフショアリングも増加してきている。
先進国の多国籍企業にとって、学術・研究水準が高い本国でR&D活動を集中的に行うこ とは、範囲の経済も働い て新技術を生みだし やすく、技術流出を 防ぐと いう面でも 利点があ る。一方、海外で R&D 活動を行うことによる利点も指摘されてきた。例えば、企業の持つ既 存 の 技 術 に 基 づ い て 、 現 地 消 費 者 の ニ ー ズ や 嗜 好 に 合 わ せ た 製 品 開 発 ・ 改 良 を 行 う
(home-base-exploiting R&D:本国の技術を使って現地市場を開拓)ことにより現地市場で
優位に立つことが可能になるかもしれない。また、現地のさまざまな研究資源を活用すること に よっ て 新し い 技 術の 獲得 が促進 され る(home-base-augmenting R&D: 本国 の技 術 の補 強)ことも期待できる 。これらの利点に着目し、多くの先行研究においてR&Dのオフショアリ ングに関して、その決定要因や効果が分析されてきた。
実際に、多くの先行研究が R&D オフショアリングと R&D成果との間に正の関係を見出し ており、オフショアリングによって企業はホスト国の技術知識に触れ、自らの競争力を高めて いることが示唆される。そして、多国籍企業は、ホスト国の属性に従って、さまざまなタイプの
R&D(先行研究では開発・設計型と基礎・応用研究型の 2 タイプに分けられることが多い)を
異なるホスト国で実施している。しかし、これまでの研究では、多国籍企業が R&D 活動を自 社の拠点間でどのように配分しているか、そして、その配分によって多国籍企業全体のR&D 成果がどう異なるかはほとんど分析されてこなかった。
一方、日本の多国籍企業も、海外拠点での R&Dを増加させてきたが、その成果の指標の 一つとして特許出願数をみると、2000 年代半ば以降減少傾向にある。日本企業は、他の先 進国と比べても依然とし て活発に特許の出願・登録を行っているものの、近年は、中国や韓 国など のアジア企業から猛烈な追い 上げを受けている。1990 年代初頭には米国特許商標
庁(USPTO)への出願数上位に日本企業が数多く名を連ねていたものの、近年は、ほとんど
の日本企業が上位ランキングから姿を消している。
そ こ で 本 稿 で は 、 日 本 の 多 国 籍 企 業 の デ ー タ を 用 い て 、R&D の 国 境 を 越 え た 配 分 と
R&D 成果と の関係に焦点を 当てる。具体的には、特許の出願数や質を考慮し た出願数で
R&D 成果を測り、より知識フローの集約度の高い国・産業により多くの R&D 活動を配分す
ること が、多国籍企業全体の特許出願を 活発にするのかを 分析する。知識フ ローの集約度 が高く、技術知識のスピルオーバーをより多く受けやすい場所により多くの R&D活動を配分 する企業は、自社の技術力を向上させ、より多くの質の高い成果を上げると期待される。
2.利用したデータ
本稿の分析に用いるのは 経済産業省「企業活動基本調査」の企業の調査票情報、「海外 事業活動基本調査』の本社企業及び海外現地法人の調査票情報 、そして、知的財産研究
3
所 が 整 備 し 公 開 し て い る IIP パ テ ン ト デ ー タ ベ ー ス と 欧 州 特 許 庁 (EPO) が 整 備 す る
PATSTAT に収録された特許の情報である。多国籍企業の日本本社の企業情報を「企業活
動基本調査』から抽出し、まず本社レベルの年次パネルデータを作成する。そこに、「海外事 業活動基本調査』に収録された海外現地法人情報を接合する。さらに、「企業活動基本調査』
に収録された企業情報と、特許データ(PATSTAT及び IIP パテントデータベース)に収録さ れた各特許の出願人を接合する。そして、多国籍企業の本社が日本国特許庁(JPO)に出願 した特許と、多国籍企業の海外現地法人が JPO を含む世界の特許庁に出願した特許を特 定する。しかしながら、日本の本社企業が JPO 以外にも特許を出願(国際出願)している可 能性があり、また本社と海外現地法人が共同で出願するケースもある。そこで、PATSTATに 収録された特許ファミリー情報を用いて、本社企業が国際出願した特許を識別し、同一特許 を複数国の特許庁に出願しているような重複を 除いている。さらに、本社と現地法人の共同 出願のような重複も除き、各多国籍企業の特許出願数を特許ファミリー・レベルで集計して、
多国籍企業の R&D 成果の代理変数とする。本稿では、日本の本社が製造業に分類され、
かつ 1社以上の海外現地法人を持つ多国籍企業を対象とし、1995年~2011年の期間につ いて、本社、海外現地法人、出願特許の情報を接合したデータセットを分析に利用する。
また、特許の質を考慮した出願数を計測するため、OECD Patent Quality Databaseに収 録されている、さまざまな特許の質指標を利用する。OECD Patent Quality Databaseには、
EPOか USPTOに出願された各特許について、15種類の質指標を計測したものが収録され
ている。そのう ち、多くの先行研究において被引用数が特許の質指標と して利用されてい る ことから、公開 5 年後ま での被引用件数を質指標として利用する。そ のほかに、generality
( 技 術 の 汎 用 性 ) 、originality( 技 術 の 独 創 性 ) 、radicalness( 技 術 の 革 新 性 ) と 2 種 類 の
quality index(複数の質指標を合成して作成したインデックス)とを利用する。これら質指標
をウェイトとして、各多国籍企業について質を考慮した特許出願数を計測し、これも R&D 成 果の代理変数として利用する。
一方、本稿においては、世界各国・産業の知識フローの集約度が重要な変数である。世界 の知識フロー・ネットワークにおける各国・産業の相対的な位置を示す指標を計測し、それを 知識フローの集約度の代理変数として用いる。ある人や企業が生み出した技術や知識が他 の人や企業に吸収され たときに知識フ ローが発生するので あり、知識フ ロー・ネッ トワークの 中心に近い場所では、ネットワーク内の他社から吸収したさまざまな知識が蓄積され、また他 社が吸収したいと思うような先端的な知識が生まれていると想定される。本稿では、国境を越 えた知識フローに焦点を当て、外国で出願された特許との引用・被引用関係を、国や産業を 越え た知識フ ローと 考え る。国・産業間の知識フ ロー・ネ ッ トワーク の固有ベク トル中心性を 計測し、それをネットワーク内における相対的位置の指標として用いる。固有ベクトル中心性 は、各国・産業内の知識ストックの大きさだけでなく、他の国・産業とどれだけ強く結びついて いるかも反映した指標となっている。
3.分析方法
本稿では、まず、日本の製造業多国籍企業の海外 R&D の規模や分布、そして、特許出 願数や質を考慮した出願数の推移などを概観する。そして、知識生産関数を推定することに
4
よって、各多国籍企業の R&D 成果の決定要因を分析する。R&D 成果に影響を与える要因
として、R&D 支出規模や R&D オフショアリングの比率、そして、企業規模や生産のオフショ
アリングの規模を考慮する。ただし、最も注目するのは、多国籍企業内における R&Dオフシ ョアリングの配分である。各国・産業の知識フロー・ネットワークにおける中心性を、各多国籍
企業の R&D 支出シェアで加重平均することにより、各企業が知識ネットワークのより中心に
近い国・産業により多くの R&Dを配分しているかどうかを示す変数を作成する。もし、その変
数がR&D成果と正の関係にあれば、知識ネットワーク中心性の高いところにより多くのR&D
を配分すること が、より多くの技術知識スピ ルオーバーを 受け、より大きな成果につながると 解釈される。また、R&Dの配分と R&D成果との間の因果関係を捉えるため、米国多国籍企
業の R&D オフショアリングのデータを利用して操作変数を作成し、操作変数法での推定も
行う。
4.分析結果
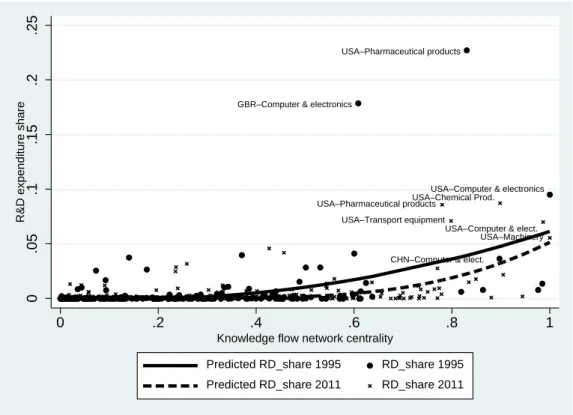
まず、日本の製造業多国籍企業の R&D オフショアリングとその分布、また特許出願状況 をみる。国内経済の長期的な停滞を反映してか、本社でのR&D支出合計は1995年~2011 年の期間で 1.5 倍にしか増えていない一方、海外現地法人における R&D 支出合計は同期 間に3.3倍に増えている。2000年代半ば以降、特に在中国現地法人の R&D支出が増えて いるものの、海外 R&D支出の 50%近くは北米であり、欧州も 30%近くを占めるなど、依然と して欧米に集中している。概要図表 1 は、横軸に各国・産業の知識フロー・ネットワーク中心 性をとり、縦軸に製造業多国籍企業の海外 R&D 支出合計に占める各国・産業のシェアをと って、両者の関係を 1995 年と 2011 年についてみたものである。ここから、ネットワーク中心 性の高い 、い くつかの国・産業(例えば、米国の医薬品やコンピ ュータ・エレクトロニクス 、化 学、機械産業など)に R&D が集中する傾向が見て取れる。しかし、ネットワーク中心性が比 較的高いにもかかわらず、日本の多国籍企業がほとんど R&D を行っていない国・産業も多 く存在していることも分かる。
5
概要図表 1:知識フロー・ネットワーク中心性と、日本の製造業多国籍企業の R&D オフショ アリング
一方、日本の製造業多国籍企業の特許出願数は 2000 年代半ばから減少傾向にある。
EPO や USPTO への出願数は減少傾向ではないものの、2000 年代半ばから増加しておら
ずほぼ横ばいである。上述の OECD Patent Quality Database の指標を用いて、EPO や
USPTO に出願された特許の質でウェイト付けした出願数(1 社あたり)の推移をみたのが概
要図表 2 である。どの指標でみても、2000 年代初めごろまでは質を考慮した出願数が増え ているようにみえるが、2000 年代半ばごろから少しずつ低下傾向である。特に、被引用数を みると、2000年代初めから低下が続いている。
概要図表 2:質を考慮した 1 社あたり特許出願数平均値の推移(EPO/USPTO に出願して いる特許のみ)
GBR–Computer & electronics
USA–Pharmaceutical products
USA–Computer & electronics
CHN–Computer & elect.
USA–Chemical Prod.
USA–Pharmaceutical products
USA–Computer & elect.
USA–Machinery USA–Transport equipment
0.05.1.15.2.25R&D expenditure share
0 .2 .4 .6 .8 1
Knowledge flow network centrality Predicted RD_share 1995 RD_share 1995 Predicted RD_share 2011 RD_share 2011
0 100 200 300 400 500 600 700 800 900 1,000
0 10 20 30 40 50 60
EPO/USPTO applications per firm Generality
Originality Radicalness
Quality index (4) Quality index (6)
Forward citations (right axis)
6
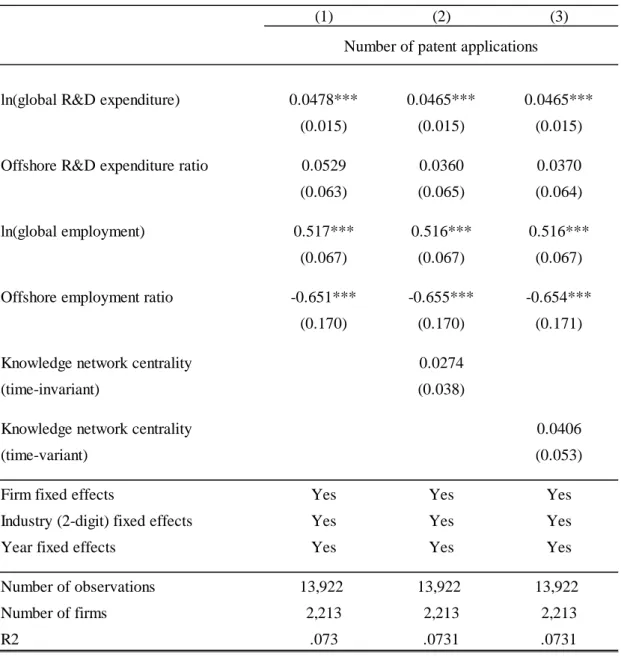
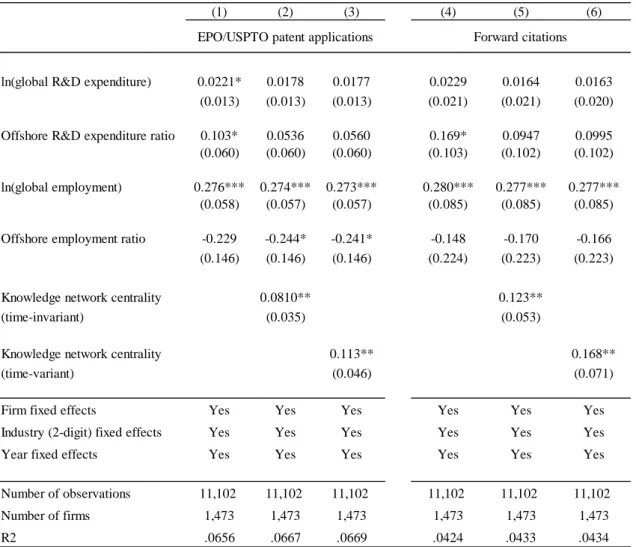
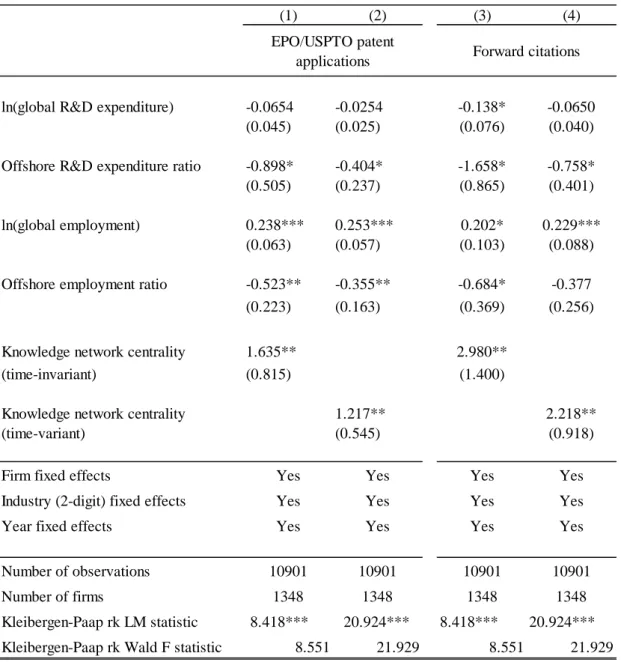
最後に、知識生産関数を推定した結果、どの国・産業に R&Dをより多く配分するかは、質 を考慮した特許出願数と強い正の関係があることが分かった。つまり、知識フロー・ネットワー ク中心性の高い国・産業により多くの R&D を配分している多国籍企業ほど、質の高い特許 をより多く出願している傾向が見いだされた。一方、企業全体の R&D 支出と(質を考慮しな い)特許出願数との間には正の相関関係があり、R&D 規模が大きいほど特許出願数は多い 傾向はある。しかし、EPOやUSPTOに出願し、かつ多く引用されるような質の高い特許の出
願には、R&D 規模よりもR&D の国・産業間の配分が重要であることを示す結果を得た。
5.結論と政策的含意
本稿の分析の結果、より質の高い R&D 成果を生み出すには、知識フロー・ネットワーク中 心性の高い国・産業により多くの R&D を配分することが重要であるという示唆を得た。知識 フロー・ネットワークの中心に近い場所では、さまざまな国・産業との間で知識が活発に交換 され、より多くのさまざまな知識のスピルオーバーを受けやすいと想定される。このような場所 でより重点的に R&D活動を行うことが、質の高い成果に繋がるといえよう。
しかし、実際の日本の製造業多国籍企業の海外 R&D支出のデータを見てみると、必ずし もそういった国・地域へ R&D が十分にシフトしているとはいえない。1995~2011 年の期間 に知識フロー・ネットワーク中心性が大きく上昇したのは、中国やインド、韓国、台湾などの産 業が多い。日本の製造業多国籍企業は、コンピ ュータ・エレクトロニクス産業など、中国では
R&D を大きく増加させている。しかし、その他のアジア諸国の産業を見ると、ネットワーク中
心性の高い国・産業で R&D が大きく増加しているとはいえない。例えば、米国の多国籍企 業は、これら 4つの国・地域での製造業の R&D支出を 1995~2011年の期間に 27.5倍に 増加させている。一方、同期間に日本の製造業多国籍企業の当該国・地域での R&D 支出 は 7.5 倍にしかなっていない。日本企業としては、急速に技術水準が向上し、世界の知識フ ロー・ネットワークの中心にシフトしてきている国・産業へ、より多くの R&D を配分するなど、
より望ましい R&D配分を目指していくことが求められる。特に、質の高いR&D成果を得るた めには、知識フロー・ネットワークのハブに近い場所で、より多くの技術知識を吸収することが 重要である。ただし、今後の R&D 活動の展開に際しては,知的財産権保護の問題や、また 地政学リスク等も考慮する必要もあるだろう。
7
本文
8 1. Introduction
Over the past few decades, production processes have become increasingly fragmented and dispersed across borders, and multinational enterprises (MNEs), including Japanese MNEs, have played an important role in the expansion and deepening of the international division of labor.
MNEs unbundle production processes and relocate them to offshore locations taking the comparative advantages of each location into account, and such MNEs show much better performance than domestic firms in terms of their size, productivity, profitability, and managerial and human resources. Although MNEs tend to retain research and development (R&D) activities close to their headquarters, a growing number of MNEs have offshored R&D activities to foreign locations (see, e.g., UNCTAD, 2005; OECD, 2010; Belderbos et al., 2016; Iversen et al., 2017).
Offshore R&D activities are expected to contribute to technological development to support local production and product development tailored to the local market (home-base-exploiting R&D). Offshore R&D activities may also promote development of new technologies by utilizing researchers, research institutes, and various other science and technology-related resources abroad (home-base-augmenting R&D).1 Given these potential benefits of R&D offshoring, previous studies have investigated the determinants and effects of offshore R&D, examining, for example, (1) what firm and location characteristics are important as determinants of offshore R&D and whether the determinants differ depending on the type/purpose of offshore R&D; (2) whether offshore R&D contributes to firms’ technological development measured by patents or productivity; and (3) what firm and location characteristics are associated with successful offshore R&D.
Regarding the determinants of offshore R&D, Shimizutani and Todo (2008), Ito and Wakasugi (2008), and Belderbos et al., (2016), for example, show that the technological capabilities of host regions/countries are an important factor, particularly for home-base- augmenting offshore R&D. As for the effects of R&D offshoring, Todo and Shimizutani (2008) and Castellani and Pieri (2013) show that R&D offshoring is likely to improve productivity at home, while other studies find that firms with active R&D offshoring tend to file for more patents (e.g., Almeida and Phene, 2004; Iwasa and Odagiri, 2004; Rahko, 2016; Belderbos et al., 2016;
Yamashita and Yamauchi, 2019). Furthermore, studies such as Almeida and Phene (2004) and Iwasa and Odagiri (2004) take technological characteristics (the former focus on technological diversity while the latter focus on technological strength) of host regions/countries into account and find that MNEs tend to be more innovative in host regions/countries with higher technological capabilities, suggesting that offshoring firms take advantage of R&D resources in host
1 See, for example, Kuemmerle (1997) and Thursby and Thursby (2006).
9
regions/countries. Offshoring firms are not only able to directly employ local researchers but also learn from other technologically advanced firms, local science communities, and so on. In other words, firms are more likely to receive knowledge spillovers by offshoring in such places.
In fact, a large number of studies have found a positive relationship between R&D offshoring and innovation, suggesting that offshoring is likely to allow innovating firms to tap into the technological capabilities of host countries and improve their competitive advantage. However, the literature has devoted scant attention to the impact of R&D allocation across overseas affiliates within MNEs on their innovation performance.2 As highlighted by Shimizutani and Todo (2008) and Belderbos et al. (2016), MNEs do allocate different types of R&D activities (which are usually divided into two types: development and design on the one hand and basic/applied research on the other) to affiliates in different host countries based on host country characteristics.
Therefore, our particular question in this paper is to what extent the regional distribution of offshore R&D affects MNEs’ innovation performance. More specifically, we examine whether allocating more R&D activities to a country-industry pair with a higher intensity of knowledge flows improves the innovation performance of the MNE as a whole. As mentioned above, firms are likely to receive more knowledge spillovers in places with abundant R&D resources. We expect that MNEs allocating more R&D activities to places where they receive more knowledge spillovers are more likely to develop/upgrade their own technological capabilities and become more innovative.
This study is novel in at least two respects. First, we focus on the allocation of offshore R&D across host countries and industries within MNEs. Among existing studies, the one that probably comes closest to the question we are interested in is a recent study by Yamashita and Yamauchi (2019), who, focusing on Japanese manufacturing MNEs, examine the effect of offshore R&D on patenting at home, grouping offshore R&D into that in developed and in developing host countries.
Using the data on patents registered at the Japan Patent Office (JPO), they find that offshore R&D in developed host countries increases the quality of patents but does not have any impact on the number of patents. Although Yamashita and Yamauchi’s (2019) results suggest that where MNEs locate innovative activities is potentially an important determinant of innovation, and especially high-quality innovation, they do not examine the allocation of offshore R&D across developed and developing host countries within MNEs.
2 For example, Almeida and Phene (2004) focus on patent applications by US semiconductor MNEs’
overseas subsidiaries and the characteristics of each subsidiary’s host country. Rahko (2016) does not take host country factors into account. Iwasa and Odagiri (2004) focus on Japanese MNEs’ subsidiaries in the United States only. These studies do not focus on geographical distribution of R&D across countries within MNEs.
10
Second, we measure the relative position within the global knowledge flow network for each country-industry pair in the world and use the measure as a proxy for the knowledge flow intensity.
As knowledge flows occur when an idea generated by somebody is absorbed by others, places closer to the center of a knowledge flow network are more likely to accumulate various kinds of knowledge learned from others in the network and generate more advanced knowledge which others want to learn. Moreover, this study uses international knowledge flows, not intra-country knowledge flows, because knowledge flows across countries are expected to be of higher quality and more advanced. In addition, we focus on innovation activities by MNEs and expect that MNEs want to learn and incorporate world-class technology. Therefore, we use international patent citations as a proxy for knowledge flows across countries and industries and construct measures for the network of global knowledge flows.3 Previous studies that take the knowledge stock of neighboring industries, regions, and/or countries into account often use the weighted average of the knowledge stock in a particular industry, region, and/or country using the technological or geographical distance or size of trade flows as weights.4 However, we try to measure the knowledge flows across countries and industries more directly by using patent citation information, not using geographical distance or trade flows. We employ the eigenvector centrality of the network of international and inter-industry knowledge flows, which reflects the influence of country-industry pairs in the network. The centrality measure reflects not only the size of the cumulative knowledge stock in each country-industry pair but also how strongly a country-industry pair is connected to other country-industry pairs in the network of global knowledge flows.5
3 Many studies use patent citation information as a measure of knowledge flows (see, e.g., Peri, 2005).
4 Many studies use the intensity or stock of R&D expenditures as a proxy for the local knowledge stock or various indicators of human capital and science and technology resources. Other studies estimate the local knowledge stock using the cumulative number of patents (e.g., Almeida and Phene, 2004; Iwasa and Odagiri, 2004). Meanwhile, Almeida and Phene (2004) also employ a technological diversity index for each host country, calculated using patent data. Iwasa and Odagiri (2004) construct a measure of knowledge stock of a particular state in the United States by adding its own stock to the geographical-distance-weighted average of knowledge stock of all other states. Meanwhile, the seminal empirical study on international R&D spillovers by Coe and Helpman (1995) measures the foreign R&D stock as the import-share-weighted average of the domestic R&D stock of trade partners.
5 There is a growing number of studies in the field of economics using network centrality measures as a proxy for the strength and diversity of linkages in a network. Such measures have been used to examine, for example, the propagation of economic shocks or the dissemination of information across countries, industries, and firms (see, e.g., Acemoglu et al., 2016; Carvalho, 2014; Ito et al., 2019; Iino et al., 2021).
11
In this study, we construct a dataset for Japanese manufacturing MNEs for the period 1995–
2011 in which we match data on parent firms, their affiliates, and patents. Using the number of patent applications and the quality-adjusted number of applications by these MNEs as a proxy for innovation outcomes, we examine whether MNEs allocating more R&D activities to countries and industries with higher centrality in the knowledge network tend to show better innovation performance.6
Our findings suggest that allocating more R&D activities to more central countries and industries in the knowledge network leads to higher quality innovation as measured by the quality- adjusted number of patent applications, a proxy for R&D outcomes. However, we do not find any significant relationship between the country and industry distribution of offshore R&D and the number of patent applications. On the other hand, we find that the size of R&D expenditure tends to be positively associated with the number of patent applications but does not have a positive relationship with the quality adjusted number of patent applications. Therefore, our results suggest that while an increase in MNEs’ R&D expenditure is likely to increase the number of patent applications, where they locate R&D is a more important determinant of the quality of innovation than the amount of R&D expenditure.
The remainder of the study is organized as follows. Section 2 describes the dataset used and explains our various measures of innovation outcomes and knowledge flows. Section 3 provides an overview of recent trends and patterns in the overseas R&D and patenting of Japanese MNEs and highlights some notable characteristics. Next, Section 4 presents the empirical model and the results. Finally, Section 5 concludes.
6 Of course, patents are not perfect to measure innovation outcomes. Not all inventions are patented and many of the patents are not used to introduce new products in the market. In the Oslo Manual, which is the foremost international source of guidelines for the collection and use of data on innovation activities in industry, innovation is defined as a new or improved product or process that differs significantly from the unit’s previous products or processes (OECD/Eurostat 2018). Obviously, patents only partially measure outcomes of innovation activities, and we should be aware of the limitations of patent statistics. Patents, however, are often used as a proxy for innovation in academic studies partly due to the difficulty of measuring innovation and to the availability of rich and detailed patent statistics. In fact, the NISTEP conducts the National Innovation Survey and investigates the trends of Japanese firms’ innovation activities, employing the definition of innovation in the Oslo Manual. Although the information on new or improved products or processes collected following the Oslo Manual is very useful, it is still imperfect to measure the volume and/or quality of innovation. In any case, it is a difficult and challenging task to measure the degree of technological innovation.
12 2. Data
2.1 Firm-Patent-Matched Data
We start by constructing a dataset of Japanese manufacturing MNEs matching parent firms with their affiliates spanning the period from 1995 to 2011. Specifically, we construct a panel dataset for parent firms from the “Basic Survey of Japanese Business Structure and Activities (BSJBSA).” We then link information on overseas affiliates taken from the “Basic Survey on Overseas Business Activities (BSOBA)” to the parent-level panel data.7 Both surveys are conducted annually by the Ministry of Economy, Trade and Industry of Japan. Although both surveys cover firms in some non-manufacturing industries, we limit our analysis to MNEs whose parent firms are classified into the manufacturing sector, since manufacturing sector firms account for the vast majority of patents and firms reporting positive R&D expenditures.8 Further, we focus on MNEs that own at least one overseas affiliate and whose Japanese headquarters are classified into the manufacturing sector.
Next, we match patents and patent applicants with the firm-level data on MNEs using the names and addresses of parent firms and their overseas affiliates. We take patent data from two patent databases. One is the IIP Patent Database compiled by the Institute of Intellectual Property
7 The BSOBA covers the following overseas affiliates: 1) a foreign affiliate in which a Japanese corporation has invested capital of 10% or more; 2) a foreign affiliate in which a “subsidiary,” funded more than 50%
by a Japanese corporation, has invested capital of more than 50%; and 3) a foreign affiliate in which a Japanese corporation and a subsidiary funded more than 50% by a Japanese corporation have invested capital of more than 50%. Therefore, cases in which joint R&D is conducted through capital tie-ups with foreign companies are captured in the survey if the capital participation rate is high to some extent. However, we should note that capital tie-ups and/or business partnerships with a low capital participation rate are not surveyed and we do not take such types of offshore R&D into account in this study.
8 Firms may acquire or take a stake in a foreign firm in order to acquire existing technology owned by the foreign company, i.e., R&D/knowledge stock of the foreign company. However, such acquisition or capital participation is out of scope of this current study. In this study, we focus on newly invested R&D expenditure at foreign affiliates after acquisition or establishment of the affiliates, assuming that the size of newly invested R&D expenditure will affect the ability to absorb knowledge from overseas. Nevertheless, we should note that acquiring or participating in a foreign firm for the purpose of acquiring existing technology owned by the firm is becoming more important as a technology strategy, and this is an issue that needs further scrutiny in future research.
13
(IIP), which covers all patents filed with the JPO.9 The other is PATSTAT, which is compiled by the European Patent Office (EPO) and covers patents filed with all patent offices in the world.
Although PATSTAT includes patents filed with the JPO as well, patent applicants’ name and address are recorded in the Latin alphabet. On the other hand, in the IIP Patent Database, patent applicants’ name and address are recorded in Japanese. Moreover, while PATSTAT assigns a patent family identification code to each patent, the IIP Patent Database does not provide a patent family identification code. Therefore, in order to identify patents filed by Japanese parent firms, we match the applicants’ name and address in Japanese in the IIP Patent Database with those in the firm-level dataset taken from the BSJSBA, which does not provide firms’ name and address in the Latin alphabet. On the other hand, in order to identify patents filed by the overseas affiliates of Japanese MNEs, we match patent applicants’ name and address in the Latin alphabet in PATSTAT with those in the affiliate-level dataset taken from the BSOBA, which provides affiliates’ name and address in the Latin alphabet but not in Japanese. Furthermore, in order to identify which patents belong to the same patent family, we link information on patents filed with the JPO, which are recorded in the IIP Database, with information recorded in PATSTAT using the application number for each patent.
Utilizing both the IIP Patent Database and PATSTAT, we construct a patent dataset that covers almost all the patents filed by the Japanese firms surveyed in the BSJBSA and their overseas affiliates surveyed in the BSOBA. However, our patent dataset does not cover patents filed by Japanese parent firms with overseas patent offices but not with the JPO, because it is difficult to match applicants’ names (in the Latin alphabet) recorded in PATSTAT with the parent firms’ names (in Japanese) recorded in the BSJBSA.10
In addition, Japanese firms sometimes file patents with both the JPO and overseas patent offices (international applications). We therefore use patent family information, i.e., the patent family identification code, provided in PATSTAT and identify patents filed internationally. Using the patent family information, we eliminate duplicate patent filings, i.e., cases where the same patent is filed with more than one patent office in multiple countries.11 In other words, we count
9 The IIP Patent Database is available from the IIP website (https://www.iip.or.jp/e/patentdb/index.html).
For details on the IIP Patent Data, see, e.g., Goto and Motohashi (2007) and Nakamura and the Patent Database Steering Committee of the Institute of Intellectual Property (2020).
10 We assume that such cases are very rare and that most Japanese firms apply for patents with the JPO.
11 As mentioned already, we use the number of patent applications by each MNE as a proxy for innovation outcomes. We aggregate the total number of patent applications to the firm-year level using the first application year.
14
the number of patent applications worldwide at the patent-family level by Japanese manufacturing MNEs, consisting of applications by both the headquarters and overseas affiliates.12
2.2 Patent quality indices
While measuring the quality of patents in a rigorous quantitative manner is not easy, Squicciarini et al. (2013) propose a variety of indicators to evaluate the quality and characteristics of patents. The OECD calculates these quality indicators for each patent application filed with the EPO and the United States Patent and Trademark Office (USPTO) and publishes these in the OECD Patent Quality Indicators Database. We use the indicators from the OECD Patent Quality Indicators Database 2019 and measure the quality-adjusted number of patent applications (at the patent family level) for each Japanese manufacturing MNE for each year. The OECD Patent Database contains 15 quality indicators, of which we use six. Specifically, the indicators we use are: (1) forward citations, (2) generality, (3) originality, (4) radicalness, and two composite quality indices, namely (5) a quality index based on four components and (6) one based on six components. The forward citation measure is the number of citations received up to 5 years after publication. We use forward citations since this is a measure that has been widely used as a proxy for patent quality in preceding studies. All the other indicators we use are defined so that they take values between 0 and 1. Brief definitions of these six indicators are provided in Appendix B.
The OECD patent quality indicators are constructed such that a higher indicator value represents higher patent quality.
One unavoidable limitation is that these indicators are only measured for patents filed with the EPO and/or USPTO and are not available for patents filed with the JPO only.13 However, the fact that Japanese firms have filed patent applications with the EPO and/or USPTO itself can be regarded as an indicator of patent quality, since firms are likely to file patent applications with overseas patent offices, particularly the EPO and USPTO, only when they regard an innovation as important and of high quality.14 At the patent family level, we can measure the quality of a
12 Appendix Figure 1 provides an illustration of the types of patent applications examined in this study.
13 According to some OECD researchers, it is difficult to construct rigorous quality indicators for patents filed with the JPO because, unlike patents filed with the EPO and USPTO, patents filed with the JPO do not have comprehensive inventor citation information. The JPO did not require inventors to report patents and other technological information the inventor cited until the early 2000s.
14 The patents filed with a national/regional patent office or WIPO (World Intellectual Property Organization) through the Patent Cooperation Treaty (PCT) route are included in the OECD Patent Quality Database in the cases where the patents entered the PCT national phase and were examined by the
15
patent family if at least one of the patents in the same patent family is filed with the EPO USPTO.
In cases where patents in the same patent family are filed with both the EPO and USPTO, two sets of quality indicators are available, i.e., those based on the EPO patent data and those based on the USPTO patent data. For such cases, except in the case of forward citations, we use the average value of the quality indicators based on the EPO and USPTO data as the quality measure for the patent family. For forward citations, we use the sum of citations received based on the EPO patent data and the USPTO patent data.
2.3 The centrality index for the network of global knowledge flows
The key question of this study is whether allocating more offshore R&D activities to central areas of the network of global knowledge flows improves innovation performance. For this purpose, we need to define the network of global knowledge flows and identify country-industry pairs that are central hubs and those that are peripheral in the network. While there are various ways to measure knowledge flows, we estimate global knowledge flows using patent citations.15 We start by taking the citations information for all the patents filed worldwide during the period 1995–2011 from PATSTAT and compile the citations information at the patent family level. In order to exclude low-quality patents, we use only patents that were filed with at least two patent offices. Next, by mapping the International Patent Classification (IPC) to the International Standard Industrial Classification (ISIC), we classify each patent family into one of the two-digit level industries defined in ISIC Revision 4.16 We then calculate the number of patents for each country-industry pair for each filing year. In cases where the technology domain of a patent falls into more than one IPC subclass and/or a patent application is filed by multiple applicants residing in different countries, we use the fractional count of patents, that is, the share of each IPC subclass and applicant country.
In order to measure knowledge flows across industries and countries, we count how many citations a patent received from each country-industry pair in each year (forward citations). We
EPO/USPTO. Therefore, in this study, we cover both patents filed with the EPO/USPTO directly by Japanese MNEs and patents filed with the EPO/USPTO through the PCT route.
15 In previous studies, knowledge flows have often been proxied by flows of goods and services using, for example, inter-firm transactions, cross-border trade flows, or input-output relationships across industries, based on the assumption that knowledge is embodied in goods and services. On the other hand, there are also an increasing number of studies that use patent citations to measure knowledge flows more directly (e.g., Peri, 2005).
16 We utilize the concordance table between the IPC subclass codes and the NACE Rev.2 two-digit codes provided by Van Looy et al. (2014).
16
count the number of forward citations received up to 5 years after a patent was filed. In the PATSTAT database that we use, reliable forward citation information is available up to 2016, so that the last year for which we can calculate the knowledge flow network measures is 2011. The global knowledge flow network can be constructed for each year with nodes (vertices) representing country-industry pairs and edges (branches) representing the number of citations between pairs. From the network for each year, we calculate the network centrality for each country-industry pair for each year. There are several types of network centrality measures, and the measure we use is the eigenvector centrality. Eigenvector centrality is a network index that takes into account the weighted sum of direct and indirect connections. That is, eigenvector centrality is determined not only based on how many citations own country-industry patents receive from other country-industry nodes but also on how many citations the citing country- industry’s patents receive, i.e., the centrality of citing country-industry pairs is reflected in the own country-industry centrality.17 Therefore, country-industry pairs with a high number of direct and indirect connections (what we call “hubs”) should have a high network centrality, and we use the centrality measure to reflect the relative position of each country-industry pair within the global knowledge flow network. In other words, centrality is higher for country-industry pairs that are more central in the network.
It should be noted that for small countries and industries where the number of patent applications is relatively small, the network centrality measure tends to fluctuate substantially from year to year, which may not necessarily reflect true changes in the relative position in the global knowledge flow network. We therefore also calculate the time-invariant centrality for the whole period 1995–2011 for each country-industry pair based on all the patent citation relationships for the period from 1995 to 2016. In the following analysis, we use both the time- variant and the time-invariant values of the network centrality indicator to ensure that our results are robust.
3. Overview of R&D activities and patent applications by Japanese manufacturing MNEs
3.1 Offshore R&D by Japanese manufacturing MNEs
17 While we use the centrality measure calculated without considering the direction of citations among country-industry pairs, to ensure the robustness of our results we also calculated the centrality measure taking the direction of citations into account. The correlation coefficient between the two centrality measures was over 0.9, suggesting that our results would likely remain unchanged if we were to take the direction of citations into account.
17
As described above, we construct a firm-patent-matched dataset for Japanese manufacturing MNEs, combining three micro-data sources: (1) data on parent firms’ onshore activities, (2) data on affiliates’ offshore activities, and (3) information on patent applications to Japanese and overseas patent offices by parents and their overseas affiliates. As shown in Table 1, in our dataset, the number of overseas affiliates increased from 4,930 in 1995 to 10,666 in 2011, while the number of matched parent firms also increased, from 798 in 1995 to 2,190 in 2011. Meanwhile, although the total R&D expenditure of overseas affiliates increased 3.3 times from 1995 to 2011 (column A in Table 1), the offshore R&D share was still very low, showing that Japanese manufacturing MNEs’ R&D activities are highly concentrated in parent firms.
INSERT Table 1
Next, Figure 1 shows the regional distribution of the offshore R&D expenditure of Japanese manufacturing MNEs. As expected, North America and Europe account for the largest shares, but China’s share has grown considerably since the mid-2000s. Nevertheless, in 2011, North America and Europe still made up nearly 50% and 30% of total offshore R&D expenditure, respectively.
While these observations suggest that Japanese manufacturing MNEs’ R&D activities are still concentrated at home and in developed countries and that the scale of offshore R&D is very limited, offshore R&D expenditure has been growing at a much higher rate than onshore R&D expenditure (column B in Table 1 shows that onshore R&D expenditure increased only 1.5 times from 1995 to 2011).
INSERT Figure 1
3.2 Knowledge flow network centrality and Japanese MNEs’ offshore R&D
Next, we look at the levels and changes in the calculated network centrality for each country- industry pair in the world. Industries in developed countries such as the United States, Japan, Germany, and the United Kingdom tend to have a higher centrality, suggesting that these country- industry pairs are more central country-industry pairs in the global knowledge flow network.
Moreover, the computer and electronics industry as well as the machinery industry in East Asian countries such as Korea, China, and Taiwan, also have a high centrality, suggesting that they are also central industries in the global knowledge flow network.18
18 Appendix Figure 2 shows the top 50 country-industry pairs in terms of the time-invariant network centrality for the observation period overall.
18
Next, Figure 2 shows the country-industry distribution of Japanese manufacturing MNEs’
R&D expenditure and the knowledge flow network centrality for each country-industry pair in 1995 and 2011. We calculate the share of each country-industry pair in the total offshore R&D expenditure by Japanese manufacturing MNEs, and the vertical axis of Figure 2 represents the share. Japanese MNEs’ offshore R&D tends to be concentrated in country-industry pairs with a high centrality such as the pharmaceutical, computer and electronics, chemical, and machinery industries in the United States. However, the R&D share is very low in most country-industry pairs even though their centrality is relatively high, suggesting that Japanese MNEs do not allocate much R&D activities to many country-industry pairs with a relatively high centrality.
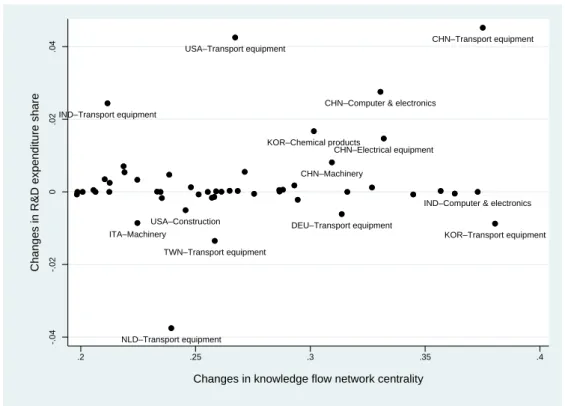
Looking at changes in centrality from 1995 to 2011, industries such as the electrical equipment, transport equipment, computer and electronics, chemical products, and machinery industries tend to show a larger increase in centrality, particularly in East Asian countries such as Korea, China, and Taiwan.19 Figure 3 shows the relationship between changes in the country- industry share of R&D expenditure in total R&D expenditure and changes in the knowledge flow network centrality of the top 50 country-industry pairs in term of the increase in centrality from 1995 to 2011. The R&D expenditure share of several country-industry pairs increased substantially, such as the transport equipment and computer and electronics industries in China, the transport equipment industry in the United States, and the chemical products industry in Korea.
However, the R&D share of most of country-industry pairs (e.g., the computer and electronics industry in India) did not change much and that of some country-industry pairs even decreased despite the substantial increase in centrality (e.g., the transport equipment industry in Korea).
INSERT Figures 2 & 3
3.3 Patent Applications by Japanese Firms
Although many Japanese manufacturing MNEs have been very actively applying for patents, their number of patent applications looks to have stagnated or even declined in recent years.
Specifically, patent applications to the JPO have been declining since the mid-2000s. Moreover, since the 2000s, many Japanese firms have disappeared from the list of top patentees at the USPTO. Figure 4 confirms this trend. The total number of patent (family-level) applications by Japanese firms has been falling since the mid-2000s, although the number of applications to the EPO and/or USPTO has remained more or less stable.
19 Appendix Figure 3 shows the top 50 country-industry pairs in terms of changes in network centrality from 1995 to 2011.
19
Figure 5 shows the quality-adjusted number of patent applications per firm for Japanese manufacturing MNEs. To calculate the figures, we first identify whether a firm applied for one or more patents in the same patent family at the EPO or USPTO. As explained in Section 2.1, we eliminate duplicate patent filings and count the number of patent applications to the EPO or USPTO at the patent family level. Since patent applications to overseas patent offices are often regarded to be for patents of high quality, we use the number of patent applications to the EPO and USPTO as a measure of the quality-adjusted number of patent applications. We also utilize the various patent quality measures taken from the OECD Patent Quality Indicators Database. We match the measures with Japanese MNEs’ patents applications to the EPO and USPTO and use the firm-year-level sum of each quality measure as the quality-adjusted number of patent applications. Looking at the results in Figure 5, most of the measures tend to increase until the early 2000s and decline thereafter.20 Specifically, while the number of patent applications to the EPO/USPTO per firm starts to decline only in the latter half of the 2000s, and falls only slightly, the number of forward citations per firm peaks much earlier, around 2002, and subsequently shows a large decline. Such a sharp drop in the forward citations, in fact, has been observed not only in Japan but globally. Squicciarini et al. (2013) show that the forward citation index for patents filed with the EPO has decreased over time. It should be noted that while there may be biases in the patent statistics, controlling for year- and industry-specific effects in the statistical analysis should mitigate such biases if their direction is the same for all observations in each year and industry.
In sum, although the various measures of the quality-adjusted number of patent applications per firm shown in Figure 5 yield somewhat different results, it seems safe to conclude that the quality of Japanese manufacturing MNEs’ patent applications did not improve during the 2000s (and most likely deteriorated) despite the increase in offshore R&D activities shown in Table 1 above. Against this background, in the next section we examine whether offshore R&D improves firms’ innovation performance, focusing on the regional and industry allocation of R&D activities within MNEs.
INSERT Figures 4 & 5
4. Allocation of offshore R&D and innovation by Japanese manufacturing MNEs
20 Because the OECD patent quality measures are available only for patent application to the EPO or USPTO, the values in Figure 5 are calculated based on patents filed with the EPO or USPTO only.
20 4.1 Empirical model
To examine the impact of offshore R&D on innovation output, we estimate the knowledge production function, which relates a knowledge output measure to input measures. The knowledge production function framework has been widely used in the innovation economics literature (e.g., Griliches 1990). We mainly use the number of patent applications (at the patent family-level) as a measure of Japanese manufacturing MNEs’ innovation output and R&D expenditure as a measure of their innovation input.21 We also consider firm size and the size of offshore production as firm-level factors which affect innovation output. More importantly, we include the average knowledge flow network centrality (KNC) of an MNE’s offshore R&D country-industry pairs in order to examine whether the country and industry allocation of offshore R&D affects innovation performance. We estimate the following log-linear equation:
ln (1 +𝑌𝑌𝑓𝑓𝑓𝑓𝑓𝑓) =𝛽𝛽0+𝛽𝛽1ln�1 +𝐺𝐺𝐺𝐺𝐺𝐺𝐺𝐺𝐺𝐺𝐺𝐺_𝑅𝑅𝑅𝑅𝑓𝑓𝑓𝑓−1�+𝛽𝛽2𝑂𝑂𝑂𝑂𝑂𝑂𝑂𝑂ℎ𝐺𝐺𝑜𝑜𝑜𝑜_𝑅𝑅𝑅𝑅_𝑆𝑆ℎ𝐺𝐺𝑜𝑜𝑜𝑜𝑓𝑓𝑓𝑓−1
+𝛽𝛽3ln�𝐺𝐺𝐺𝐺𝐺𝐺𝐺𝐺𝐺𝐺𝐺𝐺_𝐸𝐸𝐸𝐸𝐸𝐸𝑓𝑓𝑓𝑓−1�+𝛽𝛽4𝑂𝑂𝑂𝑂𝑂𝑂𝑂𝑂ℎ𝐺𝐺𝑜𝑜𝑜𝑜_𝐸𝐸𝐸𝐸𝐸𝐸_𝑆𝑆ℎ𝐺𝐺𝑜𝑜𝑜𝑜𝑓𝑓𝑓𝑓−1+𝛽𝛽5𝐾𝐾𝐾𝐾𝐾𝐾𝑓𝑓𝑓𝑓−1
+ 𝛿𝛿𝑓𝑓+𝜃𝜃𝑓𝑓+𝜏𝜏𝑓𝑓+𝜀𝜀𝑓𝑓𝑓𝑓𝑓𝑓
(1) where the dependent variable, Yfit, denotes the number of patent applications (at the family-level) by multinational firm f in year t. Subscript i represents the industry of firm f’s parent firm. The family-level patent applications include all patent applications to the JPO and overseas patent offices by an MNE’s parent firm and overseas affiliates. In other words, we are interested in Japanese MNEs’ worldwide innovation output, although most patent applications are filed by a parent firm or filed jointly by a parent and an affiliate. If both a parent and its affiliates jointly apply for a patent, we count this as one patent application. However, when, for example, two different MNEs jointly apply for a patent, we do not divide the application between them but count this as one patent application by each MNE, i.e., we count two patent applications in total.
21 One concern about using indicators based on patent data as indicators of innovation output is that
“patentability” may differ across industries. If patenting is an effective tool for appropriating returns on innovation only in a limited number of industries, there is a risk that our results are driven by those industries. However, as shown in Appendix Table 1, while there are substantial differences across industries in the total number of patent applications and the propensity to patent, patenting is not too heavily concentrated in a limited number of industries in our sample of Japanese manufacturing MNEs. Therefore, patents provide an effective measure of innovation output for the purposes of this study. It should of course be noted that firms do not always patent new technologies and that they often use patents as strategic instruments.
21
Because there are some firm-year observations in which MNEs did not apply for a patent, we add one to the number of patent applications before taking the logarithm. We also employ alternative dependent variables, namely, the quality-adjusted number of patent applications (at the family- level) constructed using the various patent quality indicators.
As innovation inputs, we include MNEs’ global nominal R&D expenditure, which is defined as the sum of the R&D expenditures of the parent and the overseas affiliates of multinational firm f. Further, we use MNEs’ offshore R&D share – that is, the share of affiliates’ R&D expenditures in the sum of the parent’s and affiliates’ R&D expenditures – to capture the relative size of offshore R&D. Since the offshore R&D share cannot be calculated when both the parent and its affiliates report zero R&D expenditure, only MNEs conducting R&D activities either onshore, offshore, or both are included in the estimation. MNEs’ total number of employees (the sum of domestic and offshore employment), Global_Emp, in logarithm is included as a proxy for firm size, while the share of overseas affiliates’ employees in the global employment is included as a proxy for the relative size of overseas production.
The variable of interest in equation (1) above is KNC, which captures the country and industry allocation of offshore R&D by multinational firm f in year t. The KNC variable is constructed as follows. We expect that firms benefit from larger R&D spillovers if they are active in R&D in countries and industries which are more central in the knowledge flow network.
Therefore, for each multinational firm, we calculate the weighted average of the country-industry knowledge flow network centrality using the country-industry shares of an MNEs’ offshore R&D expenditures as weights. In other words, we assume that MNEs are more likely to gain access to and utilize local knowledge when they more actively conduct R&D activities in the location through their affiliates.22
We construct two KNC variables: one based on time-invariant centrality and one based on time-variant centrality. The two KNC variables can be written as follows:
KNC based on the time-invariant centrality measure:
𝐾𝐾𝐾𝐾𝐾𝐾𝑓𝑓𝑓𝑓=∑𝑓𝑓∈𝐶𝐶𝑓𝑓∑𝑓𝑓∈𝐽𝐽𝑓𝑓𝜑𝜑𝑓𝑓𝑓𝑓𝑓𝑓𝑓𝑓𝐾𝐾𝐾𝐾𝐸𝐸𝐾𝐾𝐾𝐾𝑓𝑓𝑓𝑓 (2a)
22 Our knowledge flow network centrality measure should reflect the size/volume of the knowledge spillover pool as well as the relative position of a country-industry pair in the knowledge flow network, because country-industry pairs with a larger patent stock should receive more citations. Therefore, we mainly use the knowledge flow network centrality to construct the KNC variable, although we also use the total number of patent applications for each country-industry pair instead of the centrality measure to check the robustness of our results. We find that the results are qualitatively the same as those obtained using the centrality measure.
22 KNC based on the time-variant centrality measure:
𝐾𝐾𝐾𝐾𝐾𝐾𝑓𝑓𝑓𝑓=∑𝑓𝑓∈𝐶𝐶𝑓𝑓∑𝑓𝑓∈𝐽𝐽𝑓𝑓𝜑𝜑𝑓𝑓𝑓𝑓𝑓𝑓𝑓𝑓𝐾𝐾𝐾𝐾𝐸𝐸𝐾𝐾𝐾𝐾𝑓𝑓𝑓𝑓𝑓𝑓 (2b) 𝜑𝜑𝑓𝑓𝑓𝑓𝑓𝑓𝑓𝑓= 𝑅𝑅𝑅𝑅𝑓𝑓𝑓𝑓𝑓𝑓𝑓𝑓𝑜𝑜𝑓𝑓𝑓𝑓
∑𝑓𝑓∈𝐶𝐶𝑓𝑓∑𝑓𝑓∈𝐽𝐽𝑓𝑓𝑅𝑅𝑅𝑅𝑓𝑓𝑓𝑓𝑓𝑓𝑓𝑓𝑜𝑜𝑓𝑓𝑓𝑓 (2c)
where KCENTcj denotes the time-invariant knowledge network centrality of an affiliate’s (2-digit level) industry j in host country c. KCENTcjt denotes the country-industry knowledge flow network centrality in year t. φfcjt is the R&D expenditure share of Japanese MNE f’s overseas affiliates in industry j in host country c in the total offshore R&D expenditure of MNE f in year t.
Cfand Jf denote the set of host countries and the set of industries where MNE f has affiliates (equation 2c). That is, the first KNC variable is based on the time-invariant centrality calculated using all the citation information for the whole period, and changes in this KNC variable capture changes in the R&D expenditure shares across affiliates’ country-industry pairs over time (equation 2a). The second KNC variable is based on the time-variant centrality, i.e., centrality is calculated for every year, and changes in this KNC variable capture both changes in the R&D expenditure shares and changes in the centrality of each country-industry pair over time (equation 2b). In cases where an MNE does not conduct any R&D at its foreign affiliates, the KNC variable for this MNE takes a value of zero. The coefficient of interest, β5, in equation (1) captures the relationship between the country and industry allocation of offshore R&D and MNEs’ global innovation output. If the coefficient has a positive sign, this implies that MNEs’ innovation output is positively linked to the amount of R&D expenditure allocated to overseas affiliates in more central country-industry nodes of the global knowledge flow network.
In addition, δf, θi, and τt in equation (1) denote firm-, parent firms’ industry-, and year- specific fixed effects, respectively. εfit is an error term. All the explanatory variables except the fixed effects are lagged one year to reduce concerns about simultaneity between innovation output and inputs. For the estimation, we restrict the sample to MNEs with at least one patent application in the period from 1995 to 2011.23
4.2 Endogeneity
While we are interested in the causal relationship from the allocation of offshore R&D to innovation outcomes, it is possible that firms with a higher propensity to patent tend to allocate R&D activities more to countries and industries that are hubs in the network of global knowledge flows. That is, the distribution of offshore R&D may be endogenously determined. To address this potential endogeneity, we construct an instrumental variable (IV) using data on the offshore
23 Summary statistics for key variables are provided in Appendix Table 2.