Japanese Joumal of Tropical Medicine and Hygiene
第17巻第4号 平成元年12月15日
内 容 原 著
大分におけるキアシツメトゲブユの0郷hoo召繊幼虫自然感染 一特に動物寄生性0窺hoo6瓢8による人への伝播に関して一(英文)
・高岡 宏行,馬場 稔,Odile Bain ビルハルツ住血吸虫症の感染の強さ,罹患率と陽転・陰転比(英文)
・嶋田 雅暁,平田 瑞城,John H.Ouma,
佐藤 克之,野田 伸一,青木 克己 ケニア,沿岸州におけるビルハルツ住血吸虫症の疫学的研究
一ビルハルツ住血吸虫感染における水との接触行動の重要性(英文)
・嶋田 雅暁,平田 瑞城,John H.Ouma,
佐藤 克之,野田 伸一,青木 克己 インドネシア国北スマトラにおけるマラリア高度浸淫地と年齢別生殖母体
血中濃度分布について(英文)
・・糸川 英樹,高井錬二,石井 明,W.Panjaitan ブタ回虫感染マウスにおけるサイトカインとNK活性の動態 ………陶 道 大平肺吸虫の脱嚢メタセルカリア主要外皮抗原と成虫主要外皮抗原を認識する
モノクローナル抗体(英文) ……一…………・・………一……・及川陽三郎,池田 照明 南米エクアドル共和国リーシュマニア症の皮内反応とELISA法による
疫学調査(英文) ………・………・・…古谷 正人,三森 龍之,E.A.L.Gomez,
V.V.Corone1,川端 真人,橋口 義久 アマゾン流域日系移住地,トメアスー地区における回虫およびトキソプラズマ
感染状況についての考察 一………・佐藤久美子,狩野 繁之,Milton M.Hida,
柳澤 紘,小河原はつ江,鈴木 守 症例報告
ヒトクイバエCo吻Jo伽α窺加oρoρ加gπによるハエ症の輸入例
一影井 昇,村田以和夫,倉橋 弘 会 報
投稿規定 第17巻総目次
279−284
285−290
291−301
303−310 311−321
323−329
331−338
339−346
347−350
日熱医会誌
Japan.J.Trop.
Med.Hyg.
日本熱帯医学会
NATURAL INFECTIONS OF SIMULIUM BIDENTATUM (DIPTERA= SIMULIIDAE) WITH LARVAE OF
ONCHOCERCA SPP., IN RELATION TO A HUMAN ZOONOTIC ONCHOCERCIASIS IN OITA, JAPAN
HIROYUKI TAKAOKA*, MlNORU BABA AND ODILE BAIN2 Received June 7 1989/Accepted August 30 1989
Abstract: A total of 579 wild female flies belonging to eight species of Simulium were collected on human baits, in relation to the transmission of a human zoonotic onchocer‑
ciasis found in Oita, Japan. Simulium bidentatum was the most dominant species. Natural infections with filarial larvae were found in ll of 449 S. bidentatum (or 6.5% of the parous fiies) and in I of 23 S. aokii (or 10% of the parousflies). All the infected flies had 1‑4 either first‑, second‑ or early third‑stage larvae in the thorax. Examination of third‑stage larvae shows that S. bidentatum is infected with at least two species of Onchocerca. Our result represents the first record of natural Onchocerca infections in Japanese Simuliidae, and also suggests the possibility of S. bidentatum as the potential vector of zoonotic Onchocerca spp. to humans.
INTRODUCTION
Four human cases of zoonotic onchocerciasis have been reported from various areas of the world (Azarova et al., 1965; Siegenthaler and Gubler, 1965; Beaver et al.. 1974; Ali‑Khan, 1977). An additional case was recently found in Oita, southern Japan (Hashimoto et al., 1990). Examination of histological sections of a female nematode found suggested that, as in all the previous cases, its morphological features resemble those of Onchocerca gutturosa Neumann, 1910 and O. cervicalis Railliet et Henry, 1910 infecting cattle and horses respectively
(Beaver et al., 1989).
Several Onchocerca spp. including O. gutturosa and O. cervicalis have been reported from Japan (Sato et al., 1954; Suzuki et al.. 1982). However, no transmission studies of these filarial nematodes have been carried out, although biting midges (Culicoides spp.) or blackflies (Simulium spp.) have been known as the vectors of certain Onchocerca spp.
elsewhere (Bain and Chabaud, 1986).
1 Division of Medical Zoology, Medical College of Oita, Hazama, Oita 879‑56, Japan
2 Laboratoire Des Zoologie Vers. Museum National d'Histoire Naturelle, 61, Rue de Buffon, 75231 Paris Cedex 05, France
This study was supported by a Grant‑in‑Aid for Scientific Research from the Ministry of Educa‑
tion, Science and Culture of Japan (No. 01570216)
The objective of this study is to investigate the transmission of zoonotic onchocerciasis which may be acquired by humans. In this paper, we report natural Onchocerca infections of S. bidentatum Shiraki collected in one of the suburban residential areas of the city of Oita, where a human zoonotic onchocerciasis occurred.
MATERIALS AND METHODS
The patient infected with a zoonotic Onchocerca, a two‑year‑old Japanese girl, was an inhabitant of Tabaru, one of the suburban residential areas (altitude ca. 30 m above sea level;
coordinates 131'35'E; 33'10'N), situated in the western part of the city of Oita. It was presumed that the zoonotic Onchocerca infection might have been acquired by this child at or near her residential area, because, Iiving in one of the housing complexes (ca. 0.01 km2) , she used to spend her time with her mother during the daytime at the recreation ground (ca.
1,200 m2) Iocated on the west within their premises, and had never left the city, according to her mother. It was therefore attempted to collect biting midges or blackflies at the corner of this recreation ground. Adjacent to this place on the west lies another huge housing area recently developed (with an extension of about 0.4 km') . There is a low hill with a shrubbery just behind these living areas on the south. On the north, a flat farmland mainly used for rice cultivation widely opens and in its center the Oita River runs eastwards which is, at the nearest, about 400 m away from the collection site. There are several cattle sheds but no horses are raised within a 4‑kilometer radius from the collection site.
Collections were made between 16.00 and 18.00 hours during September‑December 1988.
Flies landing on or flying around the body surface of the human baits were captured by an aspiration tube or by an insect net, and held overnight in small plastic containers. The following day, fiies were dissected in saline on a glass slide, and parity was determined by the presence of follicular relics (Detinova, 1962) . Parous females were microscopically searched for filarial larvae. The larvae found were preserved in formalin‑glycerol (Wharton, 19 9) for morphometric observations.
About 170 blackfiies collected in December were individually maintained with sucrose solution at 25'C for seven days, and dissected for the presence of third‑stage filarial larvae.
Generic diagnosis of third‑stage larvae followed that of Bain and Chabaud (1986).
RESULTS
Four collections carried out from September to November 1988 yielded a total of eight blackfly species, but no Culicoides species was captured. The majority of blackfly species were Simulium bidentatum, followed by S. arahawae Matsumura, S. quinquestriatum (Shira‑
ki) and S. aokii (Takahasi) (Table 1).
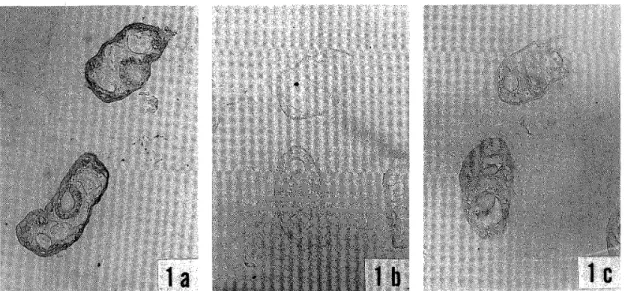
Natural infections with filarial larvae were found in 2.5% of 449 S. bidentatum collected (or 6.5% of the parous flies) , and in 4.3% of 23 S. aokii captured (or 10% of the parous fiies) . Eight of 11 infected S. bidentatum had I to 4 first‑stage larvae, two flies each harbored one second‑stage larva, and one fly had two third‑stage larvae probably just after the second moulting (Fig. 1) . One infected S. aokii had one first‑stage larva (Fig. 2) . All the larvae were found in the thorax of the fiies.
One of the two third‑stage larvae (Fig. 1) recovered from September collection showed
Table I Species composition, parity and natural infections of blackflies collected in Tabaru, one of the suburban residential areas, where a human case of zoonotic onchocerciasis occurred, in Oita, Japan
Date of collection
Sept. 23 Oct. 6 Oct, 13 Nov. 17 Total
Simulium
spp.
No. No, No. No, No. No, No. No. No, No, No. No. No. No, No,
col . par , inf , col . pa r . inf . col . par , inf , col , par . inf . col , par. in f , aokii
a raha wae bidentatum ja ponicum
nikkoense quinquestriatum
ru fi basis tahahasii
o 33 88 o o o
o 11 30
o o 4
o 4 o 43 o o
3 2
3
9
O 2 1
1
O
o o o
7 O 174
O 2 7 O
4
69 o
o 2
o
o
o o
12 3 144
1 1
30
21 3 l
62 O O 10
o o 3 o O o o o
23 36 449 2
33 12 23
10 12 170 O O 10 5 2
O 11 O O O O O
the following measurements: total body length (BL) 743 pm, body width (BW) 26 pm, Iength of oesophagus (LE) 464 pm, Iength of tail (LT) 35 pm, width of tail (WT) 21 pm.
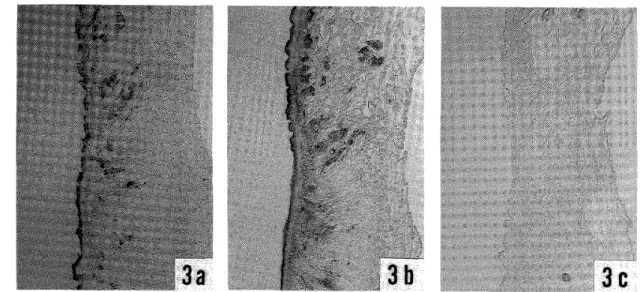
In dissections of flies maintained for seven days after collection, one of 144 S. bidentatum examined had one third‑stage larva (Fig. 3) in the thorax, but all of the 22 S. aokii were negative. The third‑stage larva recovered (Fig. 3) showed following measurements: BL 1,280 pm, BW 25 pm, LE 620 pm. LT 45 I/m, WT 20 pm. This larva, as well as two early third‑stage larvae mentioned above, seemed to belong to the genus Onchocerca by possessing the very small, almost indiscernible caudal lappets.
It is generally impossible to identify the young third‑stage larvae. However, the early third‑stage larva fdund in September seemed to be distinct from the longer third‑stage larva found in December because the ratio of LE/BL, as well as body length, was clearly different (i. e., 0.62 vs. 0.48) . This conclusion is supported by our observations (unpublished data) that early third‑stage larvae of the latter (long type Onchocerca) bear the short oesophagus (less than 1/2 of body length) Iike mature third‑stage larva, and measure over 850 pm in body length.
It remained to be determined whether the filaria infecting S. aokii belongs to Onchocerca.
DISCUSSION
Beaver et al. (1989) suggested that the human zoonotic onchocerciasis found in Oita was probably caused by O. gutturosa or O. cervicalis which have been commonly known in cattle and horses respectively around the world. Our result shows the least possibility that the causative worm was O. cervicalis, because its transmitter, Culicoides, was not captured during the daytime in the study area. This is also supported by the fact that horses, the definitive host of this parasite, were not raised around this area.
On the other hand, it is demonstrated that there were several anthropophilic blackfly species in the study area, and that S. bidentatum, the most dominant species, was naturally infected with larvae of Onchocerca. Examination of the third‑stage larvae recovered shows
'* '* ' *i' i '; { ';'; J^**' i S ' *=i ! ;='i*;i * " '*:' :
; = == s *
'; < *'e /**'/=j}'* i*=*‑'<= i*;'* ' ' '* ='= * ' '̲ ;; ! : ; #' *i ' *
' i;‑f 's'*="'‑ = i = =t' :;" { '* ' '= ̲' ' **"*i; : ‑ ‑:' ': "": * 's= ‑**"' " ' ' "^‑ ' ' : * ' *;r ;'" '* * =#' '*+' ' < ' ' ** ' ' i ̲' ;> ̲ ̲ ̲*< **** ' ' :' :#+*"{̲s". "{ 'i:i:; il:{:: ̲' ' ' '
‑* ** '+ = > +' { = ;̲=*' * >'*<' ̲>=;= ' ;*' ̲": * *+**" :' *"' * i; 'i!""‑"̲* *‑ '*" i ;;'=:"" '* ‑'*' ‑ ' "' *'*" " ' ' "' '
# ' :"/* "' ; """'
; # i*{i;;: !/ ';;' ' i
'=: # ;" ;{ ' ;" " . ̲
; '
*' " * ' '" i i * 'i'S'I**i*'*1' *' .
' *. ' '" ' I: '/ ; /<:' ̲
;+* { i j fjllj.< ' '" ・ ' 'i{ " j・・i* ' '
{ ** i * s *' '""* ' * i " "'"'" ;/ .
: .
;"‑
i;
,* ; i
;i {
*‑:' : ! +/ ' : ':s"
"' '+ * = *
"' " '‑ ' "<"; "
=*.. ;"
Figure I Early third‑stage larva of Onchocerca sp, found in S. bidentatum dissected soori after collection.
Figure 2 First‑stage larva of unidentified filaria found in S. aokii dissected soon after collection.
Figure 3 Third‑stage larva of Onchocerca sp, found in S. bideletatum maintained for seven days after collection.
All scale bars indicate 100 ftm
that S. bidentatum was infected with at least two Onchocerca species. One of these two fits in with the body length of third‑stage larva of O. gutturosa given by Bain (1979) , but more specimens of mature stage are needed to compare with the bovine parasite. The other one, though only one specimen is available, may belong to a new species because it has a very long body, as compared to those of other known Onchocerca species (Bain and Chabaud, 1986) . At the present, it is thus difflcult to conclude that the zoonotic Onchocerca acquired by a Japanese child was O. gutturosa, although it might be one of the two Onchocerca species found in S. bidentatum.
There were many cattle (both Holstein and Japanese Black) at several sheds set up in the farmland near the study area, and microfilariae of Onchocerca spp. were already found in blood‑fed females of S, bidentatum. S. aokii and S. arakawae collected at one of five cowsheds examined. Further, three types of third‑stage larvae of Onchocerca spp. were commonly discovered in the same blackfiy species collected at the same cowshed (Takaoka and Bain, unpublished data) . One of these three types of Onchocerca appears to be the same species as the longer third‑stage larva found in this survey, and the remaining two types resemble third‑
stage larvae of O. gutturosa and O. Iienalls Stiles, 1908 respectively, although both of the latter two bovine filariae have been not yet recorded in Oita. Whether all these types of Onchocerca spp. recovered from Simulium spp. are parasites of cattle or of other animals should await future studies.
In summary, our findings indicate that there exists a situation, under which the zoonotic Onchocerca infection may be acquired by humans through biting of the local blackfiy species, in the western suburbs of Oita.
ACKNOWLEDGEMENTS
We are grateful to Dr. I. Tada, Kumamoto University Medical School, for his valuable comments. Thanks are also due to Miss C. Aoki, and K. Ogata, Medical College of Oita for their assistance during this survey.
REFEREN CES
1 ) Ali‑Khan, Z. (1977): Tissue pathology and comparative microanatomy of Onchocerca from a resident of Ontario and other enzootic Onchocerca species from Canada and U.S.A., Ann. Trop.
Med. Parasitol., 71, 469‑482
2 ) Azarova, N.S., Miretskij, O.Y. and Sonin, M.D. (1965): The first discovered case of nematode parasitism in the USSR in a human being (genus Onchocerca Diesing, 1841), Med. Parazytol.
(Moscow), 34, 156‑158 (in Russian)
3 ) Bain, O. (1979): Transmission de l' Onchocerque bovine, Onchocerca gutturosa, par Culicoides, Ann. Parasitol., 54, 483‑488
4 ) Bain, O. and Chabaud, A.G. (1986) : Atlas des larves infestantes de filaires, Trop. Med. Parasit., 37, 301‑340
5 ) Beaver, P.C., Horner, G.S. and Bilos, J.Z. (1974): Zoonotic onchocerciasis in a resident of Illinois and observations on the identification of Onchocerca species, Am. J. Trop. Med. Hyg., 23, 595‑607
6 ) Beaver, P.C., Yoshimura, H., Takayasu, S., Hashimoto, H. and Little. M.D. (1989): Zoonotic Onchocerca in a Japanese child, Am. J. Trop. Med. Hyg., 40, 298‑300
7)Detinova,T.S.(1962):Age−grouping methods in Diptera of medical importance,Monograph Ser.W.H,0.no.47,pp.217
8)Hashimoto,H.,Murakami,1.,Fuliwara,S.,Takayasu,S.,Takaoka,H.,Uga,S.,Akao,N.,
Kondo,K.and Yoshimura,H.(1990):A human case of zoonotic onchocerciasis in Japan,J,
Dermatol.,17(in press)
9)Sato,K.,Hayashi,S.and Tanaka,H.(1954):Studies on the causative parasites of skin micro且1ariasis of cattle(Wahi Disease),0%oho 6綴gπ枷名osαNeumann,1910,and of equines (Kasen disease),0館6海oo6名oα 召7毎oα傭Railliet et Henry,1910,JPn.J.Parasitol.,2,199−206(in Japanese)
10)Siegenthaler,R.and Gubler,R.(1965):Paraatriculares Nematodengranulom(einheimische Oηohooθ膨),95,1102−1104
11)Suzuki,Y.,Sugimura,M.,Yagi,K.,Ohbayashi,M.and Shoho,C.(1982):Onchocerciasis in wild Japanese serows,C砂痂o■痂s o万s餌s,Jpn.」.Vet.Sci、,44,823−825
12)Wharton,R.H.(1959):A simple method ofmounting and preserving且1arial larvae,Bu1L Wld.
Hlth Org.,20,729−730
大分におけるキアシツメトゲブユのOn6hoo6z伽幼虫自然感染 一特に動物寄生性Onohoo6z昭による人への伝播に関して一
高岡 宏行1・馬場 稔1・Odile Bain2
大分市の西部郊外において見いだされた,動物寄生性0解hoo召κ8線虫による人体例の伝播に 関して,患者の居住区において人囮法によって吸血ブユの採集を行い,フィラリア幼虫の感染の 有無を調べた。その結果,8種のブユが採集され,そのうちキアシツメトゲブユが優先種である
ことが分かった。また本種ブユでは,調べた449個体のうち11個体の雌に,フィラリア幼虫の感染 が見つかった。第3期幼虫の形態的観察により,On6hooθzo4属に属する2種が含まれていること が分かった。これらの結果から,動物寄生性0甥hooθzoαの人体への感染について考察を行った。
大分医科大学医動物学教室
Laboratoire Des Zoologie Vers.,Museum National d Histoire Naturelle,France
INTENSITY, INCIDENCE AND CONVERSION/
REVERSION RATIO OF SCHISTOSOMA HAEMATOBIUM INFECTION
MASAAKI SHIMADA', MIZUKI HIRATA,, JOHN H, OUMA*, KATSUYUKI SATO,, SHINICHI NODA' AND YOSHIKI AoKr
Received May 6 1989/Accepted August 25 1989
Abstract: The changes in the intensity of Schistosoma haematobium infection, incidence and conversion/reversion ratio in a community were observed over a period of 1.5 years. The intensity of infection was judged by two indices: egg counts per 10 ml of urine and egg counts per hour. During the study period, 4 urine examinations were conducted at 6‑month intervals.
Subjects were included in the analysis of the changes in the intensity of infection in a commu‑
nity if they took all 4 urine examinations and were positive for eggs. The changes in the intensity of S. haematobium infection differed considerably according to the indices used. The changes in the intensity of infection were compared with the changes in the level of transmis‑
sion expressed by incidence and conversion/reversion ratio or with the changes in the urine volume. The changes in the intensity of infection expressed by egg counts per hour closely paralleled the changes in both incidence and conversion/reversion ratio in a community, regardless of urine volume. By contrast, when the intensity of infection was expressed by egg counts per 10 ml of urine, it did not correlate with the changes in the level of transmission, and was negatively related to the changes in urine volume. These results suggest that egg counts per hour is a reliable index that accurately reflects the changes in the intensity of S.
haematobium infection in a community.
INTRODUCTION
Although various indices have been proposed for the measurement of the intensity of S.
haematobium infection in individual patients (Clarke, 1966; Wilkins, 1977; Stephenson et al..
1984), egg counts per 10 ml of urine at midday has been used most frequently thus far.
However, one of the shortcomings of this index is that it is affected by daily changes in urine volume, so that the intensity of infection of individual patients varies from day to day.
1 Department of Parasitology, Institute of Tropical Medicine, Nagasaki University, Nagasaki 852, Japan
2 Department of Parasitology. Kurume University School of Medicine, Kurume 830, Japan 3 Division of Vector Borne Diseases, Ministry of Health, Nairobi, Kenya
4 Department of Medical Zoology, Faculty of Medicine, Kagoshima University, Kagoshima 892,
J a pan
This study was conducted under the Kenya‑Japan Communicable Diseases Research and Control Project, with support from the Kenya Medical Research Institute and Japan International Coopera‑
tion Agency. The data analysis was carried out at the Nagasaki University Information Process‑
ing Center and at the Computer Center, Kyushu University.
Therefore, we recommended the use of an index, that is, egg counts per hour, that is not affected by changes in urine volume. This serves as a stable index for the measurement of the intensity of infection at an individual level (Shimada et al.. 1986) .
For community‑based longitudinal studies, particularly cohort epidemiological studies or control projects, the change in the intensity of infection is a key variable. At a community level, however, the intensity of S. haematobium infection has also usually been expressed by mean egg counts per 10 ml of urine from infected people. Urine volume varies not only from day to day at an individual level but also from season to season, owing to environmental factors such as temperature and humidity. Therefore, it is highly probable that the mean intensity of S. haematobium infection in a community differs from season to season even though there is not a true change in the intensity of infection.
In the present study, we attempted to examine the possible changes in the mean intensity of S. haematobium infection in a community judged by two indices, that is, egg counts per 10 ml of urine and egg counts per hour, over a period of 1.5 years. The results were then compared with the changes in the level of transmission expressed by incidence and conver‑
sion/reversion ratio, and with the changes of the mean urine volume.
MATERIALS AND METHODS
The present study was conducted at Mwachinga village, Kwale district, Kenya. The intensity of infection of the patients was expressed by two indices: egg counts per 10 ml of urine and egg counts per hour. The details were described elsewhere (Shimada et al., 1986) . Briefiy speaking, urine was collected I hour after the previous urination during midday (11:30‑
13:30). The volume of each specimen was measured. The nuclepore filter method of Peters et al. (1976) was used to filter and count the number of eggs per 10 ml of urine, and then the total number of eggs in the urine was calculated. Egg counts per hour was obtained by dividing total egg counts by the time between two urinations.
The intensity of infection in a community was expressed by the mean egg counts of subjects in logarithm. Urine examinations were conducted 4 times during a study period of 1.5 years. The Ist examination was done in May/June 1982, the 2nd in November/December 1982, the 3rd in May/June 1983 and the 4th in November/December 1983. The number of villagers taking each urine examination was 699, 710, 869 and 682 respectively. Among these, 219 completed all urine examinations and were positive for eggs. These 219 patients were subjected to the analysis of the changes in the intensity of infection.
Four urine examinations done during a period of 1.5 years allowed us to calculate the incidence and conversion/reversion ratio in our study area at 6‑month intervals. Incidence was expressed as percentage of persons who had been negative at the first survey but were positive for eggs at the second of two surveys. Conversions were the egg positives at a urine examination who had been negative at the preceding examination, while the reversions were the egg negatives at a urine examination who had been positive at the preceding examination.
log3
:, o
!: 2
C:
: Ou 1
el a, a,
log3
a, C L 5
O 2
S
e
u, 1
C:
5 O U
C1
C1 ,D
A
i i i‑̲i
ml 40
a, E :: 30 o >
Q, 20 c L :, 10
B
i‑ ' '1¥̲l
e 5'
e ̲/
eJune Dec June Dec 1 982 1 983
Figure I Changes in the intensity of S.
haematobium infection in a com‑
munity (A, B) and fluctuation of urine volume (O over a period of 1.5 years. Intensity of infec‑
tion was expressed by egg counts per hour (A) and egg counts per lO ml of urine (B) .
represents mean standard
error.
RESULTS
Intensity of Infection
When egg counts per hour was used as an index, the intensity of infection in a community fluctuated slightly (Fig. IA). The mean log egg counts per hour increased from 2.732 to 2.804 during the first 6‑month period between June and December 1982. During the second 6‑month period, December 1982‑June 1983, the intensity of infection again increased slightly to 2.839.
Egg counts then decreased to 2.696 during the third 6‑month period. The ch nges in the inten‑
sity of infection over a period of 1.5 years were not statistically significant (p=0.3674) .
When egg counts per 10 ml of urine were used, the pattern of the changes in the intensity of infection was different from that expressed by egg counts per hour (Fig. IB). Egg counts increased from 2.394 to 2.585 during the first 6‑
month period, then decreased to 2.474 in the second and to 2.289 in the third 6‑month period.
The difference in the intensity of infection during the study period was statistically significant (p=0.0138). The mean egg counts per 10 ml of urine were significantly different
between the second and the fourth urine
examinations by Scheffe's test (p< 0.05) . Incidence and Conversion/Reversion Ratio
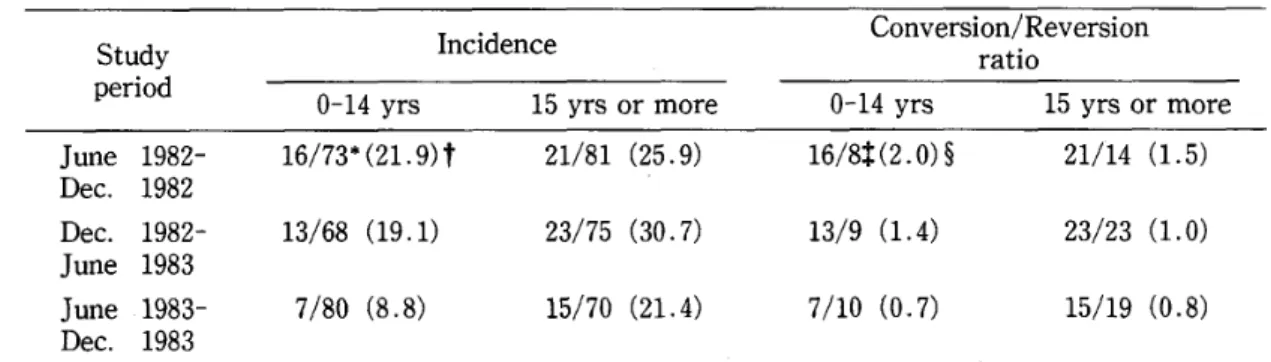
The results are shown in Table 1.
Although the incidence was not significantly different from season to season, the incidence among children under 14 years of age during the first and second 6‑month periods was approxi‑
mately 2 times greater than that during the third period.
Conversion/reversion ratios during the first and second 6‑month periods exceeded 1, and ratios during the third 6‑month period were
smaller than 1, but the difference was not statis‑
tically significant. The changes of the intensity of infection expressed by egg counts per hour closely paralleled the changes in incidence or conversion/reversion ratio.
Urine Volume
The results are shown in Fig. IC. The mean volume of urine obtained at each examina‑
tion showed significant changes; 37.51 ml for May/June 1982, 28.34 for November/December
Table l Incidence and conversion/reversion ratio in the study area Study
period
Incidence Conversion/Reversion ratio
0‑14 yrs 15 yrs or more 0‑14 yrs 15 y rs or more June
Dec.
Dec.
June June Dec.
1982‑
1982 1982‑
1983 1983‑
1983
16/73* (21
13/68
7/80
. 9) t
(19 . 1)
(8 . 8)
21/81
23/75
15/70
(25 . 9)
(30 . 7)
(21 . 4)
16/8t (2 . O) S
13/9
7/10 (1.4)
(O . 7)
21/14 23/23 15/19
(1.5)
(1.0)
(0.8)
* : No. of egg positives at the second of two surveys who had been negative at the first survey/No.
of egg negatives at the first survey t : (%)
$ : conversion/reversion: conversion=new infection ( ‑ to +) , reversion=spontaneously lost infec‑
tion(+ to ‑) S : ratio
1982, 38.11 for May/June 1983, and 41.23 for November/December for 1983 (p=0.0097) . The mean volume of urine at the second urine examination was significantly lower than that at the fourth examination (Scheffe's test, p < 0.05). The fluctuation pattern of the intensity of infection expressed by egg counts per 10 ml of urine was mirrored by that of the urine volume.
DISCUSSION
The data presented in our study show that it is important to reconsider the precision of the indices by which the mean intensity of S. haematobium infection in a community has been judged in the past. The changes in the mean intensity of infection in a community during a certain period of time differed considerably according to the index used, that is, egg counts per 10 m I of urine or egg counts per hour. When the changes in the intensity of infection were compared with the changes in the level of transmission in our study area, the advantages and disadvantages of the two indices were disclosed.
Incidence and conversion/reversion ratio are considered to indicate the level of transmis‑
sion in, an endemic area of schistosomiasis. When these values are greater during a certain period of time than those during a previous period, the mean intensity of infection in a community is expected to increase during the correnponding period of time, and vice versa.
In our study, when the mean intensity of infection was expressed by egg counts per hour, the changes in the intensity of infection in a community during a study period of 1.5 years, although not statistically significant, closely paralleled the changes in incidence and conver‑
sion/reversion ratio in that community. By contrast, when it was expressed by egg counts per 10 ml of urine, the intensity of infection did not correlate with the changes of the level of transmission.
Variation and stability in S. haematobium egg output have long been cosidered (Wilkins and Scott, 1978). In discussions on the changes in egg output, urine volume has usually been indentified as a factor which may affect egg output (Clarke, 1966; Wilkins, 1977; Stephenson et al.. 1984) . However, there has been no report describing the actual changes in mean urine
volume and their effect on the measurement of the mean intensity of infection in a longitudi‑
nal study of a community. Recently, we reported that at an individual level, egg counts per 10 ml of urine are affected by the changes of urine volume (Shimada et al., 1984). The present study revealed once more that, at a community level, the changes in the intensity of infection expressed by mean egg count per infection expressed by mean egg count per infection expressed by mean egg count per 10 ml of urine were negatively correlated to the changes of mean urine volume (R= ‑0.908, 0.1 >p>0.05, n=4) . By contrast, the mean egg count per hour was not affected by the changes of mean urine volume.
Although the results of the present and previous studies do not conclusively prove that egg count per hour is the best index for the measurement of the intensity of S. haematobium infection, it is undoubtedly a reliable index which can be used as a field technique at both the individual and community levels. Egg count per 10 ml of urine measures the concentration of eggs in urine, but not the real intensity of infection.
ACKNOWLEDGMENTS
We express appreciation to Prof. M. Mugambi. Director of Kenya Medical Research Institute; Dr. T.K. Arap Siongok, Director, Division of Communicable Disease Control, Kenya; Dr. J. N. Kaviti, Director, National Public Health Laboratory Services, Kenya; Dr. D.
K. Koech, Director, Division of Vector Borne Diseases, Kenya; and Mr. K. Onoda JICA Officer, Nairobi, Kenya, for their encouragement in conducting the present study. We are also grateful to the late Mr. P. Bebora and his staff, and chief of Mwachinga village, for their cooperation during the survey. We wish to express special appreciation to Prof. H. Tanaka, Tokyo University, for his helpful criticism and suggestions in the preparation of the manu‑
script.
REFERENCES
1 ) Clarke, V. de V. (1966) : The influence of acquired resistance in the epidemiology of bilhar‑
ziasis, Cent. Afr. J. Med., 12, 1‑30
2 ) Peters, P.A., Mahmoud, A.A.F., Warren, K.S., Ouma, J.H. and Arap Siongok, T.K. (1976):
Field studies of a rapid, accurate means of quantifying Schistosoma haematobium eggs in urine samples, Bull. W.H.O., 54, 159‑162
3 ) Shimada, M., Hirata, M., Sato, K., Wambayi, E., Ouma, J.H. and Aoki, Y. (1986): Egg count in urine to determine the intensity of Schl tosoma haematobium infection, Japan. J. Trop. Med.
Hyg., 14, 267‑272 .
4 ) Stephenson, L.S., Latham, M.C., Kinoti, S.N. and Oduori, M.L. (1984): Sensitivity and specificity of reagent strips in screening of Kenyan children for Schistosoma haematobium infection, Am. J. Trop. Med. Hyg., 33, 862‑871
5 ) Wilkins, H.A. (1977): Variation in urinary creatinine concentration and Schistosoma haematobium egg count, Trans. Roy. Soc. Trop. Med. Hyg., 71, 411‑415
6 ) Wilkins, H.A. and Scott, A. (1978): Variation and stability in Schistosoma haematobium egg counts: a four‑year study of Gambian children, Trans. Roy. Soc. Trop. Med. Hyg., 72, 397‑404
ビルハルツ住血吸虫症の感染の強さ,罹患率と陽転・陰転比
嶋田 雅暁1・平田 瑞城2・John H.Ouma3・佐藤 克之1・
野田 伸一4・青木 克己
ビルハルツ住血吸虫症の感染の強さ,罹患率,陽転・陰転比の変化を1年半にわたって観察し た。感染の強さは2つの指標,尿10ml中の虫卵数と1時間当たりの排泄虫卵数で表した。調査 期間中,6カ月毎に4回尿検査を調査地で行った。すべての調査を受け,かつすべて虫卵陽性で あった者を,部落における感染の強さの変化の解析の対象者とした。
感染の強さの変化は,用いる指標によって全く異なった。この変化を罹患率,陽転・陰転比で 示した感染の圧力の変化,あるいは尿量の変化と堵較した。感染の強さを時間当たりの排泄虫卵 数で表すと,その変化は罹患率,陽転・陰転比と同様に変化した。この変化は,尿量の変化とは 無関係である。一方,尿10mJ中の虫卵数で表すと,感染の強さの変化は,感染の圧力とは全く 関係せず,尿量とは逆相関した。
これらの結果は,調査地でビルハルツ住血吸虫症の感染の強さを表す指標としては,1時間当 たりの排泄虫卵数の方が信頼できることを示している。
長崎大学熱帯医学研究所寄生虫学部門 久留米大学医学部寄生虫学教室
Division of Vector Bome Diseases,Ministry of Health,Nairobi,Kenya 鹿児島大学医学部医動物学教室
EPIDEMIOLOGICAL STUDY OF SCHISTOSOMA HAEMATOBIUM INFECTION IN A COASTAL AREA
OF KENYA ‑ THE IMPORTANCE OF WATER CONTACT PATTER'NS IN RELATION TO
S. HAEMA TOBIUM INFECTION
MASAAKI SHIMADA*, MIZUKI HIRATA2, JOHN H. OUMA3 KATSUYUKI SATOl, SmNlcm NODA4 AND YOSHIKI AOKI*
Received May 8 1989/Accepted September 5 1989
Abstracts Water contact observation and urine examination were carried out on a population in an endemic area of Schistosoma haematobium infection, Mwachinga, Kwale district, Kenya. The change in the mean level of water contact with age and the age‑
prevalence or age‑intensity distribution of S. haematobium infection showed similar trends, but not a direct quantitative relationship. Therefore, a mathematical model was applied in the attempt to analyze the relationship between the intensity of S. haematobium infection and the level of water contact. The worm burden, number of paired worms and proportion of hosts with paired worms were estimated from the level of water contact, annual incidence, and the proposed life‑span of S. haematobium by using an immigration‑
death model on the basis of simple assumptions. These estimated values were compared with the observed prevalence and intensity of infection. The results showed a linear correlation between observed data and estimated values. We conclude that the character‑
istic shape of the age‑egg output curve for S. haematobium in the community is satisfacto‑
rily explained solely in terms of 'the change in water contact with age.
INTRODUCTION
The relationship between the age and the prevalence and intensity of S. haematobium infection is similar in most endemic areas. The characteristic shape of the age‑prevalence and age‑intensity curve for S. haematobium is a peak between the age of 10 and 14 years and a relatively rapid decline in older people (Warren, 1973; Mott, 1982). Intestinal schis‑
tosomiasis also shows a similar age‑related pattern. With regard to influences upon immigra‑
1 Department of Parasitology, Institute of Tropical Medicine, Nagasaki University, Nagasaki 852, Japan
2 Department of Parasitology, Kurume University School of Medicine, Kurume 830, Japan 3 Division of Vector Borne Diseases, Ministry of Health, Nairobi, Kenya
4 Department of Medical Zoology, Faculty Qf Medicine. Kagoshima University, Kagoshima 892, Japan This study was conducted under the Kenya‑Japan Communicable Diseases Research and Control Project, with support from the Kenya Medical Research Institute and Japan International Coopera‑
tion Agency. The data analysis was carried out at the Nagasaki University Information Process‑
ing Center and at the Computer Center, Kyushu University.
tion and emigration of worms, two major factors have been considered in explaining of the characteristic relationship between age and infection (Warren, 1973) . These are 1) the de‑
velopment of protective immunity by the age of 10 years (Bradley and McCullough, 1973) and 2) the variation in water contact with age (Dalton and Pole, 1978; Kvalsvig and Schutte,
1986) .
However, no convincing evidence has been presented on the role of protective immunity in the decline of the intensity or prevalence of infection after adolescence. Most of the evidence of protective immunity recently reported vyas observed after chemotherapy (Stur‑
rock et al.. 1983; Butterworth et al., 1985; Wilkins et al.. 1987) . Meanwhile, epidemiologists concluded on the basis of human water cOntact studies that the characteristic shape of the age‑
egg output curve for S. haematobium is satisfactorily explained solely by the variation in water contact with age (Dalton and Pole, 1978; Kvalsvig and Schutte, 1986) . Again, however, shortcomings exist in their analysis, one of which is that the death of worms was not taken into account.
To further discuss the possible role of the level of water contact in the characteristic shape of the age‑prevalence and/or intensity curve, not only a quantitative analysis of human water contact but also an estimation of worm burden is necessary. This is because the egg output reflects accumulated worm burden resulting from contact with infested water, not the level of water contact itself. On the basis of the level of water contact and the proposed life‑
span of S. haematobium (Wilkins et al.. 1984), we attempted to estimate the worm burden in the community by using an immigration‑death model. Since schistosome needs to mate to lay eggs, the probability of pairing was also calculated. The comparison between the observed data and estimated worm pair burden allows us to determine whether or not the patterns of S. haematobium infection in a community can be adequately explained solely in terms of the patterns of water contact.
MATERIALS AND METHODS
Urine examination
The present study was conducted at Mwachinga village, Kwale district, Kenya. Informa‑
tion concerning the geography, population, and prevalence and intensity of S. haematobium infection in the study area was compiled during an initial survey done in June 1982 and has been published elsewhere (Shimada et al.. 1987) . The method of urine examination was also published previously (Shimada et al.. 1986). Briefly speaking, urine was collected I hour after the previous urination during midday. The intensity of infection was expressed as the number of eggs excreted per hour assessed by the filtration method of Peters et al. (1976) . The geometric mean was obtained by using the n+ I transformation for a series of egg output including zeros.
Water colctact study
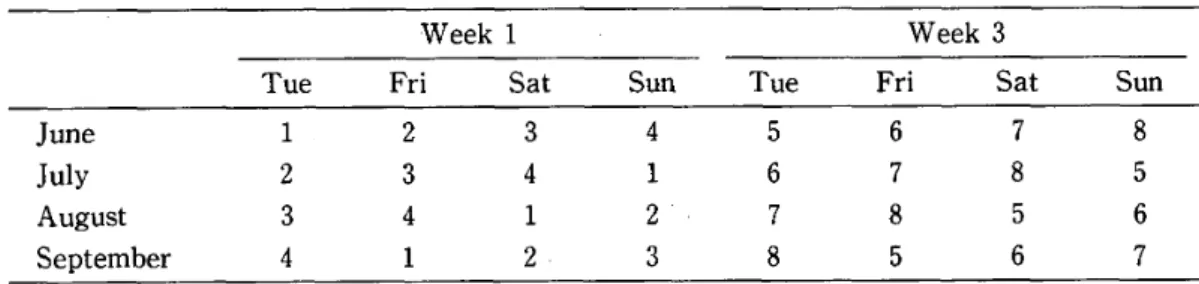
Water contact observation was carried out on the population over a period of one year (June 1982 to May 1983) by the direct observation method of Dalton and Pole (1978) . The study sites were 16 major points which had been identified as busy sites by a questionnaire.
The observers were two villagers who have lived there for many years. In order to reduce the effect of site and seasonal variation in our study area, a 4 x 4 Latin square with three replicates was used. The study sites were divided at random into two groups of 8 sites. Each
Table 1 Water contact observation schedule
Week 1 Week 3
Tue Fri Sat S un Tue Fri Sat Sun
June July August Se ptember
2 3 4
2 3 4 1
3 4 l 2
4
2 3
5 6
8
6 7 8 5
7 8
6
8 5 6 7 Numbers indicate the study sites.
Table 2 Percentage of parts of body to total body surface
Children (0‑14 yrs) Adults (15 yrs or more)
2.
3.
4.
5.
6.
7.
8.
9.
10.
ll.
12.
13.
One hand Two hands One foot Two feet One arm Two arms
One leg Two legs Hands and feet Hands and legs Arms and feet Arms and legs Whole body
2 4 2 4 10 20 15 30 8 34 24 50 100
2 4 2 4 9 18 18 36 8 40 22 54 lOO Cited from Behrman and Vaughan (ed.) . Nelson Textbook of Pediatrics, 1986.
group of 8 sites was observed by one observer. Water contact was observed at each site for 4 days in each of the 3 "seasons" of 4 months' duration. Table I shows the date and sites of water contact observation made by one observer during one season of 4 months. The observation was carried out from 06 h OO to 18 h 30. The collected information included names of inhabitants, time of day, duration of contact (in minutes) , and submerged parts of the body. The level of water contact of an individual during a single submersion was expressed by the duration of contact (minutes) multiplied by the percentage of submerged parts to total body surface, which was calculated from the burn chart shown in Table 2. Then the level of water contact of a person for one year was calculated as the sum of each contact.
The level of water contact of a certain age group was expressed by the geometric mean. A population census was conducted in June 1983.
RESULTS
Water contact observation
Out of 1,195 villagers, 617 came in contact with water during the one year study period.
The overall geometric mean of the level of water contact among observed persons was 1,510.
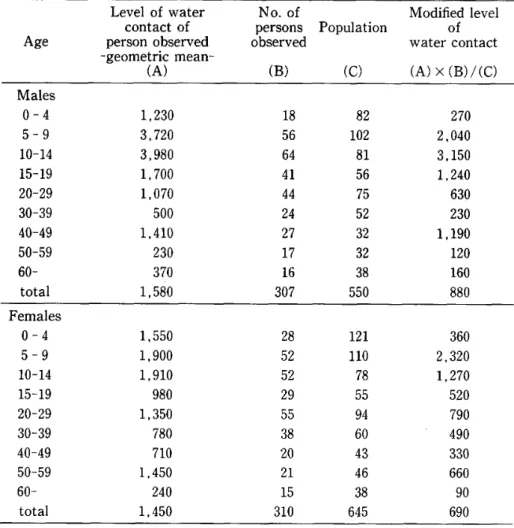
Table 3 shows the relationship between the level of water contact and sex or age. The geometric mean of the levels of water contact of male and female was 1,580 and 1,450, respectively. The difference between sexes was not significant ・(t=0.48, p = 0.63) .
' To express the level of water contact of each age group, the mean level of water contact for the observed person was multiplied by a ratio 'of the number of observed people to the total number of people of the group registere,d. The reason for this modification of the level of water contact is that the proportion of observed people differed much by sex and age, and non‑observed persons probably came scarcely or less frequently in contact with water.
The modified level of water contact showed that, for males, the level of water contact reached a peak among those aged l0‑14 years and then declined rapidly to lower levels, with the exception of a relatively high level of water contact at the age of 40‑49 years. For females, the level of water contact reached a peak at the age of 5‑9 years, decreased rapidly to a low level at the age of 15‑19 years, and remained low in older people.
Estimation of worm burden, number of paired female worms and proportion of hosts with paired worms
The estimation of worm burden, number of paired female worms and proportion of hosts with paired worms was based on simple assumptions for immigration and emigration of
Table 3 Observed level of water contact and modified level of water contact
Age
Level of water No. of contact of persons
person observed observed
‑geometric mean‑
(A) (B)
Po pulation
(O
Modified level of water contact
(A) x (B) /(O Males
0‑4 5‑9
10‑14 15‑19 20‑29 30‑39 40‑49 50‑59 60‑
total
1 , 230 3 , 720 3 , 980 1 , 700 1 , 070
500
1 , 410
230 370
1 , 580
18 56 64 41 44 24 27 17 16 307
82 l02 81 56 75 52 32 32 38 550
270
2 , 040 3 , 150 1 , 240
630 230
1 , 190
120 160 880 Females
0‑4 5‑9
10‑14 15‑19 20‑29 30‑39 40‑49 50‑59 60‑
total
1 , 550 1 , 900 l , 910
980
1 , 350
780 710
1 , 450
240
1 , 450
28 52 52 29 55 38 20 21 15 310
121 llO 78 55 94 60 43 46 38 645
360 2 320
1 , 270
520 790 490 330 660 90 690
schistosomes. To estimate the worm burden, we used a immigration‑death model (Anderson, 1976) . The number of worms in a host (N) at time t can be expressed as
N ={(A X I)/D} x {1‑ exp (‑D)} + {Nt̲1 x exp ( ‑D)}
where Nt̲1 is the number of ivorms at t ‑ 1. A is a constant, and I is the relative level of water
contact. Thus, A X I is immigration rate and D is death rate of a worm per year. The immigration rate (A X I) can be calculated from the following equation proposed by Hairston (1965), m= ‑ Iog (1‑ J ), where m is the mean number of female worms acquired by a person per year and B is the annual incidence. The annual incidence in our study area was about 0.28 (Shimada et al.. 1989). Solving the equation, therefore, 0.75 female worms were acquired per person per year and there are 2m or 1.5 worms acquired per person per year. We assumed that the number of cercariae invading a host refiects the level of water contact.
Therefore, a person with a level as high as the mean annual level of water contact of the villagers in our study area is expected to acquire 1.5 worms per year. To obtain the immigration rate of each age group, we gave the constant A the value 1.5 and I the ratio of the level of water contact of each age group to the mean level of water contact of all the villagers. The death rate (D) was assumed to be 0.3 per worm per year. This was calculated from the estimated life‑span of S. haematobium (3.4 years) proposed by Wilkins et al. (1984) . In addition to the estimate of worm burden in a host, ah attempt was made to estimate the number Qf paired female worms which reflects the intensity of infection or egg output, and also the proportion of hosts with paired worms which represents the prevalence of infection.
The probability of male and female worm mating was given as (0.88 x N)/(N+ 1.73) as proposed by Goddard (1978) . Thus, the number of paired female worms (F) is expressed mathematically as
F=NX 0.88xN x 1 N+ I .73
The proportion of hosts with paired worms (P) is expressed as P= {1 ‑ exp ( ‑ N/2)}2
This is based upon the random distribution of worms among people (Macdonald, 1965). A calculation program for these formulae in the NEC computer is written by BASIC Ianguage.
Table 4 Estimated number of paired worms and proportion of hosts with paired worms
Males Females
Age No, of paired worms (mean)
Proportion of hosts with paired worms
(%)
No. of paired worms
(mean)
Proportion of hosts with paired worms
(%)
0‑4 5‑9
10‑14 15‑19 20‑29 30‑39 40‑49 50‑59 60‑
O . 09 2 . 43 5 . 47 4 . 16 1 . 65 O . 48 l . 76 O . 59 O . 14
8 90 100 99 82 39 84 42 13
O . 20 3 . 79 4 . 19 2 . 28 l . 85 1 . 28 O . 73 1 . 28 O . 41
18 97 99 91 88 76 55 76 33