ISSN 0387-1339
富山大学工学部紀要
第41巻
Bulletin of
Faculty of Engineering
Toyama U niversity
Vol. 41
1 9 9 0
目 次
「退官記念論文」
1. ヨウ化第2水銀(HgI2)放射線検出器の製作と応用(英文)
………中谷秀夫, 阪井英次, 片桐政樹, 山崎登志成.. . ・H・.. 1
「退官記念講文」
2. 軸穴の電気式改良型仕上げ及び、テーパー精度の簡易測定装置
…・…・…柳瀬秋夫, 高安勇吉………11
3. 多孔質静圧気体スラスト軸受の安定性改善について
…春山義夫, 塩津和章, 江幡節男………16
4. 研削層におけるかたさの変化と残留応力について
………能登谷久公, 山田 茂, 高辻雄三, 大山達雄………21
5. 太陽フレアにおける電流ループ合体を示すコロナ爆発(英文)
…坂井純一, Cornelis de JAGER.. . . ・H・.27
6. 小さい高エネルギーフレアにおけるX型電流ループ合体による粒子加速(英文)
・……坂井純一, Cornelis de JAGER . ….. 41
7. 3次元X型電流ループ合体による高エネルギーフレア爆発(英文)
…坂井純一, Cornelis de JAGER.. . . …45
8. 時空(1+ 1)次元における非線型発展方程式のシンメトリック・アプローチ(英文)
…川田 勉………5 0
9. ターゲット利用率の優れたスパッタ法による電子材料薄膜の形成と特性
….. . . . ・H・.. 高橋隆一, 直江正彦.. . ・H・.. 69
10. ネマチック液晶による高速光シャツタ
. . …若林成喜, 桑原道夫, 女川博義, 宮下和雄.. . ・H・.. 78 11. 昭和63年度修士論文概要一覧
. 85
Fabrication of Mercuric Iodide Nuclear Radiation Detector and Its Application
Hideo Nakatani*, Eiji Sakai**, Masaki Katagiri**
and T oshinari Yamazaki*
* Department of Electronics and Computer Engineering, Faculty of Engineering, Toyama University, Toyama.
** Japan Atomic Energy Research Institute, Tokaimura, N akagun, lbarakiken.
ABSTRACT
The performance of a nuclear radiation detector constructed with a mercuric iodide (Hgl2) crystal grown by the vapor transport method of the conventional and simple static sublimation were measured.
It was shown that the Hgl2 detector operated at room temperature and that the initial detection characteristics were maintained for a long period.
The authors applied the detector to the measurements of fission products in JRR-3 cover-gas of JAERI and demonstrated that quantitative determination of 80keV y-ray released from 133Xe could be performed by the detector in spite of the extremely small size of its element (1.95mm2 x 0.7mmt) .
1 • Introduction
The Ge semiconductor detector, which is widely used in the field of spectral measurement of radiation, especially of y-ray, has· an excellent energy resolution, but requires liquid nitrogen cooling. Therefore, the tedious supply and the big container of liquid nitrogen required are undesirable problems for its use. As a y-ray detector which can be used at room temperature, the N al (Tl) scintillation counter, which is often used for spectral measurement, is not so good in energy resolution, and cannot be used for complicated y-ray spectral measurements.
Therefore, the development of a small semiconductor detector which can be operated at room temperature without liquid nitrogen cooling and shows a better energy resolution than N al
(Tl) scintillation counter has been requested.
As semiconductor detectors which can be operated at room temperature, Si, GaAs, CdTe, Hgl2 etc. are considered. If one compares atomic numbers, forbidden band gaps, mobilities of
electron and hole, mean free times etc. of these semiconductor materials[!], the Si detector does not fit the y-ray spectral measurement because of its small atomic number. Although the GaAs detector was the first to have shown a good energy resolution at room temperature among the compound semiconductors, the atomic number is almost the same as the Ge detector and only small single crystals can be obtained, and therefore its practical application is difficult.
Although the CdTe detector has a larger atomic number than the Ge detector, there are problems such that the growth of big crystals is not obtained and the pulse height fluctuates during the time course.
Compared with these detectors, the mercuric iodide detector has superior characteristics as a detector of y-ray spectral measurement since it has
(1) a broad band gap which is necessary for performance at room temperature and (2) a large atomic number which is required for the efficient detection of photo electron
peaks even by small crystals,
Noticing the above points, the authors tried to fabricate the Hgl2 detector and to apply it to the field of y-ray measurement for a nuclear reactor. The detector was applied to the quantita
tive measurement of radioactivity in the cover-gas of a nuclear reactor and was ascertained to be used practically as a monitor detector.
2 . Fabrication of y·Ray Detector and Its Detection Characteristics
2.1 Growth of Hglz Crystal and Fabrication of Detector
There are several methods to grow Hgl2 crystals such as the solvent evaporation[2,3], and the vapor transport[ 4-7] which includes the static sublimation, the dynamic sublimation and the temperature fluctuation methods. The authors have grown Hgl2 crystals by these methods and fabricated a Hgl2 detector by mounting the crystals on a detector holder[8,9]. Through the measurement of detecting characteristics, it was found extremely difficult to fabricate a detector which has a high detecting efficiency and a good energy resolution in addition to the ability to maintain the initial detecting characteristics for a long period.
Among the detectors fabricated, an Hgl2 detector which employed a crystal grown by the vapor transport method, utilizing simple static sublimation, exhibited a relatively good energy resolution and stable detecting characteristics. Therefore, it was selected as a detector to be studied in detail. The vapor transport method by the static sublimation is a crystal growth method where the starting material of Hgl2 is sealed into one end of a glass tube under vacuum and placed in the high temperature part of an electric furnace having two temperature regions.
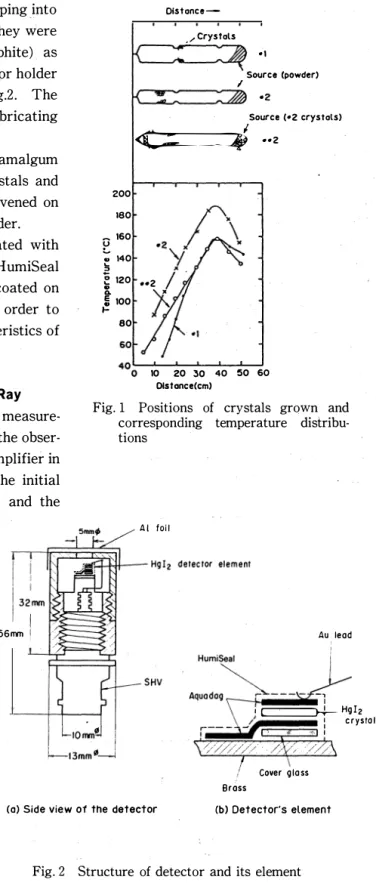
Many small Hgl2 crystals are grown in the low temperature part. Figure 1 shows the tempera
ture distribution on the wall of the glass tube used for crystal growth. In #1 and #2, commercially available Hglz powder was employed as a starting material and in ##2, the crystal group grown in #2 was used as a starting material and sublimated again.
After crystal growth for 10 days for #1, #2 and 5 days for ##2, many crystals with the size of a few mm square and 1 mm thick were obtained at the region where the tube wall temperature was about nooc.
Among these crystals, highly transparent ones were chosen and cracked at easily cleavable -2-
Nakatani • Sakai • Katagiri • Yamazaki : Fabrication of Mercuric Iodide Nuclear Radiation Detector and Its Application
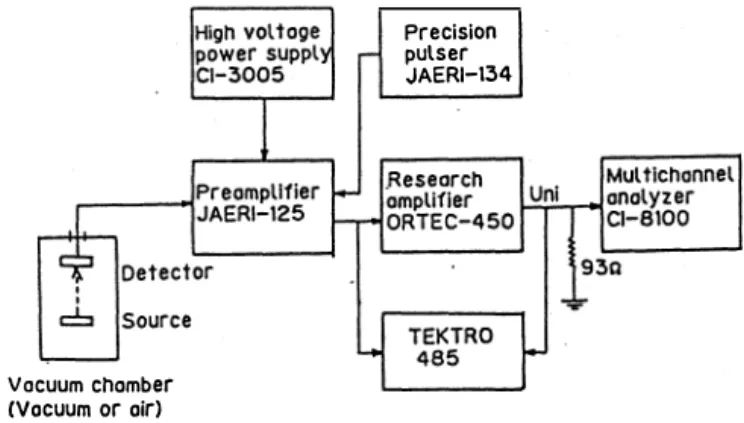
planes with a thin blade, etched by dipping into a 20-25% KI solution and washed. They were coated with Aquadag (glue like graphite) as the electrode and mounted on a detector holder with a SHV connector as shown in Fig.2. The points paid attention to during the fabricating process are:
1 . In order to avoid an active amalgum reaction between mercury in the crystals and metal material, cover glass was intervened on the brass pedestal in the detector holder.
2 . The gold lead wire was coated with Aquadag. As a finishing treatment, HumiSeal (transparent resin of acrylate) was coated on the whole surface of the crystals in order to maintain the stable detection characteristics of the detector for a long period.
2. 2 Detection Characteristics of a-Ray Figure 3 is a block diagram of the measure
ment circuit of a· and y·rays. From the obser·
vation of the output wave of the preamplifier in the detection of y·ray from 241 Am, the initial rise time of the wave was obtained and the mobility of carrier, J.l, was calcu
lated.
By observing the voltage dependence of the pulse height, (mobility of carrier J.l) x (mean
56nvn I I
200 180
� 160
!-' :; 140
!;
Distance-
__,Crystals
•I
Source (powder) I
Source (•2 crystals)
� ··2 I
-._0 120
C) ••2
0.
e 100
i! 80
10 20 30 40 50 60
OistanceCcm)
Fig. 1 Positions of crystals grown and corresponding temperature distribu
tions
AI foil
Au lead
-, I , c:=:=::J-l-Hglz
/ 1 crystal
free time -r) = (J.l't) product was obtained. The (J.l't) products of electron and hole, J.le 'te and J.lh 'th were 10-4� 10-s and 2 x 10⁻⁷ cm2 I V, respectively. The product of electron showed almost the same value as the theoretical value, but that of hole was found to be worse by 2·3 magnitudes.
I i
-1 -l3mm11_j
r--- ,.J , - � '"" 1
\ />////(/ .. /\� /�\
2. 3 Detection Characteristics of y·Ray
The distribution of pulse
(a) Side vie.w o1 the detector
' Cover g Ia ss Bross
(b) Detector's element
Fig. 2 Structure of detector and its element
height for a 241Am y-ray source observed when -1,000V (on elec
tron traversing) and + 1,000V (on hole traversing) were applied to the electrode at the radiation injection site of the ##2-2 Hgl2 detector (Hgl2 single crystals of 1.
95mm2 x0.7mm of thickness) is shown in Figs.4(a) and 4 (b). A better energy resolution was ob
served for a negative bias than for a positive bias. This behavior comes from the fact that the
Vacuum chamber (Vacuum or air)
Precision pulser JAERI-134
Fig. 3 Schematic diagram of electronics
charge collection characteristics of electrons are superior than those of the hole. When a negative bias was applied, the half width energy resolution was 4.9 keV for y-ray of 59.5keV.
The pulse height distribution of the #1-3 Hgl2 detector (Hglz single crystals of 1 X 1.6 X 0.
6mm3), which showed the best half width energy resolution among Hgl2 detectors fabricated by the authors, is shown in Fig.5. The half width energy resolution of 3.5ke V was obtained for the
y-ray of 59.5keV.
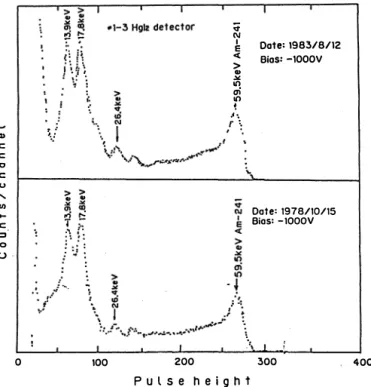
Furthermore, for the #1-3 Hgl2 detector, a stability test of long term detection characteristics was carried out by using a 241Am ray source. As illustrated in Fig.6, it was ascertained that the spectral characteristics did not change even after 5 years and the detector could be used as a long-term y-ray monitor etc ..
0
••2-2 Hglz
.Bios -IOOOV .. 2-2 H·gl z
Bios +IOOOV
Pulse height (a )
G) c:
c: 0 .c: 0 ' U) ....
::> c:
u 0
512 0
Pulse height (b)
Fig. 4 241 Am y-ray spectra obtained from Hglz detector (1.
95mm2 x 0.7mm) with (a) -1,000 V bias and (b) + 1,000 V bias at room temperature
- 4 -
� . . .. .
I
512
Nakatani • Sakai • Katagiri • Yamazaki : Fabrication of Mercuric Iodide Nuclear Radiation Detector and Its Application
3 • Application
•1-3 Hg12 detector (lxL6x0.5mm'l
At present, there is no report that Hgl2 detec
tor was tried to be used for the y-ray measure-
Gamma-ray source: Am-241 Bios: -400V
ment related to nuclear reactor. The authors measured the y-ray spectrum from the radiation nucleus in the cover-gas of JRR-3 using the Hgl2 detector fabricated.
-.; c c .c 0 u ' II) ....
c :>
u 0
Time: 500sec
0 1024
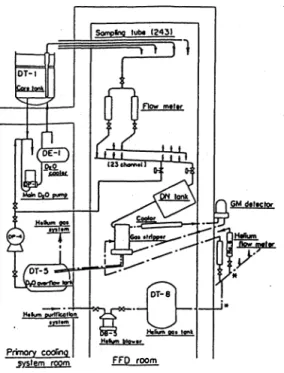
Pulse height Figure 7 shows a system diagram for detect
ing a failed fuel of JRR-3. The cooling material (heavy water) sampled each from 243 fuel-vessels is divided into two pathways and led to a gas stripper and separated into gas and water by the cover-gas (He gas) and the radiation activity in this gas was measured to detect the failed fuel [10]. The positions where the authors carried out
Fig. 5 241 Am y-ray spectrum obtained from Hgl2 detector (1 X 1.6 X 0.5mm3) with -400 V bias at room temperature
y-ray measurements using the Hgl2 detector are indicated by asterisks.
In the following, the result of measurement will be shown in comparison with the example of measurement by Ge (Li) detector.
Q) )._/
c c 0 .c u ' II) c ::1 0 u
0 100
I
200
¢ N E I
<t
> ..
.><
10 ai
10 ! ....
r ':
P u lse height
I
Date: 19B�/B/12 Bias: -IOOOV
Date: 1978/10/15 Bios: -IOOOV
�00 400
Fig. 6 Comparison of y-ray spectra obtained from Hgl2 detector (1 X 1.6 X 0.5mm3), (upper) on Aug. 12, 1983 and
(lower) on Oct. 15, 1978
3 .1 Measurement of Radionuclides in the Cover-Gas Sample
The radiation activity in the cover-gas introduced into a sampling cell of JRR-3 was measured by ##2-2 Hgl2 detector and Ge (Li) detector. The sampling cell made of aluminum of the thickness of 2mm having an inner volume of ll3cm3, was used. The y-ray spectral mea
surements were performed in the arrangement shown in Fig.S for Hgl2 and Ge (Li) detectors.
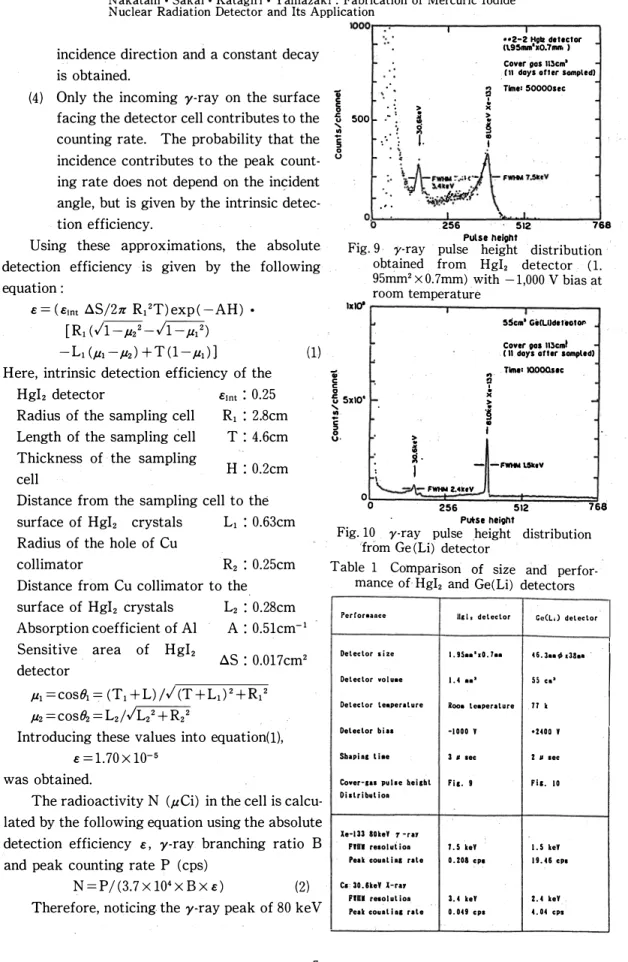
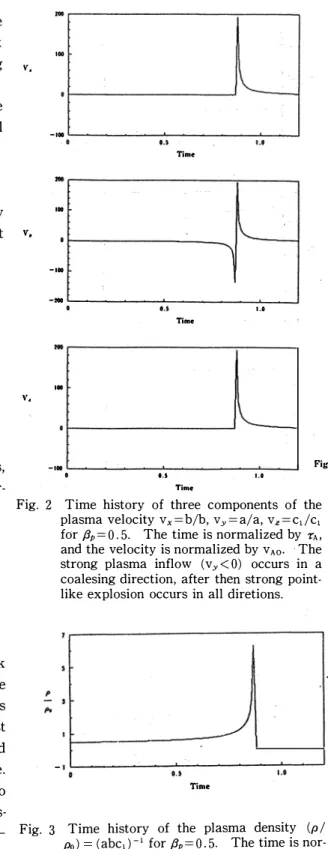
The pulse height distributions for the cover
gas measured ll days after the sampling are shown in Fig.9 and 10 for Hgl2 and Ge (Li) detec
tors, respectively. In both cases, peaks of y-ray of 80.99 keV from 133Xe and of Ka and K,B X-rays of 30.63 and 35.0 keV, emitted on the collapse of Xe to Cs, were observed. The results comparing the characteristics of the two detectors are shown in Table 1. Although the Hgl2 detector is of small size and usable at room temperaure, it is inferior in energy resolution and in detecting efficiency to the Ge (Li) detector. However, the detecting charateristics are good enough for the Hgl2 detec
tor to be available in the measurement of low energy y-ray emitted from cover-gas.
We tried to apply the Hgl2 detector to a quantitative analysis of the radioactive concentration of 133Xe.
Firstly, we obtained the intrinsic detection efficiency of ##2-2 Hgl2 detector using 241 Am and 57Co y-ray sources. The results are shown in Fig.ll. The interpolation of these results gave the intrinsic detection efficiency of y-ray of 80.99 keV, E1nt as 0.25.
Then, using the geometry whose cross section is shown in Fig.l2, the absolute detection effi
ciency for the cover-gas in the sampling cell of the Hgl2 detector was calculated. On obtaining the absolute detection efficiency, e, the following approximations were employed:
(1) The radiation source distributes evenly in the cell.
(2) Only the radiation passing through the Cu collimator reaches the detector.
(3) Aluminum wall does not depend on the
- 6 -
FFD room
If Gomna•roy spectr�Mn measurement points
Fig. 7 y-ray spectrum measurement points in JRR-3 fuel failure detection system
Preamplifier JAERI-125
(a)Sampling cell-Hgl2 detector
2mmt Al 55cm' Ge(Li)detector (b)Sampling cell-Ge(Li)detector
Fig. 8 Geometry between sampling cell and detector for cover-gas y spectrometry using Hgl2 and Ge (Li) detectors
Nakatani • Sakai • Katagiri • Yamazaki : Fabrication of Mercuric Iodide Nuclear Radiation Detector and Its Application
1000r--.,..----..---�---.
incidence direction and a constant decay is obtained.
(4) Only the incoming y-ray on the surface 1
facing the detector cell contributes to the �
counting rate. The probability that the j
incidence contributes to the peak count- 0
500
••2-2 t191z detector ll9$nw'xo.7 ... 1 Cover pos 113cm•
(11 days after sampled)
· · _, Time: soooosec
• 0 > �
- ·, � i
:· ; I. i
:� \-A_F_.7.·"'�-. -F-T.51!ev
·J � �4ttY,, :,
. �.:,�i#,�ru..· . .
. ' .
I �
ing rate does not depend on the incident angle, but is given by the intrinsic detec
tion efficiency. 256 512
Pulse helg/lt 768 Using these approximations, the absolute
detection efficiency is given by the following equation:
E = ( E�nt D.S/27t Rt2T) exp ( -AH) • [Rt ( /1 -JL22 -/1 -p12) -L1 (JLI -JLz) + T ( 1 -JL1) )
Here, intrinsic detection efficiency of the Hglz detector E1nt : 0.25 Radius of the sampling cell R1 : 2.8cm Length of the sampling cell T : 4.6cm Thickness of the sampling
cell H: 0.2cm
Distance from the sampling cell to the surface of Hgl2 crystals L1 : 0.63cm Radius of the hole of Cu
collimator Rz : 0.25cm
Distance from Cu collimator to the surface of Hgl2 crystals Lz : 0.28cm Absorption coefficient of AI
Sensitive area of Hglz detector
A: 0.5lcm-1 D.S: 0.017cm2 JL1 =cos81 = (Tt +L) j/ (T +L1)2+R12 JLz =cos8z =Lz/1Lz2+ R22
Introducing these values into equation(1), E = 1.70 X 10-s
was obtained.
(1)
The radioactivity N (pCi) in the cell is calcu
lated by the following equation using the absolute detection efficiency E, y-ray branching ratio B and peak counting rate P (cps)
N=P/ (3.7 xl04XBXE) (2)
Therefore, noticing the y-ray peak of 80 keV v �
"
Fig. 9 · y-ray pulse height ·distribution obtained from Hglz detector ( 1.
95mm2 x 0. 7mm) with -1,000 V bias at room temperature
1xl0' 1----.---,..,---.
$Scm' GiCLildeltatOI' Caver vas 113cml C II days after sampled) .., Time• IQOOOsoc 0 �
"
£ 5xl0' r- ·i -
' .
: �
U·
.. I
� �
: �-l - -'-FWHMl51!tV
\
O '---* FWHM 2.4XtY
0 256 512
Putse height 768 Fig. 10 y-ray pulse height distribution
from Ge(Li) detector
Table 1 Comparison of size and perfor
mance of Hglz and Ge(Li) detectors
PerConance 1lgl1 detector Cc(L.) del ector
Detector size 1. gs •• •.o. r.. 46.laa-$tlha '
Detector volu.a 1. 4 ••' SS ca,
Detector Lea_peralure il:ooa leaperalure 11 k
Detector biaa ·1000 y •2400 y
Sbap ia& ti ae 3 p. sec 2 " sec
Cover-us puhe hei&bl Fi&. t Fh. 10 Distribulioa
Xe-133 BOkeY r-rar
FIUI reaolul ioa 7. 5 keY I. 5 keY Peak coua1ia1 rale 0. 208 cpc 19.46 CPI
Ca· 30.1keV 1-rar
nu• resolulioa 3.4 keY %. 4 keY
Peak coaaliDI rale 0. 049 cps 4.04 cps
I I
of 133Xe , introduction of P=0.208 cps, B=0.366 into the above equation (2) gives N as 0.90 ,uCi.
Deviding this value by the volume of 113cm3, the radioactive concentration of 133Xe in the cell was obtained as 8.0 x10⁻³ ,uCi/cm3•
On the other hand, in order to estimate the correctness of the above approximated analytical calculation, the radioactive concentration was also calculated by the Monte· Carlo method con
sidering the three dimensional form. It was ascertained that the radioactive concentration was almost identical, being 7.9 x 10⁻³ ,uCi/cm3•
On the other hand, the radioactive con
centration obtained from the counted value mea
sured by the Ge(Li) detector was 9.4 x 10⁻³ ,uCi/
cm3• Comparing the two results, the analytical reasult given by the Hgl2 detector is a smaller value by about 15 %, but it is assumed to be of sufficient accuracy considering that the dimen
tion of the detector is small. Thus, it was ascer
tained that the Hgl2 detector can be used for the quantitative measurement of y-ray.
3. 2 Measurement of the Radionuclides in the Cover-Ga.s in the Reactor Room
While JRR-3 is operated under an output of 10 MW, the y-ray of the radioactivity in the cover
gas flowing into the monitor chamber (MC-2, volume of 100 cm3) at a rate of 2 .e /min was measured. As an Hgl2 detector, #1-3 detector was used. The distribution of pulse height of y-ray measured is shown in Fig.13. The y-ray of 80 keV from 133Xe and the y-ray of 250 keV from 135Xe with a shorter half life, which could not be measured for the sampling, gas, were clearly observed.
The result of the measurement for the cover
gas, which was sealed into. the monitor chamber when cover-gas did not flow by the stop ofJRR-3, are shown in Figs.14(a) and 14(b). For Fig.(a), 47000s (about 13 h) were counted and for Fig.(b), further 212000s (about 2.45 d) after the previous
-8-
-·2-2 HP detector Blos. Vo\tage I -lOOOV
0\�o---'--'-....L....-:s�o-'--'--w....IO�o---�zo·o
Gamma-ray energy (keVl.
Fig. 11 Intrinsic peak detection efficiency of ##2-2 Hgl2 detector
t----2R• (56mm•l----i
!
Gaseous! source
I I
!
AI absorber (2mml)
Fig. 12 Calculation model for cover-gas
•1-3 Hglz detector (1x1.6xO,Smm') Bios -900V
JRR-3 cover gos in MC-2 .Gos flow 21/min
JRR-3 Power 10-0MW Time: 12100sec
0
... � 2048
Pulse height
Fig. 13 JRR-3 cover-gas y-ray spectrum obtained from Hgl2 detector with'- 900 V bias at room temperature
4096
Nakatani • Sakai • Katagiri • Yamazaki : Fabrication of Mercuric Iodide Nuclear Radiation Detector and Its Application
measurement were counted. In these measurements, the process of decay of radioactive nucleuses, 135Xe (half life of 9.1 h) and 133Xe (half life of 5.25 d) which are the main species in the cover-gas, was measured. Due to this process, the relative ratio of the y-ray peak of 250 keV of 135Xe with a shorter half life, to the y-ray peak of 80 ke V of 133Xe with a longer half life is changing.
It was ascertained that the changing ratio of both countings shows a good agteement with.that calculated using the values of the half life. In this way stable oper
ation of the Hgi2 detector was ascertained.
4 • Conclusion
As described above, the authors fabricated a small nuclear radiation detector by using single crystals of Hgi2 which were grown by a simple vapor transport method, measured the detection characteristics and applied it to the quantitative determination and the monitoring of radioactivity in
0
.,
n
�::J
. ·-
. i :-I
I : >"<
a; . -.,i >
c �} ..
C '}I.�
_g •• CD
' u
"'
§ 0 u
0
10 el
I ..
.x
>
� ..
10 N
(a)•l-3 Hglz detector
nxL6X0.5mm'l
Bias -900V
JRR-3 Cover g,as lnmOI)ilor chamber C No gos now )' JRR-3 Power OMW
Time• 47000sec
2048 Pulse height Col
Cbl•l-3 Hgll detector (lxL6x0.5mm') Bias -900V
4096
JRR-3 Cover gas In monitor chamber ( No gas now )
JRR-3 Power OMW
Time: 212000!18C
2048 Pulse height (b)
4096
Fig.14 y-ray spectrum of JRR-3 cover-gas in monitor chamber obtained from Hgl2 detector after cover
gas flow was shut off
the cover-gas of JRR-3 nuclear reactor. As a result, provided that the quantitative calculation is made with due consideration of the geometrical conditions of the detector and the object to be measured, the Hgi2 detector was ascertained to be applicable enough to the quantitative determi
nation in the region of relatively low y-ray energy such as 50-250 keV, and it was also ascertained that it can be used stably for the y-ray measurement even at room temperature. The Hgi2 detector will be applied to various fields in the future, due to the merit that it is small and usable at room temperature.
The authors would like to express many thanks to Emeritus Professor of Osaka University, Dr. Yoshifumi Sakurai for his guidance and advice in this research. The authors wish to emphasize that this research is "a product of cooperative use of the facilities of Japan Atomic Energy Research Institute".
This paper was presented on journal of the Atomic Energy Society of japan, 29, 739 (1987).
References
1 ) E. Sakai: Nucl. Instr. Meth., 196, 121 (1982) 2 ) W.R. Willig : Nucl. lnstr. Meth., 96, 615 (1971) 3 ) H.L. Maim : IEEE Trans. Nucl. Sci., 19, 263 (1973)
4 ) M. Schieber, R. Carlston, H.Lamonds, P. Randke, W. Schnepple and J. Llacer:]. Crystal Growth., 24&25, 205 (1974)
5 ) S.P. Swierkowski, G.A. Armantrout and R. Wichner: IEEE Trans. Nucl. Sci., 21, 302 (1974) 6 ) M. Schieber, W.F. Schnepple and L. van den Berg : ]. Crystal Growth., 53, 125 (1976) 7 ) M. Schieber, et al.: Crystal Growth and Materials., 279, North-Holland Publishing, (1977) 8 ) H. Nakatani, E. Sakai and M. Katagiri : jAERI-M, 8478, 1 (1979)
9 ) H. Nakatani: Hoshasen (Ionizing Radiation), 10, 100 (1984)
10) Operation Section of JAERI JRR-3, Description and Hazard Analysis of]RR-3, jAERI, 6004, 1 (1968)
- 10 -
|退官記念論文|
軸穴の電気式改良型仕上げ及びテーパー 精度の簡易測定装置
柳瀬 秋夫, 高安 勇吉
緒 言(1 )
回転機械の軸動力伝達に欠かせない軸穴壁面の精度に関し, あらさ, テーパーの直線'性等が重要な 要素となり, これらの精密な検出測定装置も開発され実用 化し市販されている。
しかしながらこれらは何れも装置の操作に専門的な技術を必要とする上, 経済的見地から有用性が るが, 実際面である作業現場では実用的でないためテスト棒の色ぬり法による概要的な判別に依存し ているのが現状である。
この理由から, 軸穴の精度について信頼できる適否判別が出来ないのが製品納入上の障害となって いる。
この観点から筆者らはすでに経済的及び精宅上からも信頼性あり, しかも簡単で誰にでも操作が出 来る「軸穴の電気式簡易仕上げ兼精度判別装置」を開発した。
しかしながら, この装置の特質から軸穴壁面のあらさは高精度を発揮するが, テーパー精度面に関し て適性荷重のための計器の読み取りの他, 波形観測等操作員の心労的負担増となり操作中の精度判別 は生産増強の点から困難 であることがわかった。
よってこの点に着目し, この装置の特質を活用し て, テーパー精度の均一性は荷重に関係することか ら適性荷重加圧のための計器の読み取りのみ配慮、し, ハンドル その他の波形観測を行わず操作員の負担軽減になる 改良型装置を試作し作業能率向上を計った。 その結 果, あらさ, テーパーの均一性向上となった。 一方,
テーパー精度の面に関しては, 付加的に, 新しく考 案したテーパー精度簡易比較測定装置によって切削 仕上げ終了後改めてテーパー精度を検査すると両者 ともに信頼性ある判別が出来る。
以上により, これまで幾多の問題点をもっ軸穴の 仕上げ法に関し, さきに開発した切削仕上げ装置の 改良型装置と『簡易比較測定装置』を組み合わせる ことにより信頼性があり, 然も操作簡単で経済上,
生産能率向上等からも特に有用性がある。
次に図面を添付して更に説明を加える。
部分鉱大図
4
留
周一
量一腎
荷』鉱
一--
一
図1 構造概要図(仕上げ装置)
1 . 本装置の説明 5も
図 1 は上記した改良型切削仕上げ装置の構造概要図を示す。 試料に加圧する力は電気計器で読み取 る。 従って本装置によれば加圧力を示す計器指示一定であれば軸穴テーパー精度は均一に仕上がる特
.
220
CLOC!<. 1
図2 センサ一回路
性をもっていることから, 操作員はこの点のみ に注意を払えば良い。
図2は切削操作時聞を計測するためのセンサ 一回路である。 発光ダイオードから発する光が 回転円板にあけられている小孔を通過するごと に信号をカウンタ一回路に送る。
図 3はそのカウンタ一回路図を示す。 センサ ーからの信号をカウントし, そのカウント数に より切削時聞を知る。 以上で切削仕上げ装置の
図3 カウンタ一回路
…山一一 拘/一一
三一
図4 構造概要図(測定装置)
概略を簡単に述べた。 以下に軸穴テーパー測定装置について述べる。
図 4は軸穴テーパー測定装置の構造を示す。
テスト台には試料を規定の位置に園定するための考慮を払ったテスト枠と, インジケータを水平方
- 12 -
柳瀬・高安:軸穴の電気式改良型仕上げ及びテーパー精度の簡易測定装置
向に移動できる様にして取り付け測定位置 a ・ b 聞の長さLを計測する尺度目盛りを 付してある。 (尺度目盛りは本文では測定位 置感知によっているため目盛りの読み取り は必要でない)
図 5はテスト枠に挿入された状態の試料 軸穴壁面の部分説明図である。 図示の太点 線は切削前 (単能盤による壁面) の軸穴予 想壁面を示し, 又水平実線は上述した改良 型仕上げ装置によって切削する理論上壁面 (テスト枠の傾きαに よって試料の下部 壁面を水平に設定する) を示すものとする。
いま, この装置で切削する場合, 切削さ
限界紬穴冨
θγ 切削許宮盛面角
。向: 切削限界僅甑角
図5 軸穴壁面切削説明図
れる範囲は図示の水平実線と太点線の聞である。 従ってこの範囲で然も受入側では更にテーパー許容 穴面 (8max)以内と指定条件があるが一般的である。 一方, 人的感覚に依存する場合, 到底理論上壁面 で示す様な壁面(図示. 水平面)に切削仕上げすることは不可能に近く(切削過, による不適格のた め) その結果, 限界を見込んだ斜線で示される範囲 (8m8X �恥n) に限定される。
従ってこの範囲内に仕上げされているか否かを確認する軸穴テーパー精度測定法が, すなわち,こ〉
で述べようとしている本考案装置による測定法である。 図 5において, 限界値角及び許容値角に適用 する荷重によって切削仕上げされた基準試料の九in . 8maxを本装置であらかじめ測定しておげば, こ の範囲を満足する荷重の加圧によって軸穴は切削され, その試料の任意角。nは
仇lax>8n> 8min ( 1 )
となり, 理論上適格品と判定される。
この場合8nの値は後記する様に, インジケータの読みによって間接的に求める。 文インジケータの読 みは精度上の点からも配慮して, 絶対値として取り扱わないで, 上述した基準試料の限界及び許容値 角。'mln. Omaxとの比較法をとっているため, この方法を, 本文で簡易比較法と呼ぶ。
しかしながら, 以上は操作状態及び試料の材質等すべて一定条件がある。 いまこの状態, 材質等何 らかの原因による条件変化を考慮すると上述の8nに仕上げ出来る保証はない。 このような場合, 新し く切削しようとする一群の試料中の最初の試料 1 個について切削し改めて本装置によりその試料の軸 穴テーパー精度を測定し適性荷重について再度決定すれば, さきにも述べたように本切削装置の均一 性から試料検査はこれら一群の試料仕上げ製品について抜き取り検査によって判定出来るので信頼性 は向上する。 次に本測定法の実際面について具体的に説明する。
2 . 本測定装置による実際
図 5の斜線範囲内での任意。nの場合を想定し, a 点から移動したインジケータの読み n8nとテーパ 仇の関係は
tan8n=kn8n であることから 1 式は
nmax > n8n > nmin と書き改められる
よって図 4の a . b 聞のテーパ表示法として
(2)
( 3)
とすれば
llmax(b) - llmax(a) =ムllmax 1 llOn(b) - llOn(a}ニムllOn ト llmin(b) - llmln(a) = .ð.llm1n J
.ð.llmax > .ð.llOn >ムllmln となる
たYし K 定 数
llmax(b)・ llmax(a) llOn(b}. llOn(a)
。max 8n llmln(b}. llmln(a) 8min よって, この試料は適格品と判定する。
この場合, 図示の測定長さをP点を中心に左 右に分けて同様の方法により測定すればテー 川 パーの直線性を知ることが出来る。 なお, 読 み取り位置a . P. b 点の確認は測定の正確"
さと, 操作上の簡易さから赤外線による発生 音によって感知させた。
における測定点 における測定点 における測定点
( 4)
(5)
b . a のインジケータの読み b . a インジケターの読み b . a インジケータの読み
図 6はその変換回路を示した。 図6 測定位置検出用変換回路 (光→音)
結 言
以上で軸穴の電気式改良型仕上げ及びテーパー精度簡易比較測定法についてのべた。
一方, 中小企業では今なお熟練者の養成に加えて人的不足が問題になっている現状から熟練を必要 としない簡易でしかも経済的にも考慮した本装置を試作し実用上の検討を加えた処非常に大きな有効 性があった。
参考文献
(1) 電気設備学誌 vo1. 8.19 88 p7 57�762
-14 -
柳瀬・高安:軸穴の電気式改良型仕上げ及びテーパー精度の簡易測定装置
Reformative Oevice for SimplifieØ finislli,l1g a,nd Accuracy Judgemenf Method of Bore Surface for Inserting Shaft.
Akio Yanase, Yuukichi Takayasu
Due to the shortfge of skilled workers, It is necessary to simplicfied method shave finishing and Accuracy judgment of Teper Bore surfaces, For the purpose various methods have been Deviced.
But there are Economical and other problems in them, and the manual finishing mostly depending and human sens is the present status. From this Viewpoint, the simplified finishing method which does not require skill and is easy, in addition, the Economical burden which is relatively light and the device which can confirm accuracy and simplified method. thus the effect in its practical use was obtained. Moreover, this device has such features that its operation can he simply carried out by anyone, and it can' be applied to finishing of bore surfaces in almost all specimens of this kind.
[英文和訳]
改良型軸穴仕上げ及び簡易精度判別装置
柳瀬 秋夫, 高安 勇吉
人的熟練者の不足に伴い, 軸穴テーパーの切削仕上げ及びその精度測定法が考えられているが, 経 済上, その他に問題があり殆ど人的感覚による手作業仕上げが現状である。 この観点から熟練を必要 としない, 簡単でしかも経済上比較的負担のない簡易仕上げ法及びその精度を測定出来る装置を試作 しその実用上の成果を上げた。 尚この装置の操作は 誰にでも簡単に出来てしかもこの種に関する殆ど すべての試料の軸穴仕上げに適用できる特長がある。
多孔質静圧気体スラスト軸受の安定性改善について
春山 義夫, 塩津 和章, 江幡 節男*
1 . 緒 言
多孔質静圧気体軸受は軸受面を多孔質材料で作りその背面から給気するもので, 大きな負荷容量や 軸受剛性を有する反面, 多孔質物質自体に存在する空洞のため動的安定性が悪く, 設計に当たっては 十分な配躍が必要である。
多孔質材料として一般によく用いられている焼結金属は機械加工によって表面に自詰まりを生じる が, これがかえってニューマチックハンマ不安定現象の発生防止に役立つている。 しかしながら, 近 年,軸受材料として多孔性セラミックス材が用いられるようになってきており円この場合には加工に よる表面白詰まりは生じなしニューマチックハン
マが生じやすいという欠点がある。 本論文では多孔 質静圧気体スラスト軸受の安定性を改善するために 多孔質面の背面に空気室を設けることを提案し, そ の効果を理論的に調べる。
2 . 理論解析
空気室
r 本論文で扱う多孔質軸受は図 1 に示す形状であっ
て, 多孔質材料の外側に円環状の固体部, いわゆる つばを有しており, 多孔質材料の背面に外半径 Y"
内半径 ら深さ�の円環状の空気室が設けられてい る。 加圧気体は半径九の給気孔より多孔質材料に送 られ, 多孔質表面から吹き出し軸受すきまを周囲へ と流れ出るときの圧力によって負荷を支えるもので
図1 多孔質静圧気体スラスト軸受の概略図
ある。
本報では, 多孔質材料内の気体の流動に関しては,
等価すきまモデル 2)3)4)を用いて解析することとし, 13 空気室内の圧力は場所によらず一様であり, 気体は ミ
等温変化をするものと仮定する。 また, 多孔質材料 の表面白詰まりはないものとする。
等価すきまモデルは, 図2に示されるように, 多 孔質材料内の気体の流れを軸方向と半径 方向に分け,
* 富山大学大学院
-16ー
‘ト幽ーーー
図2 等価すきまモデル
凡r
春山・塩津・江幡:多孔質静圧気体スラスト軸受の安定性改善について
軸方向流れについては無数の毛細管内の流れで, また, 半径 方向流れについては仮想的な平行薄膜(等 価すきま) 内の流れで置き換えて考えるものである。 等価すきま九は
he =V121<.,1 (1)
で与えられる。 ここに, 1<.,は多孔質材料の透過率である。 修正レイノルズ方程式は次のように与えら れる。
軸受すきま内:
, ← (σ旦手上-λ(P2_P2) 1 a rnTunaPl I RH3p ::::�� I一{I CJ
百五百l�U� � aR J- l _a(PH) 目
L‘' δτ
( 0孟R三五R1)1
(R1孟R孟1)I
等価すきま内:
qh'â子+(lz+λ)P2_aP hp2-J3PS2 1 δ r nñ aP 1 I � T aP
百否R l RP �R J = 1 qJ4 �子+五(P2_P2)
( 0;;五R�五Rs)
(Rs孟R話R2) qJ. δF 'â子+ (J2+ J3)p2-λP2_λPc2 (R2;;玉R�五R1)
上式において, 無次元 化は次の定義によっている。
P=i,P=Z HzfL 九 九' ん, ��r H一主主-ho' P.= .L 5 ρa' ょ Pa'�s . Pe=主 rn 2 � lλ 12uω( r.目、z
R=万, � =す,�=瓦, 戸ずは) , 一t,
ーにll/ T_� T_G1 T_�
一一一�r λ = ,:! , la = �l,
J4=一一
2 ' J3 - 2 ' J4 耳2
(2)
( 3)
ただし, h .軸受のすきま, ρ :軸受すきま内圧力, /5:等価すきま内圧力, hø :代表軸受すきま, Pa : 周囲圧力, Ps:給気圧力, Pc:空気内圧力, ω:代表円振動数, t :時間, λ:気孔率 である。
動特性の解析に当たっては, 平衡状態まわりの微小な正弦波振動を考えて, 軸受すきまおよび圧力 を次のように置いて解析する。
多孔質部 ( 0孟R三五九):
H1ニ1+εejT ì P1二�o+FItεeJτj P 1 =.Ro+F1tEejτj つば部 (R1孟R孟 1 ):
Hn=Hn+εeJT ì Pn=Pllo+FIItEejT J
(4)
( 5)
ただし, j=,j-1, Hn=�olhlO (hlO, �o:平衡状態におげる多孔質部およびつぱ部のすきま) であ る。
動的な圧力成分を解析的に求めることは困難であり, 本報 ではJレンゲ・クッタ・ギル法により数値 計算する。
軸受の剛性および減衰係数は, 軸受反力の変位と同位相成文および変位速 度と同位相成分により定 義される。 それぞれを, '1tがPa/høおよび'1tYo 2PaI (九ω) で無次元 化した無次元剛性K, 無次元減衰係
数Bは10個の無次元パラメータ Rt=η/九, R2 =η/η, Rs=九/ro, Gt, G2, Hn, PS, Hr, H c, σ(ス クイーズ数)で整理することができる。 なお, 本報では, 代表軸受すきまんとして平衡状態における 多孔質部のすきまh10をとる。
3 .計算結果と考案
図3から図5は空気室を設けることが無次元剛性K および無次元減衰係数Bに与える影響を調べ たものである。 図中, 実線は空気室を設けた場合の, 一点鎖線は空気室がない場合の値を示している。
図3, 4は横軸に軸受すきま比 耳=ん/んをとり, パラメーターとして空気室の無次元深さ民二九/
hto および無次元給気圧力九二九/Pa をとっている。 これらの図に見られるように, 空気室を設ける ことによって剛性は少し低下し, 減衰係数は耳 の小さい領域では低下するが民の大きい領域で増加 している。 すなわち, 軸受すきまの小さい領域で動的安定性が改善されていることがわかる。 図3よ り, 空気室の深さ圧のちがいによるK, Bの差はあまり大きくはないことが分かる。 図4より, 給 気圧力たのちがいによるK の差はあまり大きくはないが,Bについてはかなり大きく, Hrの小さい
ミc
0.4
。3
q4
・a
nu句。
ミ〈
0.1
。 - 0.1
0.1 r
図3 剛性, 減衰係数に及ぽす空気室の影響 。
-0.2
0.1 1 Hr 10
図4 剛性, ì威衰係数に及ぽす空気室の影響 - 18ー
春山・塩津・江幡:多孔質静圧気体スラスト軸受の安定性改善について
領域ではたが低いほど, Hrの大きい領域では九が高 いほど影響が大きいことがわがる。 図5はスグイーズ 数 σを横軸にとって示したものである。空気室を設け ることによって6 め比較的小さい領域 で減衰係数が 1 増加していることがわかる。
以上のことより, 多孔質体背面に空気室を設けるこ とによって, 減衰係数が負の値をとりやすい, 軸受す きまおよびスクイーズ数が小さい領域での動的安定性 を改善できることが期待できる。
4 . 結 言
多孔質静圧気体スラスト軸受の 多子L質体背面に空気 室を 設けるこ とによって, 比較的軸受すきま が小さし スクイーズ数も小さい領域で軸受の安定性を改善でき る可能性があることを示した。
参考文献
(1) 河島・十合:昭和63年 度精密工学会春季大会講演 前刷, 35, (1988).
(2) 森・矢部・小野:日本機械学会論文集, 2与一205,
1466, (1963).
(3) 佐藤・森:潤滑, 22-2, 101, (1977).
(4) 矢部・北浜・森:潤滑,• 26-1, 49, ••• (19 81).
(1989年10月25日 日本潤滑学会第34期全国大会(富 山 ) で発表)
�
0.1
句
0.1
0.01
一一一 割室付書
』ーーーー空気重なし
6
R1=0.6 R2= 0.4 R.= 0.3 61= 5
62=150 Hn=0.5 Hc=100 Hr= 2
σ 10 100
図5 剛性, 減衰係数に及ぽす空気室の影響
Improvement of Stabilization of Externally Pressurized Porous Thrust Gas Bearings
Y oshio HARUY AMA, Kazuaki SHIOZA W A and Setsuo EBA T A
The pneumatic hammer instability is frequently observed in externally pressurized porous gas. bearings and the寸cause of this instability is the compressibility of operating gas. In this report, a stabilizing method to use a pneumatic capacitance stabilizer is presented and analyzed.
The stabilizing effect of the stabilizer is remarkable when the bearing clearance is relatively small.
[英文和訳]
多孔質静庄気体スラスト軸受の安定性改善について
春山 義夫, 塩津 和章, 江幡 節男
多孔質静圧気体スラスト軸受は気体の圧縮性に起因するニューマチックハンマ不安定現象を生じや すい。 本研究では, 軸受の安定性を改善するために安定 化要素として空気室を設けることを提案し,
その効果を理論的に調べた。 安定 化要素による安定 化の効果は比較的軸受すきまのせまい領域で現れ た。
-20ー