The Study on the Interface of Carbon
Nanotube/Polymer (CNT/Polymer) Nanocomposites
by Raman and Tip-enhanced Raman Spectroscopy
著者(英)
Xinlei Yan
学位名
博士(理学)
学位授与機関
関西学院大学
学位授与番号
34504甲第479号
The Study on the Interface of Carbon
Nanotube/Polymer (CNT/Polymer)
Nanocomposites by Raman and Tip-enhanced
Raman Spectroscopy
A Thesis for the Degree
of
Doctor of Science
Submitted to
School of Science &
Technology
Kwansei-Gakuin University
By
Xinlei YAN
Contents
List of Symbols and Abbreviations' . . .
I
General Introduction' ...
1
Chapter 1: A Raman Spectroscopy Study on Single-Wall Carbon
N anotu be/Polystyrene
Nanocomposites:
Mechanical
Compression
Transferred from the Polymer to Single-Wall Carbon Nanotubes
Abstract· ... 29
Introduction' . . . ·30
Experimental Section' ... ·34
Results and Discussion' . . . ·36
Conclusion' . . . 45
References . . . ·46
Chapter 2: A Tip-enhanced Raman Spectroscopy Study of Single Wall
Carbon Nanotube/Polystyrene (SWCNT/PS) Nanocomposites: Mechanical
Compression Dispersion on Their Interface Depending on the Distribution
ofSWCNTs
Abstract· . . . ·60
Introduction' . . . ·61
Experimental Section' ... ·65
Results and Discussion' . . . ·66
Conclusion' . . . ·74
Chapter 3: Laser Heating Effect on Raman Spectra of Styrene - Butadiene
Rubber/Multiwalled Carbon Nanotube Nanocomposites
Abstract· . . . ·88
Introduction' . . . ·89
Experimental Section' . . . ·92
Results and Discussion' . . . ·94
Conclusion' . . . 101
References . . . 1 02
Acknowledgements' . . . ·110
AFM CNTs DMF IR MWCNTs PMMA PP PS RBM SBR SERS STM SWCNTs TERS
List of Symbols and Abbreviations
atomic force microscope
carbon nanotubes
N,N-dimethylformamide
infrared
multi-walled carbon nanotubes
poly (methyl methacrylate)
po I ypropy lene
polystyrene
radius breathing mode
styrene butadiene rubber
surface enhanced Raman scattering
scanning tunneling microscope
single-wall carbon nanotubes
General Introduction
1. Scope and Background of This Thesis
This thesis is mainly concerned with three aspects. One bright part in this thesis is the !ip-enhanced Ranlan scattering (TERS) spectroscopy was firstly applied on the research about the dispersion of single-walled carbon nanotubes (SWCNTs) in SWCNT/polystyrene (PS) nanocomposites and etfects of the dispersion on Raman bands of SWCNTs from PS. Another one is the investigation on mechanical compression transferred from the polymer (PS) to S WCNTs by using Raman spectroscopy and infrared spectroscopy. The final one is the study of laser heating effect on Raman spectra of multi-walled carbon nanotube (MWCNT) Istyrene-butadiene rubber (SBR) nanocomposites by Raman spectroscopy.
Characterized by both high aspect ratio (length-to-diameter) and low density~ CNTs have been considered as ideal nano-tillers or additives for polymer nanocOlnposites. Combining CNTs with polymer to form nanocomposites can produce the materials which have better mechanical properties than the single polYlner and transform an insulative polymer into a conductive polynler. In addition, the CNTs have great potential to enhance the mechanical properties of polymer nlaterials.
An interface of a polymer nanocomposite plays a key role in the study of the structure, interaction~ and mechanical properties of the conlposite for understanding
do not have enough space resolution to investigate them. In this thesis. both normal Raman and TERS spectroscopy, as a powerful spectroscopic tool, were lnainly en1ployed to extract important inforn1ation about the structure and interaction at the interfaces of CNT-based nanocomposites.
Raman spectroscopy is an excellent tool for interfacial investigations. It has been elnployed to probe interactions between a polymer and CNTs, such as the reinforcement n1echanism of CNT-filled polyn1er. connecting Inethod of CNTs and polymer. and polyn1er transition behavior. In general, the interactions between a polyn1er and CNTs are reflected as Raman peak shifts or changes in the band width. Raman spectroscopy can also be effectively used to quantify stress and strain transfer from surrounding environments to CNTs.
Recently. TERS has emerged as an intriguing Ran1an spectroscopic tool that combines scannIng probe mIcroscopy and Raman spectroscopy. Compared with normal Raman spectroscopy, TERS owns much higher spatial resolution and higher sensitivity. A typical interesting feature for TERS is that it allows a Inolecular view on small ensembles of molecules or even single molecules. In this thesis, TERS spectroscopy is firstly used to extract important information about the structure and interaction of interfaces of polymer composites including CNT-based nanocOlnposites.
2. Introduction of CNT -based composites a. CNTs: discovery, structure and applications
1991. I IIowever CNTs have been around for a n1uch longer tin1e before the report of Iijin1a. For example. Radushkevich and Lykyanovich firstly observed these ren1arkable n1aterials by experiment in 1952,2 whose work remains largely unknown to the scientific comlnunity. Nesterenko et al. reported carbon-based tubular nanostructures in 1982.
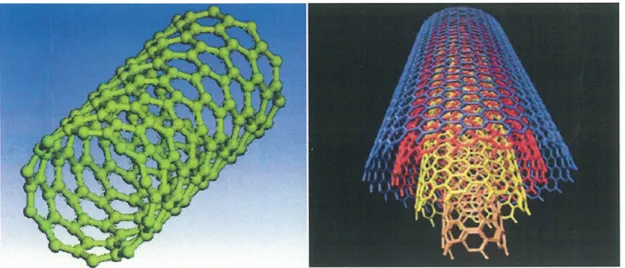
The structure. topology and size of CNTs are the premise for outstanding their n1echanical properties, fascinating electronic properties, and other promising applications. CNTs consist of one or more graphene sheets seamlessly wrapped into cylinder-shaped tubes, corresponding to SWCNTs or MWCNTs, respectively, as illustrated in Figure 1. The one-dimensional nanostructures endow them with high surface area, large aspect ratio and unusual physicochemical properties such as excellent electrical and thermal conductivities and mechanical strength. \:4-7
At the beginning of the twenty-first century. possible applications of nanotubes are being explored in medicine, electronics, energy. and polymers.8-15 CNTs have been embedded into various materials to produce con1posites with modified electrical conductivity, magnetic properties and optical properties. CNTs are also pron1ising candidates as a mechanical reinforcement phase in composite materials.16-18
h. CNT composites and their properties
amount of CNTs.19-21 A key parameter for producing high quality nanocomposite Inaterials with improved physical properties is the honl0geneous dispersion of the individual CNTs. However, the dispersion of CNTs in a polymer systenl is still a great challenge because of high Van der Wal interaction between neighboring CNTs and a large surface area of the tube.22 Another important requirelnent for a nanotube reinforced composite is that external stress applied to the composite as a whole are efficiently transferred to the nanotubes, allowing them to take a disproportionate share of the load.16 Moreover, large aspect ratio and alignlnent are also the nlain system requirelnents for effective reinforcement.
Many works have been done on physical properties and structure of CNT -based polymer nanocomposites. The potential of CNTs to achieve electrically dissipative or conductive composites was first demonstrated by Hypersion Catalysis International in their master batches containing MWCNTs.23 The first reference to the potential of CNTs as rnechanically reinforcing fillers for polymers was made indirectly by Ajayan
el al. in 1994 and directly in 1998 by Wagner et al. working on a composite of
MWCNTs with an UV cured in-situ polymerized urethane-diacrylate 0Iigomer?4:25 Kearns e{ aI. studied the mechanical properties of SWCNT/polypropylene (SWNT/PP). Mechanical tests in their work show that extrusion produeed SWCNT/PP fibres with 1 wt% SWNT have a tensile strength 400/0 higher than pure PP. Moreover, the modulus of the composite fibres is 550/0 higher than that of the PP fibre.26:27 In conclusion, nanotubes have great potential to be used as polymer nl0difiers to inlprove electric, magnetic and mechanical properties.
3. Raman spectroscopy
Ran1an spectroscopy is a spectroscopic technique used to observe vibrational, rotational, and other low-frequency modes in a system. It relies on Raman scattering of monochron1atic light usually from a laser in the visible, near infrared, or near ultraviolet range. RaInan scattering is the inelastic scattering of light. Figure 2 shows an energy level diagram illustrating Raman scattering for one vibration. If photons resulting from the return to the original vibrational level have the SaIne energy as before, it makes up the elastically scattered (called Raleigh scattered) light. When photons resulting from a return to a vibrational level one vibrational quantum are higher or one vibrational quantum lower than the original energy level, it makes up the Raman scattered photons. For the situation that photons at lower energy than the excitation photon energy because one vibrational quantun1 of energy was left in the molecule, it belongs to Stokes Raman scattering. On the other hand, for the situation that photons at higher energy because a vibrational quantum of energy was taken away from the molecule. it belongs to Anti-Stokes Raman scattering produces.28
The SUln of three tern1S can easily be shown by induced polarizability P of a molecule (the case with which the electron cloud can be distorted by an applied electrc field E):
(aa/8q)o is the rate of change a with respect to the change in q. evaluated at the equilibriunl. According to classical theory, the first ternl represents an oscillating dipole that radiates light of frequency Do (Rayleigh scattering), while the second term corresponding to the Ranlan scattering of frequency DO+Dm (anti-Stokes) and DO-Dm (Stokes). If (8a/aq)o is zero, the vibration is not Raman-active. Nmnely, to be Ranlan-active. the rate of change of polarizability (a) with the vibration must not be
29 zero.
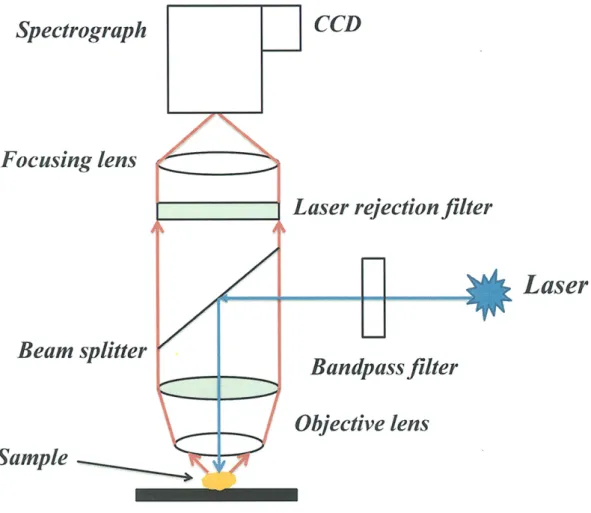
Figure 3 silnply illustrates arrangement of Raman spectrometer cOlnponents. Generally speaking. the commercially available Raman spectronleter is Inade up by five nlajor conlponents: (1) excitation source, which is generally a continuous wave (CW) gas laser; (2) sample illumination and scattered light collection systenl; (3) sample holdec (4) nl0nochromator or spectrogragh; (5) detection system, consisting of a detector. an amplifier and an output device.30
a. Raman spectra of CNTs
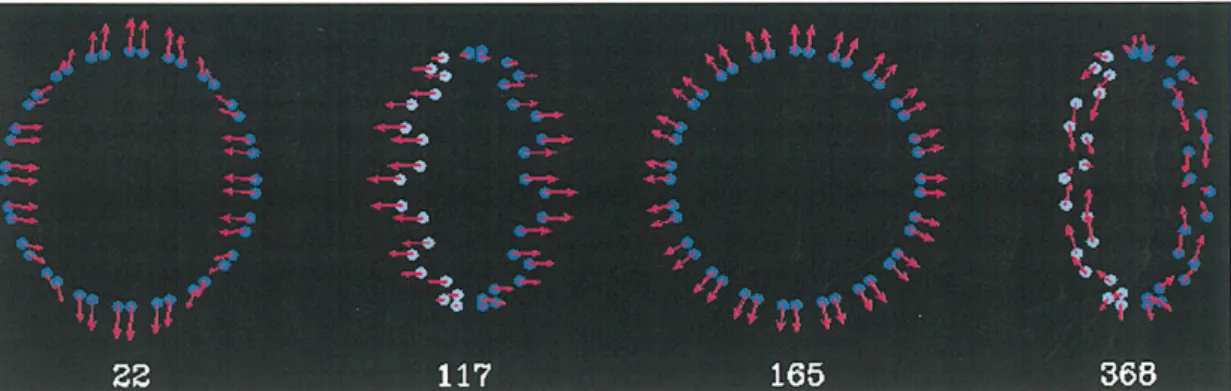
The Ranlan spectra of CNTs are shown as in Figure 4. For SWCNTs, its Raman spectra are composed by four main peaks. A prominent feature is the radial breathing nl0de (RBM) in the 160-300 cm-1 region, associated with a synlnletric nlovement of all carbon atonlS in the radial direction. The frequency of the RBM is inversely proportional to the diameter of individual nanotubes, and can be expressed by
WRBM = C/dt (em-i) (C is 248 cnl-1 mn for isolated SWCNTs)3! Figure 5a
illustrates the calculated RBM eigenvectors and frequencies for a (10, 10) nanotube by Rao e/ al.
The second peak, which is observed between 1250 and 1450 cn1-1, belongs to 0 Raman band of CNTs. Its vibrational mode is shown in Figure 5b. The 0 band has a linear dependence on the laser excitation energy, which has been assigned to be a double resonant process involving two resonant electronic states.33 Figure 5b displays single resonant (i----'?a) and double resonant process ((i----'?a) and (a----'?h». The 0 band is activated in the first order scattering process of Sp2 carbons by the presence of in-plane substitutional hetero-atoms, vacancies, grain boundaries or other defects and by finite-size effects, all of which lower the crystalline symmetry of the quasi-infinite lattice.2734 The 0 band is most sensitive to nanotube alignn1ent.35
The third peak in the range 1500-1600 cn1-1 is called G band. This band exists in all graphite materials. The G mode in SWCNTs gives rise to a multi-peak feature, where up to six Raman peaks can be observed in a first-order Raman process. However, a simple analysis can be carried out considering the two lnost intense peaks, which basically originate from the symmetry breaking of the tangential vibration when graphene sheet is rolled to make a cylindrically shaped tube. The two most intense G peaks are labeled G- (atomic displacen1ent along the circumferential direction) and G+ (atomic displacements along the tube axis).33:36 Figure 5c(left) shows the vibrational n10de of G- and G+. The lineshape of the G- feature can be used to decide the selniconducting and Inetallic SWCNTs, which is broadened for metallic SWCNTs in
can be used to investigate the load transfer of nanocomposites. It is also known as the state of tiller dispersion.-~5:37:38 Moreover the intensity ratio of D and G bands yield information about the amount of inlpurities and degree of disorder in CNTs, which help in the study of crystallinity.39
The last peak, nan1ed as G' band or 20 band, is identified in the range 2500-2700 cm-I. The SaIne as D band, G' Raman bands of CNTs also depend linearly on the laser excitation energy. These bands are not specific to CNTs, they are expected for Inost of carbonaceous materials.40 This band is not sensitive to the nanotube alignment but it can retlect polymer transition infornlation and has been used to evaluate the efficiency
t~ t~ b h i ' d b 414)
o stress trans er etween t e po ymer matnx an nanotu es.
,-Compared with SWCNTs, for the Raman spectra of MWCNTs, the RBM peak of MWCNTs is not easily detected, excepted a good resonance condition is established. Moreover. the splitting of G band becomes weak in MWCNTs because of the interactions between concentric tubes of ditferent diameters.
b. Raman spectra of CNT -based composites
CNTs embedded in polymers may achieve several roles. including use as orientation detectors as well as molecular sensors around structural defects and reinforcements.43A4 A large amount of research has appeared in the literature over the past decade, dealing with possible significant improvements in the mechanical and electrical properties of CNT -reinforced polymers.14;45-53 Anl0ng various tools for detecting properties of CNT -reinforced polymers, Raman spectroscopy plays a signiticant contribution. It can achieve a number of unique functions to detect
CNT/polymer composites.
One of the most in1portant functions is that Raman spectroscopy con1bined with mechanical testing provides a way to probe the aligmnent of SWCNTs in composites . .+3A6:52:53 For example~ in the work of Gommans el al. group~ 52 CNTs were oriented into bundles by applying an electric field between a carbon fiber and an ultrasonicated SWCNTIN,N-dimethylformamide (DMF) suspension, and polarized Raman spectroscopy was then used to quantify the alignment of CNTs as a function of the angle 8 between the fiber and the polarizer. A combination of solvent casting and n1elt mixing was used to disperse SWCNTs in poly(methyl methacrylate) (PMMA). and polarized Raman spectroscopy was again used to demonstrate the alignment of nanotubes in PMMA. More recently~ Frogley et a1.46 have perfonned a thorough study of nanotube aligmnent in polymers using polarized Raman spectroscopy, and compared a large amount of experimental results with existing n10dels such as those by Saito et a1. 5 I and Gon11nans el al.'+ 7. It was demonstrated that
a non-resonant theory (Saito~s) gives the most reasonable orientation distribution for the tubes.
Another in1portant function is that Ran1an spectroscopy has been used to probe the interaction between polymers and nanotubes in nanotube-based composites.45:48-50 Cooper et aI. 50 investigated the deformation micromechanics of SWCNTs and
SWCNTs dispersed in the cOtnposite could be over 1 TPa and that of MWCNTs about 0.3 TPa. Bokobza et aI.45 investigated a strain dependence of MWCNT/SBR using Raman spectroscopy and detected a lower wavenumber shift of a G band. which indicates a stress transfer interaction between CNTs and the polymer.
In chapter 1. the mechanism of the shifts in the Raman bands of the CNTs in the nanocomposite systetn was analyzed in detail. Mechanical compression of the SWCNTs by the PS was considered the tnain reason for the G band shift. I also found that the shift of the RBM to higher wavenumber was caused by two factors: a van der Waals effect due to separation of S WCNTs and the mechanical compression by the PS matrix. In chapter 3. I reported the effects of laser heating on MWCNTs in MWCNT/SBR composites. The self-rearranging behavior of the MWCNTs in the nanocomposites was investigated by observing laser-induced Raman spectral variations. These works show that. since CNTs are sensitive to their environn1ent. Ran1an spectroscopy is a useful and reliable tool for the investigation of nanotube-polymer interactions and can be used for the research of CNT -based con1posites.
4. Tip-enhanced Raman spectroscopy
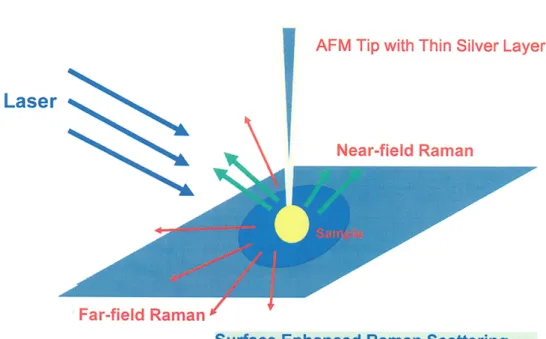
TERS is a very powerful variant of surface enhanced Ran1an spectroscopy (SERS).54-56 It operates on all adsorbate/substrate configurations. where the substrate may be rough or sn100th, or even single crystalline. and can be either a metal. a semiconductor. or an isolator and where the adsorbate mayor may not be in optical resonance with the exciting laser line. Due to the strong localization and height of the
optical near-fields underneath thc tip, TERS delivers with very high sensitivity, via RaInan spectroscopy. chen1ical information on the nanometer scale.
The crucial part of TERS is the combination of a scanning probe device with a Raman spectrograph, where the scanning probe device can be an atomic force Inicroscope (AFM) or a scanning tunneling microscope (STM). Figure 6a illustrates the schematic diagran1 of TERS. The laser beam is focused at a metal tip with the light polarized along the tip axis, and the surface-enhanced Raman scattered light is collectcd from the sample in the enhancement zone of the tip by using corresponding optics. One of the first TERS experiments achieved this by adapting the inverted n10de configuration which involves illuminating samples from below with a tip approaching frOln above.55 While this arrangement has the advantage of high collection efficiency, it is lin1ited to the study of transparent samples only. For opaque saInpies, the tip and laser beam will have to be introduced from one side or coated transparent probes will be used for illumination. 57-59 Figure 6b display a schematic diagram of TERS which showing the arrangement of the TERS system in an upright configuration. In this design, the laser beam is focused and the scattered light is collected by the SaIne objective. In this thesis, the TERS system I used is the same with this systen1 in Figure 6b. The TERS tip normally is an AFM tip covered with a thin layer of Ag or Au or an STM tip, usually made of a thin Ag or Au wire having a
resolution and sensitivity. A typical interesting feature of TERS is that it allows molecular-scale views of snlall ensembles of molecules or even single nl0lecules. Thus, TERS has been proved to be a unique tool for exploring very small portions of conlplicated Inaterials such as graphene, DNA, and so on.61-66 Many works related to the TERS study of CNTs also has been investigated.59:67-71 For example, Hartschuh et al.67 have shown for the first tinle tip-enhanced Raman images of SWCNTs with spatial resolution better than 30 nm. The authors used sharp silver tips as near-field probes. The high resolution achieved in these experiments nlade it possible to resolve local variations in the Raman spectrum along an isolated SWCNTs, which would otherwise be hidden in far-field measurements. Peica et al. 72 reported the local character of Raman features of S W CNTs along a bundle by TERS. The result shows that Ranlan intensity of G nl0de in TERS is strongly dependent on the height of the bundle. The author used TERS to position different SWCNTs along a bundle, by correlating the observed RBM with the AFM topography at the measuring point.
By using TERS spectroscopy, I analyzed the distribution of SWCNTs in the SWCNT/PS nanocomposites, the mechanical cOlnpression from PS, and the oriented behavior of SWCNTs. The G- and G+ bands of SWCNTs in the SWCNT/PS conlposites were detected from point to point which denotes a distribution infornlation of SWCNTs in SWCNT/PS system, and suggests Inechanical compression varies fronl point to point. The variations in the ratios of G bands (the G-/G- ratio and the G+
Ict
ratio between the TERS and normal Raman spectra) nlay be ascribed to the reason of an orientation behavior of SWCNTs in the SWCNT/PScomposites. Interestingly, I also found that in the TERS spectra of SWCNT/PS composites, the
ct
band shows a stronger enhancement than the G-band which can be concluded that in TERS, the carbon-carbon vibrations along the axis direction (0+ band) are in stronger resonance with laser light than the carbon-carbon vibrations along the circumferential direction (CY band) because of the tube structure of SWCNTs and the orientation ofSWCNTs on the interface ofSWCNT/PS composites.5. Originality and novelty of this thesis
1. Through analyses of the normal Ran1an spectra of pristine SWCNTs and SWCNT/PS nanocOlnposites, determined that when SWCNTs are incorporated into the PS matrix, the upshift of
cr.
G +, and G' of SWCNTs are induced exclusively by a mechanical compression transfer from PS to the SWCNTs. Interestingly, I found that the upshift of the RBM was dominated by two factors: a van der Waals effect due to separation of the SWCNTs and mechanical con1pression fron1 the PS system~2. Through the study of normal Raman and TERS spectra of S WCNT/PS nanocomposites, I found that the normal Ran1an spectra did not show any evident point-to-point variation. In contrast, in the TERS spectra, the 0- and G+ bands of SWCNTs show obvious point-to-point variation. This result yields information about the distribution of SWCNTs in the SWCNT/PS system and
Raman and TERS speetra. Moreover, I determined that a stronger enhancenlent of G+ band than G- band is due to the tube structure of SWCNTs and the orientation of S WCNTs on the interface of S WCNT/PS composites. 3. By investigating the laser heating effect on the Ranlan spectra of
MWCNT/SBR nanocomposites, I found that the intensity ratio of the D to G band of MWCNT/SBR composites largely decreased with temperature. This indicates the self-rearranging behavior of MWCNTs in the MWCNT/SBR system during temperature increase. In addition, the temperature-dependent downward shift of the G band of MWCNT/SBR composites was smaller than that of MWCNTs samples. The self-rearrangement of MWCNTs in MWCNT/SBR composites and a mechanical compression were explained as two possible reasons for the different behavior of the G band shift.
6. Outline of each chapter
The outline of the present studies will be described as follows. This thesis consists of three chapters.
Chapter 1 describes the interactions between SWCNTs and PS inside the SWCNT/PS nanocomposites by Ratnan and infrared spectroscopy. A higher wavenumber shift of G~,
C/.
and G' SWCNTs bands were detected in Raman spectroscopy when incorporated into the nanocomposites. This upshift was proved to be induced exclusively by a nlechanical conlpression transfer from PS to the SWCNTs. From the magnitude of the upshift, the nlechanical conlpression transfer was estimated to be ",518 MPa. By companng the Raman spectra of pristineSWCNTs and SWCNTs in ethonal~ it was proved that the upshift of the radial breathing nl0de was dominated by two factors: a van der Waals effect due to separation of the SWCNTs and mechanical conlpression from the PS system. The laser heating effects on pristine SWCNTs and on the nanoconlposites \vere also studied in this chapter 1.
Based on the study of chapter
L
chapter 2 reports the distribution of SWCNTs in SWCNT/PS nanocomposites~ the mechanical cOlnpression due to the PS~ and the orientation behavior of the SWCNTs using TERS. The G- and G+ bands of the SWCNTs in the SWCNT/PS composites were detected at different points~ which provided infonnation about the distribution of SWCNTs in the SWCNT/PS system and suggested that the lnechanical compression varies from point to point. The variations in the ratios of the G bands (the G-IG- ratio and the G+/G+ ratio between the TERS and normal Raman spectra) may be ascribable to the orientation behavior of the SWCNTs in the SWCNT/PS composites. Interestingly~ I also found that in the TERS spectra of the SWCNT/PS composites~ the G+ band shows a stronger enhancement than the Cf band. According to the conditions required for resonance between molecular vibrations and laser light~ it can be concluded that in TERS, the carbon-carbon vibrations along the axis direction (G + band) are in stronger resonancenanocon1posites. Raman spectra show that the intensity ratio of the 0 band to G band (I ()/I(i) of MWCNT/SBR composites largely decreased with temperature. This
indicates the self-rearranging behavior of MWCNTs in the MWCNT/SBR system during ten1perature increase. In addition, the temperature dependent downward shift of the G band of MWCNT/SBR composites was smaller than that of MWCNTs samples. This phenomenaon was explained by the self-rearrangement of MWCNTs in MWCNT/SBR composites and a mechanical compression.
References
1. Iijin1a. S. Nature 1991, 35..f. 56-58.
2. Lukyanovich, V. M.~ Radushkevich, L. V. ZhFiz.Khim. 1953,26,88-95. 3. Nesterenko, A. M.~ Kolesnik, N. F.~ Akhmatov, Y. S.~ Sukhomlin, V. I.~
Prilutskiy, O. V. Rw·,/,,'.lvfetall. 1982,14-17.
4. Iijin1a, S.~ Ichihashi, T. Nature 1993, 363, 603-05.
5. Bethune, D. S.; Kiang, C. H.~ Devries, M. S.; Gorman, G.~ Savoy, R.; Vazquez, J.; Beyers, R. Nature 1993,363,605-07.
6. Sgobba, V.~ GuIdi. D. M. Chem.Soc.Rev. 2009,38,165-84.
7. Loiseau, A.; Launois, P.; Petiti, P.; Roche, S.; Salvetat, J.-P. Understanding Carbon Nanotubes fron1 Basics to Application, Springer: 2006.
8. Chowdhury, E. H.; Akaike, T. Curro Gen. Ther. 2005, 5, 669-76.
9. Fisher, C.; Rider, A. E.; Han, Z. J.; Kmnar, S.; Levchenko, I.; Ostrikov, K .
.!Nanomater. 2012.
10. Kostarelos, K.; Lacerda, L.; Partidos, C. D.; Prato, M.; Blanco, A .
.!Dru. Deli. Sci. Tech 2005, 15, 41-47.
11. Ouyang, M.; Huang, J. L.; Lieber, C. M. Acc.Chem.Res. 2002,35,1018-25. 12. Zhao, Y. P.; Wei, B. Q.; Ajayan, P. M.; Ramanath, G.; Lu, T. M.~ Wang, G. C.~
Rubio, A.; Roche, S. Phys. Rev. B 2001, 64, 201402-1-4.
13. Hino, S.; Miyazaki, N.; Iwasaki, K.; Kondo, S.; Saito, Y. Synthlvfet. 2001, 121, 1213-14.
14. Chipara, M.; Zaleski, 1. M.; Hui, D.; Du, C. S.; Pan, N . .!Polym.Sci.Part B 2005, ..f3, 3406-12.
15. Srebnik, S . .! Polym.Sci. Part B 2008, -16, 2711-18.
19. Kun1ar, S.~ Dang, T. D.~ Arnold, F. E.~ Bhattacharyya, A. R.~ Min, B. G.~ Zhang. X. F.~ Vaia, R. A.; Park, C.; Adams, W. W.; Hauge, R. H.; Sn1alley. R. E.~ Ramesh, S.; Willis, P. A. Macromolecules 2002, 35. 9039-43.
20. Zhao, P.; Wang, K.; Yang, H.; Zhang, Q.~ Du, R. N.; Fu, Q. Polymer 2007, ..f8,
5688-95.
21. Sandler, 1. K. W.; Kirk, 1. E.; Kinloch, I. A.; Shaffer, M. S. P.; Windle, A. H.
Polymer 2003, ..f.:f., 5893-99.
22. Kharisov, B. 1.; Kharissova, O. Y.; Gutierrez, H. L.; Mendez, U. O.
fnd. Eng Chem.Res. 2009,48,572-90.
23. Tennent H. G. Carbon fibrils: method for producing same and compositions containing same. 4[663], 230. 1987.
Ref Type: Patent
24. Ajayan, P. M.; Stephan, 0.; Colliex, C.; Trauth, D. Science 1994,265,
1212-14.
25. Wagner. H. D.; Lourie, 0.; Feldn1an, Y.; Tenne, R. AppI.Phy,",'.Letl. 1998,72, 188-90.
26. Kearns, 1. C.; Shan1baugh, R. L. Journal qlApplied Polymer Science 2002, 86, 2079-84.
27. Zhao, Q.~ Wagner, H. D. Philos. Trans.R.Soc.London. 5,'er.A 2004,362. 2407-24.
28. Pelletier, M. 1.; Pelletier, C. C. Rmnan, Infrared, and Near-infrared, Chemical hnaging, Ozaki. Y., Ed.; Wiley: 2010; Chapter 1.
29. Ferraro, J. R.; Nakamoto, K. Introductory Raman Spectroscopy, Ferraro, 1. R.; Nakamoto, K., Eds.; Acaden1ic Press: 1994~ Chapter 1.
30. Ferraro, J. R.~ Nakamoto. K. Introductory Raman Spectroscopy, Ferraro, J. R.; Nakamoto, K., Eds.; Acaden1ic Press: 1994; Chapter 2.
31. Jorio, A.; Saito. R.; Hafner, J. H.~ Lieber, C. M.; Hunter. M.; McClure, T.; Dresselhaus. G.~ Dresselhaus, M. S. Phys. Rel'.Lett. 2001, 86, 1118-21. 32. Rao, A. M.; Richter, E.~ Sandow, S.; Chase, B.; Eklund, P. C.; Williams, K.
A.; Fang, S.; Subbaswamy, K. R.; Menon, M.; Thess, A.; Slnalley, R. E.; Dresselhaus, G.; Dresselhaus, M. S. Science 1997,275,187-91.
Dresselhaus, M. S.; Dresselhaus. G.; .lorio, A.; Souza, A. G.; Saito. R. Carhon
34. Jorio, A.~ Pilnenta, M. A.~ Souza. A. G.~ Saito, R.~ Dresselhaus. G.;
Dresselhaus. M. S. JPhys. 2003, 5. 1-17.
35. AbbasL S.~ Carreau. P. J.; Derdouri. A.; Moan, M. Rheolof;ica Acta 2009, 48. 943-59.
36. Rao, A. M.; Richter, E.; Bandow. S.; Chase, B.; Eklund. P. C.; Williams. K. A.; Fang, S.; Subbasw'anlY. K. R.; Menon. M.; Thess. A.; Slnalley. R. E.: Dresselhaus. G.; Dresselhaus. M. S. Science 1997,275, 187-91.
37. Tonlanek, D.; Jorio. A.; Dresselhaus, M. S.; Dresselhaus, G. Carbon Nanotubes. Jorio. A.; Dresselhaus. M. S.Dresselhaus. G., Eds.; 111 ed.; Springer: 2008~ Chapter 1.
38. Wang. S. R.; Liang. R.: Wang. B.: Zhang. C. Chem.Phys.Lett. 2008, 457, 371-75.
39. Potschke. P.; Brunig. H.: Janke, A.; Fischer, D.; Jehnichen, D. Polymer 2005, 46, 10355-63.
40. Sauvajol. J.-L.; Anglaret, E.; Rois. S.; Stephan, O. understanding carbon nanotubes from basics to application, Loiseau. A.; Launios. P.; Petiti, P.; Roche, S.Salvetat, J.-P., Eds.; Springer: 2006; Chapter 5.
41. Zhao, Q.: Wood, J. R.; Wagner. H. D. JPolym.S1
ci.Part B 2001,39,1492-95. 42. Kao. C. C.; Young. R. J. Compos. Sci. Techno!. 2004, 64,2291-95.
43. Wood, J. R.; Zhao. Q.; Wagner, H. D. Co mp(N·;ite,\' Part A 2001,32,391-99. 44. Hu. N.; Karube. Y.; Arai, M.; Watanabe, T.; Yan, C.; Li, Y.; Liu, Y. L.;
Fukunaga, H. Carhon 2010, 48. 680-87. 45. Bokobza, L. Macromo!.Symp. 2011, 305. 1-9.
46. Frogley, M. D.; Zhao, Q.; Wagner. H. D. Phys.Rev.B 2002, 65, 113413-1-4. 47. Haggenmueller, R.; Gommans, H. H.; Rinzler, A. G.; Fischer. J. E.: Winey. K.
I. Chem.Phys.Lett. 2000,330.219-25.
51. Saito, R.~ Takeya, T.; Kimura, T.~ Dresselhaus~ G.; Dresselhaus, M. S.
Phys.Rev.B 1998,57,4145-53.
52. Gommans, H. H.; Alldredge, 1. W.; Tashiro, H.; Park, 1.; Magnuson, 1.; Rinzler, A. G. JApp!.Phys. 2000, RR, 2509-14.
53. Wang, Q.; Dai, 1. F.; Li, W. X.; Wei, Z. Q.; liang, 1. L. Compos.S'ci. Technol.
2008, 6R, 1644-48.
54. Pettinger, B.; Schmnbach, P.; VillagOlnez, C. J.; Scott, N. Annual Review
ql
Physical Chemistry, Vol 63 2012, 63. 379-99.55. Stockle. R. M.; Suh, Y. D.; Deckert, V.; Zenobi. R. Chem.PhY5/.Lett. 2000,
3IR.131-36.
56. Anderson, M. S. App!. PhY5,'. Lett. 2000, 76.3130-32.
57. lahncke, C. L.; Paesler. M. A.; Hallen, H. D. Applied Physics Letters 1995, 67,
2483-85.
58. Hallen, H. D.; Larosa, A. H.; lahncke, C. L. Physica .)'tatu,\' Solidi A-Applied Research 1995, J 52,257-68.
59. Chan, K. L. A.; Kazarian, S. G. lVanotechnology 2011,22, 175701.
60. Yeo, B. S.: Stadler. J.; Schmid, T.; Zenobi, R.; Zhang, W. H. Chem.Phys.Lett. 2009, 4 1-13.
61. DOlnke, K. F.; Zhang, D.; Pettinger, B. JAm. Chem.Soc. 2007, J 29, 6708-09. 62. Pettinger, B.; Ren, B.; Picardi, G.; Schuster, R.; Ertl, G. Phys.Rev.Lett. 2004,
92. 0961 0 1-1-4.
63. Ichimura, T.; Watanabe, H.; Morita, Y.; Verma, P.; Kawata, S.; Inouye, Y.
JPhys.Chem.C 2007, 111,9460-64.
64. Saito, Y.; Motohashi, M.; Hayazawa, N.: Iyoki. M.; Kawata, S. Appl.Phys.Lett.
2006,8R.143109-1-3.
65. Saito. Y.: Verma. P.; Masui, K.; Inouye. Y.; Kawata. S. JRaman Spectrosc.
2009, 40, 1434-40.
66. Wang, P. J.; Zhang. D.; Li, L. L.; Li. Z. P.; Zhang, L. S.; Fang, Y. Plasmonics 2012, 7, 555-61.
67. I-Iartschuh, A.; Qian, H.; Georgi, C.; Bohn1ler, M.; Novotny, L.
68. Goss, K.~ Peica, N.~ Thonlsen, C.~ Maultzsch, J.~ Schneider, C. M.~ Meyer, C. Phys.Stat.Soli.B 2011,2-18.2577-80.
69. Wang, R.; Wang, J.~ Hao, F. H.; Zhang, M. Q.; Tian, Q. Appl.Opt. 2010, -19, 1845-48.
70. Wu, X. B.; Wang, J.~ Wang, R.; Xu, J. Y.; Tian, Q.; Yu, .T. Y. Spectrosc.Spec.Anal. 2009, 29, 2681-85.
71. Wu, X. B.; Zhang, M. Q.; Wang, J.; Tian, Q. J Kor. Phy";. Soc. 2010,56, 1103-08.
Incident light
Virtual
energy
states
Vibrational
energy states
Scattered light
Sample
---
~
~
~
----
-+-+
---~
~
+-
-
4
---~~~---+~~---~+--3
- - ---+----+-2
1
----~---~--~---~---~--0
Infrared
absorption
Rayleigh
scattering
Stokes
Raman
scattering
Anti-Stokes
Raman
scattering
Spectrograph
Focusing lens
Beam spiitter
Sample _
} - - - iCCD
Laser rejection filter
Bandpass filter
Objective lens
Figure 3: Schematic diagram of Raman system.
RBJ\I
A:
234 cm-
1.nm
B: 10 cm-
1 D G· + G 2Do
500
1000 1500 2000 2500 3000 3500
Wavenuluber/cn1-
1
Figure 5a: RBM eigenvectors and frequencies of SWCNTs. The red arrows indicate
the magnitude and direction of the appropriate C-atom displacements.36
(a)
Figure 5b: the vibrational mode of D band (a), single resonance Raman process (b)
and double resonance Raman process ( c).
HOPG (\ , 582 ; \ j \ ./ "--.--.-~
/\
~~~-;-. . -axis-
~
:~
iR
Ba-
-/
\
::;
_
_
~:::v~~__
_
_
J/ "._--. __ ._ .. __ _l
Figure 5c: the vibrational mode of G band (left), and G band for highly ordered
pyrolytic graphite (HOPG), MWCNT bundles, one isolated semiconducting SWCNTs
AFM Tip with Thin Silver Layer
Surface Enhanced Raman Scattering
Figure 6a: The schematic diagram of Tip-enhanced Raman scattering (TERS).
Long working distance objective ~+-~AFM cantilever stage Notch filter
Figure 6b: The setting drawing of TERS.
Diffraction grating and CCD camera Optical mask 1 -- - - , Raman laser ' r- - - -r -____ ~beam
~
---====,
ObjectiveI
Chapter 1
A Raman Spectroscopy Study on Single Wall Carbon
Nanotube IPolystyrene Nanocomposites: Mechanical
Compression Transferred from the Polymer to Single-wall
Abstract:
Single-wall carbon nanotube/polystyrene (SWCNT/PS) nanocomposites were prepared by solution coagulation. Characterization was performed using Rmnan and infrared spectroscopy to elucidate the interactions between the SWCNTs and PS inside the nanocomposites. It was found that the G-, G-t, and G' SWCNT bands shifted to higher wavenun1bers when incorporated into the nanocomposites. I detern1ined that this up-shift was induced exclusively by a mechanical compression transfer fron1 PS to the SWCNTs. From the n1agnitude of the up-shift, the mechanical compression transfer was estimated to be approximately 518 MPa. Interestingly, I found that the up-shift of the radial breathing mode was don1inated by two factors: a van der Waals effect due to separation of the SWCNTs, and mechanical compression from the PS system. A cOlnparison of the laser heating effects on pristine SWCNTs and on the nanocomposites showed that thermal expansion of the SWCNTs in the nanocomposites was suppressed by the n1echanical compression from the PS system. The combination of Raman and infrared spectroscopy enabled detailed characterization of the interactions occurring the nanocomposites, which cannot be achieved using other conventional methods.
Introduction
Carbon nanotubes (CNTs), since they were discovered by Iijin1a et a1. in 1991, I have attracted great interest due to their unique structure and n1echanical and electrical properties.2-4 CNTs are very promising materials for applications such as nanoelectronic devices,s:6 probe tips for scanning probe microscopes,7:8 and field en1itters.9:lO They have also been regarded as excellent fillers for polymer nanocOinposites. II CNTs possess a high elastic modulus which makes them even stronger than steel, in addition to high electrical conductivity. By combining CNTs with polymer to form nanocomposites, a material can be produced that has better mechanical properties than the polymer alone and transforms an insulator into a conductor.12-14 To obtain ideal CNT-based composites, it is critical to achieve a uniforn1 dispersion of CNTs in the polymer n1atrix and strong CNT-polyn1er adhesion. The n10st commonly employed methods for preparing CNT/polyn1er composites are
1 . d' I':; I d' 16 d . . I . . 17
so utlOn compoun lng, . me t compoun lng, an In SItu po ymenzation.
Much effort has been devoted to investigating the proper dispersion of CNTs and the interactions at the CNT Ipolymer interfaces within the composites in order to further improve the properties of polymers in CNT-based nanocomposites. Bokobza et a1. have successfully prepared many kinds of CNT-based polymer nanocomposites including multi-wall CNT (MWCNT)/poly-( dimethylsiloxane) (PDMS) composites. 18-20 The characterization of the MWCNT/PDMS composites revealed that their n1echanical properties were significantly better than those of MWCNTs dispersed in a PDMS n1atrix alone and that well-dispersed CNTs allow the formation of a conductive interconnecting filler network even at a very small loadings (50/0 19 Bokobza et al. also prepared MWCNT/styrene-butadiene rubber (SBR)
composites, which they used to demonstrate the capability of CNTs to impart conductivity to insulating elastomeric matrices. 1:22 Reinforcen1ent of SBR by n1ixing
carbon black (CB) and MWCNTs was also investigated, and the results indicated that this n1ethod of double loading improved the dispersion of nanotubes in SBR.22
Takeda et al. 23 investigated the electrical properties of CNT-based polycarbonate (PC) composites both theoretically and experimentally. They developed an analytical model that accurately predicted the composite electrical conductivity in saIl1ples that were elnpirically characterized. The CNT geometry was found to play an important role in the nanocomposite electrical properties, in particular, that the straightening of sufficiently long nanotubes markedly improved the conductivity of the composites.
Adohi et al. 24 performed a comparative study of CNT and CB-based composites with the same polymer. SBR. Con1pared with the CB composites, the CNT-based composites possessed a much lower conduction threshold. Further characterization revealed that the mechanical and n1icrowave properties of the nanocomposites were related to changes in the meso structure, which were induced by the heterogeneous three dimensional interconnected network of polymer and aggregated filler particles. This study provided new insight into the understanding of multifunctional materials.
Many physical-chemical analytical methods have been used to investigate the propeliies of CNT based nanocomposites, including high-resolution transmission
thermogravimetric analysis (TGA) for investigation of thennal properties. 25-30
Raman spectroscopy. as a non-destructive structural analysis method~ has been proved to be a powerful tool for studying structure, orientation~ and physical properties of CNTs and CNT-related materials.31-33 It can effectively determine parameters such as the degree of purity. chirality, diameter, electronic structures, and structural modifications. Shift in the G bands, which are characteristic of SWCNTs, reflect the effects of external forces on CNTs, such as mechanical compression and thermal expandsion.3435 Raman spectroscopy has also been extensively used for obtaining infonnation about CNT Ipolymer interfaces within composites. Potschke et al. studied the polarized orientation of CNTs in CNT/PC composites by Ran1an spectroscopy, which is related to their conductivity.36 Bokobza et al. investigated the strain dependence of MWCNT/SBR using Rmnan to elucidate the stress transfer at the interface between MWCNTs and SBR.37 I have reported the effects of laser heating on MWCNTs in MWCNT/SBR composites.38 By observing laser power-induced Raman spectral variations~ I investigated the self-rearranging behavior of MWCNTs, changes in the number of defects and the degree of disorder in MWCNTs, and mechanical compression of MWCNTs by SBR in composites of these two materials.
In this report. describe my investigation of the interactions at SWCNT/polystyrene (PS) interfaces in nanocomposites using Raman spectroscopy. SWCNT/PS cOlnposites with different loading of SWCNTs were prepared by solution coagulation. Influences on the vibrational modes of the SWCNTs, such as distribution of SWCNTs in an ethanol solution and mechanical compression on the SWCNTs by
PS. were analyzed in detail. Laser power-dependent Raman experiments were conducted to investigate the differences in thermal behavior between pristine SWCNTs and those in SWCNT/PS composites~ revealing significant differences betw"een the tw'o samples. The mechanism underlying these differences can be explained by influences on the vibrational modes of the SWCNTs. Infrared spectroscopy was also employed to investigate the interaction n1echanism at the interface ofSWCNTs and PS.
Experiment Section
A. Materials
PS (mw=1.25 x 1 OS g·lTIOrl) was manufactured by Polysciences~ Inc. (USA). SWCNTs less than 2 nnl in diameter and 5-30 /-lm in length were purchased from Strem Chemicals~ Inc. (USA) and used without further purification. All other chenlicals were analytic grade and were acquired from Wako Company (Osaka. Japan) and used without further purification.
B. Preparation of SWCNT/PC Nanocomposites
An appropriate amount of SWCNTs was dissolved In absolute ethyl alcohol (C2HsOH) and the solution was ultrasonically mixed for 45 min to achieve uniform
dispersion. PS was dissolved in dichloromethane (CH2Cb) to nlake a 1.3g/mL
solution and heated at 70°C until completely dissolved. The SWCNTs and PS solutions were con1bined and mixed with a nlagnetic stirrer until no further coagulations formed. The coagulations were transfened to an evaporating dish overnight to remove the solvent on the surface. Total ren10val of any renlaining solvent was achieved by heating the coagulations in a vacuum oven for one day at 110°C. The samples were finally pressed into films at 110°C for 10 min under a pressure of 60 bar. I prepared SWCNT/PS samples with three different loadings of SWCNTs~ 0.5, 1, and 3 % w/\v. A film of unfilled PS was prepared under the same
conditions for comparison. C. Raman Measurements
An Ar ion laser (Spectra Physics) emitting at 514.5 nn1 was used for Raman excitation. A 0.1 m W laser beam was focused onto a spot 1-2 ~m in dimneter, producing a power density of 102_104 W /cn12. A RS-2100 Raman spectrophotometer (Photon Design Inc.) equipped with a CCD detector (Princeton Instrument) and with a resolution of ~3 cm-1 was employed for Raman measuren1ents. A laser beam with power ranging from 12.5 ~ W to 1 m W was used for laser power-dependent Ran1an experiments.
D. IR Spectra Measurements
Transn1ission IR spectra were recorded at a spectral resolution of 2 cm-1 at room temperature with a Thermo Nicolet NEXUS 8710 Fourier transform IR spectrometer equipped with a detector (Waltham. MA, USA). To ensure a high signal-to-noise ratio,
Results and Discussion
A. Raman Spectroscopic Investigation
Ratnan spectroscopy has been extensively used to investigate CNT and CNT-based n1aterials, and Raman band assignments of CNTs have been well established.39-41 A
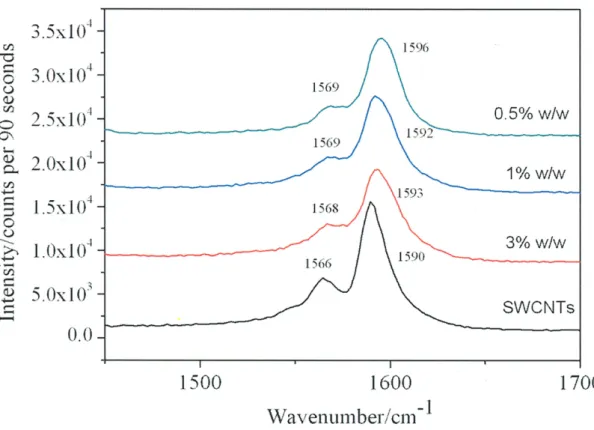
series of bands located from 120 to 350 cm-I has been assigned to the radial breathing mode (RBM), which indicates the length and the dian1eter of SWCNTs. By using a tunable laser, the electronic structure of SWCNTs can be studied through comparing the intensity of RBM peaks.42 All carbon materials show a Ran1an band at around 1580 cm-I assigned to G band. For SWCNTs, the G band separates into two components. One located at around 1590 cm-I (G+) is due to vibration of carbon atoms along the nanotube axis and is sensitive to charge transfer from dopant additions to SWCNTs. Another at around 1570 cm-I (G-) is assigned to a vibration of carbon atoms along the circumferential direction of SWCNTs. An additional band is observed near 1355 cm-l called the D band, which is associated with defects or disorder in CNTs, such as amorphous carbon, vacancies, and heteroatoms. The origin of the D band is thought to be a double resonance process. The G' band, which is the overtone of the D band, is located at around 2700 cm-I. Raman shifts of the CNTs bands can be induced by external influences such as temperature, pressure. and excitation wavelength.
Figure la-c shows Raman spectra of (a) pristine SWCNTs, (b) SWCNT/PS con1posite (30/0 w/w). and (c) PS. The RBM band. G- and Gl-bands. D band, and G'
band are identified at 178,1566.1590.1333, and 2667 cm-I• respectively. From the wavenulnber of RBM band. the diameter of SWCNTs can be estin1ated using the formula:
where A is 234 cm-I and B IS 10 cm-I.43 By excluding the effects from laser illumination, it was found that the RBM peak with the highest intensity in Figure 1 a corresponded to a CNT w'ith a diameter of 1.39 nm~ in other words, a CNT with dian1eter 1.39 nm produced the largest resonance Raman scattering. The shape of the G b d J an s suggeste t at t e , d h h SWCN'l' s were semI con uctIng . d . . In nature. 444'i46 .. . B y
comparing the Raman spectra of SWCNT/PS composites with Raman spectra of SWCNTs (Figure 1 b) with those of pristine SWCNTs (Figure 1 a) and pristine PS (Figure 1 c), it is apparent that the spectrum of S WCNT/PS con1posites is dominated by SWCNT bands. and the intensities of Ran1an bands due to PS are much weaker. According to an electronic structure study of SWCNTs. large van Hove singularities exist in the nanotube density of states (~OS) because of one-dimensional confinement of electronic and phonon states.47 This special electronic structure has a larger absorption cross-section for CNTs than for most polymers at the excitation wavelength. Thus. the resonance enhancement occurs more easily in CNTs than it does in the most polymers.
to 1568 and 1593 cm-I, respectively. The peak position of the RBM shifted from 178 to 182 cnl-I• The G' band experienced the largest shift, from 2667 cm-1 for the pristine SWCNT smnple to 2678 cm-I for the SWCNT/PS conlposites. A similar degree of shift was detected with a higher spectral resolution (~1 cm-I) as shown in Figure Id.
To Inore thoroughly characterize the Raman band shifts for SWCNTs in SWCNT/PS composites, I prepared SWCNT/PS conlposites with three different loadings of SWCNTs, 0.5, 1, and 30/0 w/w. Raman spectra of pure SWCNTs and the
SWCNT/PS cOlnposites were separated into three parts, as shown in Figure 2a-c. Figure 2a shows the RBM band region of the spectra. The RBM peaks reveal the dianleter distribution of SWCNTs in the PS matrix. The RBM peak region of pristine SWCNTs shows two peaks (Figure 2a). The first, with stronger intensity, was located at 178 cnl-I and shifted to 182. 184, and 187 cnl-I, in the spectra of the 3, 1, and 0.50/0 SWCNT/PS composites, respectively. Another peak with weaker intensity was located at 164 cm-I in pristine SWCNTs, marked by solid dark point (.) in Figure 2a. This peak was also evident in the spectra for the 0.5 % w/w and] % w/w conlposites, and up shifted to larger wavenunlbers in their spectra. However, it nearly vanished in the spectrum of 30/0 w/w SWCNT/PS. This arose fronl the fact that the pristine
SWCNTs were not unifonn in diameter and had a distribution of < 2 nm. An extra peak appeared in the region lower than] 00 cm-1 due to Rayleigh scattering.
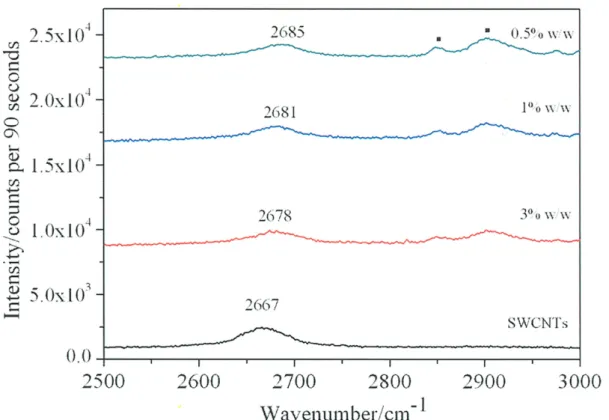
Figure 2b compares the G band region of pristine SWCNTs and the SWCNT/PS cOlnposites. The G band of SWCNTs is mainly composed of two sub-bands (G- and which arise from carbon vibrations along the circumferential and axial directions
of SWCNTs, respectively. Figure 2c shows the G' band region in the Raman spectra of SWCNTs (2667 cn1-1) and the spectra of 0.5% w/w (2685 em-I), 1 % w/w (2681 em-I), and 30/0 w/w (2678 cm-I) SWCNT/PS composites. Two additional peaks at 2850 cm-I and 2904 cm-I which are marked by solid dark square point (_) were assigned to aliphatic symmetric Vs (Cl-b) and anti-symn1etric VS (CH2) Raman n10des of PS, respectively. Figure 2b and 2c reveal that the two G bands and the G' band yielded higher \vavenwnber shifts of ditTerent degrees, similar to the shift behavior of RBM. It also indicates that the 0.50/0 w/w SWCNT/PS composite exhibits a larger shift than the composites with the 3 and 1 % w/w SWCNT loading.
The shifts observed in the Ratnan bands of SWCNTs arise from three possible mechanisms: chemical action between SWCNTs and matrix, such as charge transfer or chemical bonds;48 changes in the tube-tube interactions due to the distribution of SWCNTs;49 and mechanical compression from the polymer matrix.34:S0:51
First, there are a number of reports regarding Raman shift behavior of CNTs induced by chemical actions. 52 It has been shown that charge transfer induced by doping, or chemical bonds fonned between CNTs and the polymer, could induce a shift in the Raman peaks of CNTs to higher wavenumbers by several tens of cm-I (Br doped) or to lower wavenumbers by 100 cm-I (K, Rb doped). However, in the current system, it is impossible that the Raman shift resulted from this kind of action, because
interaction can be clearly observed uSIng infrared spectroscopy. as the peak for methylene group n10des shift by roughly 10 cm-I.37
Figure 3 shows the comparison of the IR spectra of pure PS and 1 and 30/0 w/w SWCNT/PS composites. Most of bands in the IR spectra are assigned to PS. The vibration bands related to methylene group modes of PS are located at 2924, 2850, and 1371 cm-1 (Figure 3). However. the absorption bands belonging to methylene group vibrations did not undergo any shift in the IR spectra of SWCNT/PS con1posites. The absence of a shift indicates that CH-interactions did not occur or played only a weak role in these samples. Thus, charge transfer cannot be used to explain the observed Raman shifts. Strong interactions at the CNT/polymer interface \vould be induced by modifying the surface of CNTs, for example, by adding chemical bonds such as -COOH.
Secondly. van der Waals interactions are known to occur among the tubes within SWCNT bundles. Before the generation of the SWCNT/PS composite, the SWCNTs were first dispersed in ethanol, which induces a loss of van der Waals interactions between the tubes and is expected to cause a Raman shift in the G band by ~ 10 cm-1 55. Figure 4 shows the Raman spectra of pristine SWCNTs and SWCNTs in ethanol 0.1n1ghnL) revealing a 3 cm-I up-shift of the RBM peak upon dissolving the bundled SWCNTs in ethanol. However. the G band experienced an insignificant frequency shift. Rao et al.56 detected about a 10 cm-1 up-shift between bundled SWCNTs and SWCNTs dissolved in CS2 solution. They assigned this up-shift prin1arily to the decreased energy spacing of the Van Hove singularities in isolated tubes over the
spacing in a rope. and also found that this effect induced a weak influence on the G band shift. Thus, van der Waals interactions are not suitable for explaining the Raman shifts observed in the system.
Finally, let us concentrate on the last possible Inechanisn1. It is well known that the elongation or shrinkage of carbon atom vibrations causes shifts in Ran1an bands of SWCNTs by several wavenumbers. When SWCNTs are en1bedded into another systeln. such as a liquid and a polymer. S WCNTs are subjected to hydrostatic pressure.34:51:57 The hydrostatic pressure induces up shifts of Rmnan bands of SWCNTs. Wood et al. 5\ reported that the pressure-induced shifts of various SWCNT bands occurred when SWCNTs were embedded into liquid or when pressure was applied using by a diamond anvil cell (DAC). It has been confirmed that the peak shifts are induced by compressive forces imposed by the liquid on the SWCNTs. Loa58 performed a comprehensive study of SWCNTs under different high pressures using Raman spectroscopy. The results showed that pressure can induce a reversible change in the lattice dynamics and structure of SWCNTs. and that it is also possible to transforn1 S WCNTs into diamond and other "superhard" phases by the application of pressure. In the current study. it is likely that the SWCNTs underwent mechanical compressIon from PS matrix during the process of generating the composites. I estimate the magnitude of cOlnpression to be 518 MPa from the Raman shifts
where P is the pressure, (Do is the peak position with no extra pressure. and a is the
slope of (D and P (a is 8.0 cm-1/GPa 59). The value is reasonable considering previous 60
reports.
fron1 the above analysis, it can be concluded that the up-shift behavior observed in the peaks in the SWCNT/PS cOlnposites spectra is Inainly due to mechanical compression from the PS matrix. The RBM up-shift appears to be partly from nlechanical compression, and partly from the effect of van der Waals interactions.
Figures 5 and 6 show the shift behaviors of the G and G' bands, respectively, at different locations within the samples. From Figure 5, it is clear that the G+ band (the largest shift is about 6 cn1-1) shifted more than the G- band (the largest shift is about 3 cln-I), indicating that the carbon-carbon atom vibrations along the axial direction were more sensitive to mechanical pressure than the vibrations along the circumferential direction. Oddly, the G+ band of SWCNT/PS with 1 % w/w content of SWCNT/PS
exhibited a sn1aller upshift than that of the 30/0 w/w composite (Figure 5). The reason
for this remains unclear and requires further investigation. From Figure 6, it is apparent that the G' hand shifted more than the two G bands, indicating that the G' band is an excellent indicator of the interaction between SWCNTs and the polymer. The shift behavior of the G' band, as a detector for stress transfer from polymer to CNTs. has also been studied using strain-dependent Raman. When CNTs undergo strain. the Gr band experiences a large downshift. Cooper et al. observed a large downshift of G' band. up to 10 cm-I. at 1 % strain in MWCNT/epoxy resin which indicates stress transfer fron1 matrix to nanotubes. 61 Lower loadings of SWCNTs
produce larger shifts (Figures 5 and 6) because lower loadings induce better alignment or distribution of the SWCNTs. At higher loadings, the aggregation of SWCNTs increases, which causes the SWCNTs to undergo a lower mechanical compression than the \veIl-dispersed SWCNTs. A further report concerning this phenOlTIenOn utilizing tip-enhanced Raman spectroscopy is underway in our laboratory.
B. Laser Heating Effect Study on SWCNT/PS Composites
The heating effect of SWCNTs has been studied using laser heating-dependent or telTIperature-dependent Raman spectroscopy.34:62:63 A downshift with temperature has been detected, caused by the elongation of C-C bonds due to thermal expansion. The presence of disorder or defects in such materials provides enough flexibility to the CNTs structures to accomn10date C-C elongation with thermal expansion. In the present systen1, as discussed above, SWCNTs underwent mechanical compression from matrix in SWCNT/PS composites. The SWCNTs contained in con1posites were expected to potentially exhibit thermal effects different from those observed in pristine S WCNTs. Figure 7 shows the laser-power dependence of the Raman spectra of (a) pristine SWCNTs and (b) 1 % w/w SWCNT/PS con1posite using a 514.5 nm
laser beam varied fron1 12.5 ~ W to 1 m W. With increasing laser power, most Raman peaks of SWCNTs shifted to lower wavenumber (due to the elongation of C-C vibrations). It should be noted that this shift behavior was weak in the SWCNT/PS
cn1-1 as the laser power increased fron1 12.5 J.lW to 1 InW~ the corresponding shift for the pristine SWCNT salnple was 19 cm-I. The G- and G+ bands shifted 16 and 18 cm-I, respectively, in the SWCNTs/PS cOlnposites, and only 6 and 3 cm-I in pristine SWCNTs.
In my formal study of the laser heating effects on MWCNT/SBR systems,M two possible reasons were given for a sin1ilar behavior: the rearrangement of MWCNTs in MWCNT/SBR systems with increased temperature, which induced a better alignment of MWCNTs in the composites and reduced the degree of disorder or the an10unt of defects; and the mechanical con1pression of MWCNTs by SBR, which blocked the expansion of the MWCNTs with increasing temperature. Here, the highest laser power used is 1 mW, which is not enough to decompose the PS. As a result, it appears to be ilnpossible that rearrangement occurred during laser heating in my experiment. Thus, the mechanical compression from the PS Inatrix played an important role in producing the different heating effect behavior of SWCNTs in SWCNT/PS composites and pristine SWCNT samples, and produced a greater effect on the RBM band.
Conclusion
I studied the interactions at the SWCNT/PS interface in nanocOlnposites uSIng Ran1an and IR spectroscopy. Clear up-shifts of the G and G' bands in the Raman spectra of SWCNT/PS nanocomposites and pristine SWCNTs indicated that mechanical compression was transferred from the PS matrix to the SWCNTs fillers. The RBM band also up-shifted in SWCNT/PS composites. By comparing these results with Raman spectra of SWCNTs in ethanoL I concluded that the up-shift of the RBM peak arose from two sources: van der Waals effects and mechanical cOlnpression. The results of the laser po\ver-dependent Raman experiment indicated that the heating effects observed for pristine SWCNTs, manifested as a downshift with increasing temperature, were weak in SWCNT/PS composites due to mechanical compressIOn.
References
1. Iijinla. S. Nature 1991, 354, 56-58.
2. Park. S. H.~ Bandaru, P. R. Polymer 2010,51.5071-77. 3. Thostenson. E. T.; Chou, T. W. JPhys. 2003,36, 573-82.
4. Guadagno, L.; Vertuccio. L.~ Sorrentino, A.; Raimondo, M.; Naddeo, C.~ Vittoria, V.; Iannuzzo. G.; Calvi, E.; Russo, S. Carhon 2009, -17, 2419-30. 5. Kim. K. S.; Ryu. l. H.; Lee, C. S.; lang . .1.; Park, K. C.
JMater.Sci.-,Mater. Electron. 2009, 20, 120-24.
6. Wang, H. L.; Luo • .1.; Schaffel, F.~ RummelL M. H.; Briggs, G. A. D.; Warner. J. H. NanotechnolofDJ 2011,22,245305.
7. Dai, H. J.~ I-Iafner, J. H.; Rinzler, A. G.; Colbert, D. T.; Snlalley, R. E. Nature
1996, 384, 147-50.
8. Tung, F. K.; Yoshimura, M.; Ueda, K. J1Vanomat. 2009,2009, 1-5.
9. Lee, S. Y.; Kwon, Y. T.; Ryu, D. H.; Kinl, Y. S.; Song, W.; .leon. C.; Choi, W.
C.; Park, C. Y. J Nanosci. and Nanotech. 2011,11,6341-44.
10. Pimenov, S. M.; Frolov, V. D.; Zavedeev, E. V.; Abanshin. N. P.; Du. H. Y.; Chen. W. C.; Chen, L. C.; Wu, J. .1.; Chen, K. H. Appl.Phys.A 2011,105, 11-16.
1 L Grady, B. P. Carbon nanotube-polymer composites: nlanufacture, properties, and applications. 2011; Chapter 4.
12. Kumar, S.; Dang, T. D.; Arnold. F. E.; Bhattacharyya, A. R.; Min, B. G.;
Zhang. X. F.; Vaia. R. A.; Park, C.; Adams, W. W.; Hauge, R. H.~ Smalley, R. E.~ Ramesh, S.; Willis, P. A. Macromolecules 2002, 35.9039-43.
13. Zhao, P.; Wang, K.; Yang. H.; Zhang, Q.; Du, R. N.~ Fu. Q. Polymer 2007, -I!(
5688-95.
14. Sandler, J. K. W.; Kirk, J. E.; Kinloch, 1. A.; Shaffer, M. S. P.; Windle, A. H.
Polymer 2003, -14, 5893-99.
15. Kim. S.; DrzaL T. JAdh.Sci. Tech. 2009, 23, 1623-38.
16. Liu. T. X.; Phang. 1. Y.; Shen, L.; Chow, S. Y.; Zhang, W. D. Macromolecules 2004,37.7214-22.
Commun. 2003,24, 1070-73.
18. Bokobza, L.; Rahn1ani, M. Kautsch. Gummi Kunstst. 2009, 62. 112-17. 19. Bokobza, L. Silicon 2009, 1, 141-45.
20. Bokobza, L. Kaut:;,'ch. Gummi Kunst.~'t. 2009, 62, 23-27. 21. Bokobza, L. Polymer 2007, 48, 4907-20.
22. Bokobza. L.; Rahmani, M.; Belin, C.; BruneeI, J. L.; EI Bounia, N. E .
.! Polym.Sci. 2008, 46, 1939-51.
Takeda, T.; Shindo. Y.; KUrOnUlTIa, Y.; Narita, F. Polymer 2011,52, 3852-56. 24. AdohL B. J. P.; Mdarhri, A.; Prunier, C.; Haidar, B.; Brosseau, C . .!AppI.Phys.
2010,108,1-9.
25. BaraL P.; Weng, G. J. Int . .!Plast. 2011,27, 539-59.
26. Hribova, M.; Rybnikar, F.; Vilcakova, J . .!MacromoI.Sci. 2011, 50, 16-25.
27. Park, S. H.; Bandaru, P. R. Polymer 2010,51.5071-77.
28. Tseng, C. H.; Wang, C. C.; Chen. C. Y. Nanotechnolot,ry 2006, 17, 5602-12. 29. Amr, I. T.; AI-An1er, A.; Thomas, S.; AI-Harthi, M.; Girei, S. A.; Sougrat, R.;
Atieh, M. A. Composites Part B 2011, 42, 1554-61.
30. McClory. C.; McNally, T.; Baxendale, M.; Potschke, P.; Blau, W.; Ruether, M.
Eur. Polym . .! 2010, 46, 854-68.
31. Dresselhaus, M. S.; Dresselhaus, G.; Jorio, A . .!Phys.Chem.B 2007, 111, 17887-93.
32. Dresselhaus, M. S.; Jorio. A.; Souza. A. G.; Saito, R. Phi/os, Trans.R.Soc.A 2010,368,5355-77.
33. Saito, R.; Hofmann. M.; Dresselhaus, G.; Jorio, A.; Dresselhaus. M. S.