Comprehensive Assessment of Urban Development and Its
Environmental Implications Between China and Japan
中国と日本における都市発展及びその環境への影響
の総合評価に関する研究
北九州市立大学国際環境工学研究科
2020
年 9 月
彭 王崇彧
PENG WANGCHONGYU
Comprehensive Assessment of Urban Development and Its
Environmental Implications Between China and Japan
September 2020
Wangchongyu PENG
The University of Kitakyushu
Faculty of Environmental Engineering
Deprtment of Architecture
Gao Laoratory
phases. The issue of city development was investigated from multiple perspectives. Spatial dependence and spatial heterogeneity of urbanization or urban shrinkage were found through spatial analysis. The focus is set on exploring the characteristics and correlates of city development, and its impact on thermal environment for cities in China and Japan.
of Kitakyushu. The past five years is very memorable time for me. I would like to extend heartfelt gratitude and appreciation to the people who helped me bring my study into reality.
Firstly, I would like to express the deepest appreciation to my advisor, Prof. Weijun GAO, for his great support and motivation for the work. His optimistic attitude and guidance have helped me greatly these years. In addition, Prof. Gao provides me a free space to develop my knowledge and teaches me how to become a matured researcher. Apart from the study, he also gives me much help and instruction for my daily life.
Also, I would like to express my thanks to all university clooeagues, especially Dr. Wei CHEN, Mr. Yujun YANG, Dr. Jinming JIANG, Mr. Rui WANG, Mr. He Wang, Dr. Yinqi ZHANG who give me the help, cooperation, and supports of reaseach and daily life in Japan. And thanks to all the members of Gao Laboratory, especially Dr. Jianan LIU, Ms. Danhua WU, Mr. Neng QU, Mr. Fanyue QIAN, Mr. Zhen YANG et al for their help and supporting during the study and life.
ABSTRACT
The development of the city is the current main theme. However, there are great differences of the development stages among cities in the world. At present, China is mainly faced with uncoordinated development caused by rapid urbanization, large environmental problems, and obvious regional differences. Meanwhile, Japan is facing a serious problem of city shrinkage.
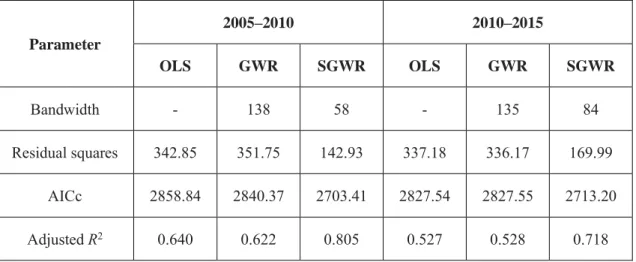
This study compares the urban development between China and Japan and its environmental impact through large scale and medium-small scale investigations. In addition, this study focused on exploring the role of spatial independence and spatial heterogeneity effect on urban development and its inner correlation with environment implications. Spatial dependence results from various spatial spillover effects, and spatial heterogeneity results from inherent differences between spatial units and variations over space. The spatial correlation analysis and semiparametric geographically weighted regression (SGWR) are adopted to reveal the spatial dependence and heterogeneity of city development and environment. Moreover, the differences of city development stages, driving forces, and environmental implications are evaluated and compared.
In chapter one, research background and significance of urban development and environmental implications is demonstrated. In addition, the importance of plan and evaluation of urban environment is analyzed and the previous study about this research is reviewed. Then the purpose of the study is proposed.
In chapter two, firstly, the concept and application of geographic information system (GIS) and remote sensing (RS) is introduced. In addition, theory, development history and application methods for ESDA are described. Finally, this thesis presents a loose-coupled urban development evaluation method considering the strength and weakness of both the GIS and RS. The requirement, conceptual framework and integration component for the association between GIS and RS is discussed.
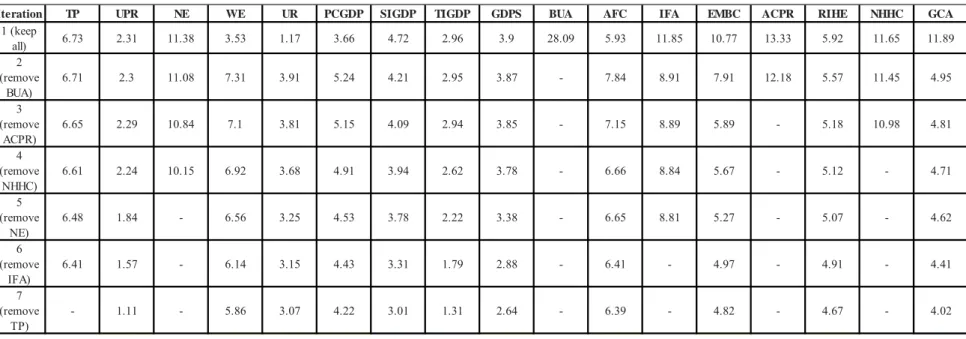
In chapter three, we developed global, local, and mixed models to capture the spatiotemporal differences in determinants affecting urbanization in China based on national statistics data from 2005 to 2015. The correlation between the demographic, economic, infrastructure and social indexes and urbanization was revealed through quantitative analysis. PCGDP, GDPS, AFC, and EMBC, which refer to the economy development and urban infrastructure, were the critical spatially non-stationary correlates, with large estimated coefficients, affected the urbanization in different regions at different times. UPR, HIRE which refer to the demographic structure and
with large estimated coefficients, affected the urbanization spatially stationary. The findings contribute to improving our understanding of the situation and correlates of urbanization, and provide valuable information for governments and planners when developing effective coping strategies for sustainable city development.
In chapter four, we developed global, local, and mixed models to capture the spatiotemporal differences in determinants affecting city shrinkage in Japan based on national census data from 2005 to 2015. City shrinkage in Japan is a serious national problem, which showed a significant increasing positive spatial autocorrelation; Hokkaido, Tohoku, and Shikoku had the largest shrinking city clusters, and this phenomenon has already occurred in suburban areas around the Tokyo and Nagoya city clusters. The correlation between the demographic, economic, and social indexes and city shrinkage was revealed through quantitative analysis. Low fertility, ageing population, and industry changes, expressed by APR, UPR, and ECR, were the critical spatially non-stationary correlates, with large estimated coefficients, affected the city shrinkage in different regions at different times. The findings contribute to improving our understanding of the situation and correlates of city shrinkage, and provide valuable information for governments and planners when developing effective coping strategies for city regeneration.
In chapter five, the coupling coordination degree model make it possible to assess the comprehensive level of urbanization for cities in the Beijing city cluster from 2000 to 2017. The results suggest that those five indicators made the enormous contribution in evaluating the urbanization level, and determining the coupling coordination degree of urbanization. Besides, the results reveal that the coordinated urbanization in the region from ‘barely coordination’ to ‘medium coordination’ to ‘good coordination’. This study can provide useful information for understanding the current level of urbanization and promoting sustainable development in the future. In the foreseeable future, the comprehensive urbanization process in the Beijing city cluster will be the main component of China’s urbanization. Our empirical analysis for the 13 cities in the Beijing city cluster illustrated that the coupling coordination urbanization model is a useful tool which contribute to improve the understanding of the urbanization process and help with management policies and strategies for comprehensive development of urbanization for cities and balanced development for the region.
In chapter six, we first applied global and local Moran’s tests to investigate the population change since the city plan with the concept of compact city come out. The results the change is not spatially dependent. However, according to the results of local Moran’s I statistics, there are six main regions with their own characteristics of population shrinkage and expansion. The shrinkage and expansion of the six main regions in Kitakyushu have some similarities, but the differences are larger. The government wish the compact city model to creates benefits that are attractive to modern urbanites. The desired benefits include shorter commute times, reduced environmental impact of
the LULC, and the LSTs, and explored the cooling effect potential of the urban blue-green spaces. The downscaled LST results showed good fitting performance of the RF model. With such downscaling methods, analysis on the SUHI and its correlates could be spatial-temporal precisely in a cloudy, rainy area using remote sensing data. We found the LULC could have an impact on the LST of its surrounding neighbors, and which also is the basis for investigating the cooling effect of the urban blue-green spaces. Through zonal statistics, the forest and sea could significantly mitigate the UHI in its approximate 1 km buffer zone, while the mitigation effect of the water and the grassland on the UHI are less spectacular compared with the forest and sea. The findings contribute to improving our understanding of the spatial temporal variation and the correlates of UHI, and provide valuable information for governments and planners to developing effective coping migration strategies for the UHI considering the perspective of the local environment.
In chapter eight, the urban development process in China and Japan is summarized. From 2005 to 2015, the economic factors have a little spatially stationary impact both in China and Japan. In addition, the social factors have great spatially non-stationary impact on urbanization of cities in China while the effect is global and little in Japan. Moreover, strong evidence showing that urban heat island was related to city size that the intensity varies spatially with a sequence of mega-city > large-city > mid-city; whilst it varies temporally with a course of summer > winter and daytime > nighttime through differences of SUHI through time. Also, significant increases both in extent and magnitude of SUHI were observed for the 60 cities. In the foreseeable future, the comprehensive urbanization process in several main city clusters will be the main component of China’s urbanization, while cities in Japan will face increasing urban shrinkage phenomena.
Acknowledgement
Abstract
Chapter 1. Previous study and purpose of the study
1.1.Introduction ... 1-1 1.2.Research background and significance ... 1-4 1.2.1 Introduction of urbanization and city shrinkage ... 1-4 1.2.2 Trends of urban development implications ... 1-5 1.2.3 Research Significance ... 1-7 1.3.Review of previous study ... 1-8 1.3.1 Study on urban development ... 1-8 1.3.2 Study on urban heat island ... 1-9 1.4.Purpose of this study ... 1-10 Reference ... 1-13
Chapter 2. Theories and Methods of Urban Development Assessment
2.1 Introduction ... 2-1 2.2 Theories and applications of Geographic Information System ... 2-3
2.2.1 Theories and development of GIS ... 2-3 2.2.2 Panel data analysis ... 2-4 2.2.3 Explanatory spatial data analysis in GIS ... 2-6 2.3 Theories and applications of Remote Sensing ... 2-13 2.3.1 Theories and development of RS ... 2-13 2.3.2 Applications of RS data ... 2-14 2.3.3 Introduction and pre-processing of RS data ... 2-14 2.4 Integration methods of urban development and environmental implication assessments ... 2-18 2.4.1 Requirements for the comprehensive assessment for urban sustainable development ... 2-18 2.4.2 Conceptual framework of GIS-RS integration ... 2-19 2.5 Summary ... 2-21 Reference ... 2-22
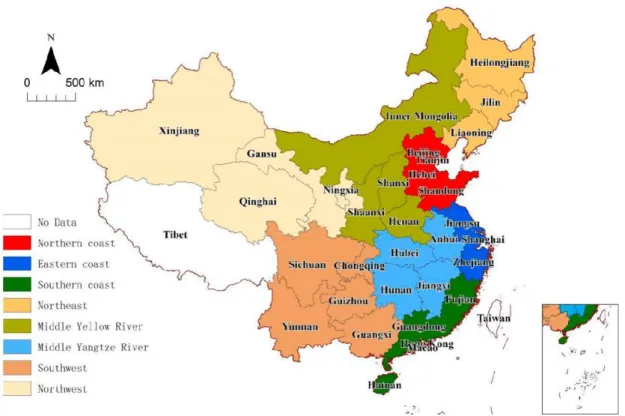
Chapter 3. Spatial temporal assessment of urbanization of China
3.1 Introduction ... 3-1 3.2Study area, methods, and materials ... 3-3 3.2.1 General information of urbanization in China ... 3-3 3.2.2 Analysis Method and Research Flow ... 3-7 3.3Spatial autocorrelation analysis of population changes patterns in China ... 3-11 3.4Regression results... 3-14 3.4.1 Variable selection ... 3-14 3.4.2 Global and local analysis of urbanization in China... 3-17 3.4.3 Assessment of urbanization in China through SGWR models ... 3-18 3.5 Summary ... 3-30 Reference ... 3-31
Chapter 4. Spatial temporal determinants of city shrinkage in Japan
4.1Introduction ... 4-1 4.2Study area, methods, and materials ... 4-3 4.2.1 Study area and general information of city shrinkage in Japan ... 4-3 4.2.2 Analysis Method and Research Flow ... 4-5 4.3Spatial autocorrelation analysis of population change patterns ... 4-9 4.4Regression results... 4-12 4.4.1 Variable selection ... 4-12 4.4.2 Global and local analysis of city shrinkage in Japan ... 4-15 4.4.3 Assessment of city shrinkage in Japan through SGWR models ... 4-17 4.5 Summary ... 4-26 Reference ... 4-28
Chapter 5. Comprehensive evaluation of urbanization process in Beijing city cluster
5.1 Introduction ... 5-1 5.2 Location and general information of Beijing city cluster ... 5-3 5.3 Data and methodology of urbanization evaluation ... 5-7 5.3.1 Statistics data pre-processing ... 5-7 5.3.2 The urbanization evaluation indicators... 5-7 5.3.3 Urbanization evaluation methods ... 5-9 5.3.4 Data Availability ... 5-10
5.5.2 Comprehensive urbanization level ... 5-20 5.6 Conclusion ... 5-22 References ... 5-24
Chapter 6. Correlation analysis of population change and urban vitality in Kitakyushu
6.1 Introduction ... 6-1 6.2 Study area, materials, and methods ... 6-4 6.2.1 Study area and its general information ... 6-4 6.2.2 Materials ... 6-5 6.2.3 Methods and research flow... 6-7 6.3 Spatial autocorrelation analysis of population change in Kitakyushu ... 6-9 6.4 Zonal statistics and correlation analysis of urban regeneration in Kitakyushu ... 6-12 6.4.1 Zonal statistics of the study areas ... 6-12 6.4.2 Pearson correlation analysis of population change characteristics ... 6-20 6.4.3 Analysis of the characteristics of the study areas ... 6-24 6.5 Summary ... 6-26 Reference ... 6-27
Chapter 7. Spatial temporal analysis of thermal environmental implications based on remote sensing
7.1 Introduction ... 7-1 7.2 General information of study area ... 7-3 7.3 Data sources and methods for UHI investigation ... 7-5 7.3.1 Satellite data ... 7-5 7.3.2 Land numerical data and population data ... 7-5 7.3.3 Downscaling LST based on random forests ... 7-7 7.3.4 Data analysis ... 7-9 7.4 Downscaling LST results ... 7-12 7.4.1. Random forests variable importance ... 7-12 7.4.2 Downscaled results ... 7-13 7.4.3 Bivariate spatial analysis ... 7-17 7.4.4 Zonal statistics results ... 7-21
7.5 Summary ... 7-31 References ... 7-32
Chapter 8. Comparison of urban development and thermal environment in China and Japan
8.1Introduction ... 8-1 8.2Comparison of urban development between China and Japan ... 8-3 8.2.1Urban development in China ... 8-3 8.2.2Urban development in Japan ... 8-5 8.2.3Comparison of urban development ... 8-7 8.3Environmental implications between China and Japan ... 8-9 8.3.1Urban heat island data source ... 8-10 8.3.2 Urban heat island distribution analysis ... 8-14 8.4Conclusion ... 8-17 Reference ... 8-18
Chapter 9. Conclusion
Fig.1-1 Urban trends by world regions, 1950-2050 ... 1-1 Fig.1-2 City development model ... 1-2 Fig.1-3 Research flow ... 1-12 Fig.2-1 The distribution of Japan’s municipalities center (a) Japan, (b) Kyushu ... 2-7 Fig.2-2 250m fishnet of Kitakyushu ... 2-8 Fig.2-3 Spatial autocorrelation types and samples ... 2-9 Fig.2-3 Sample of autocorrelation analysis report ... 2-10 Fig. 3.1 Variation of population and urbanization rate from 1980 to 2019 ... 3-3 Fig. 3.2 The schematic diagram of the eight economic zones of China ... 3-4 Fig. 3.3 Spatial distribution of study cities ... 3-5 Fig. 4 Spatial distribution of population change ratio from (a) 2005 to 2010, (b) 2010 to 2015 3-6
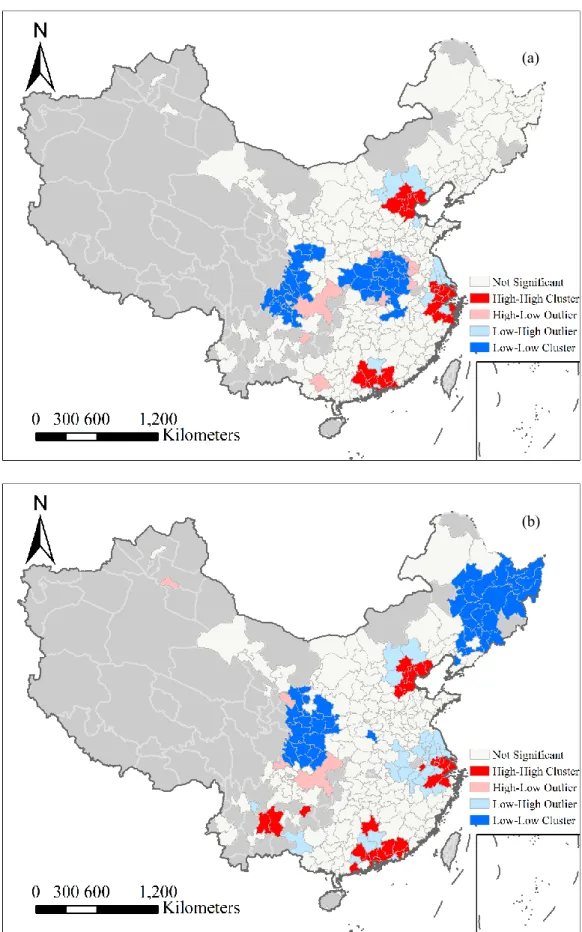
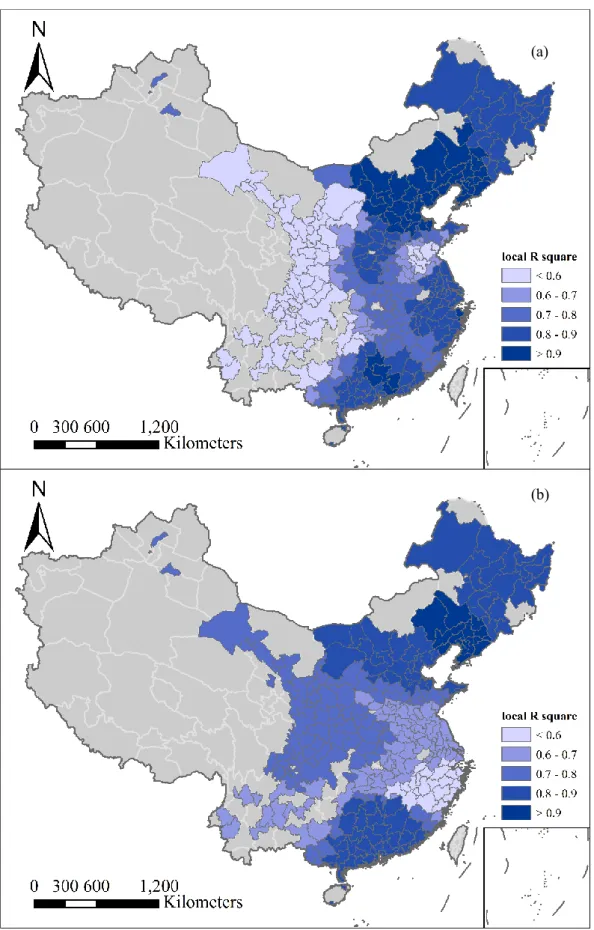
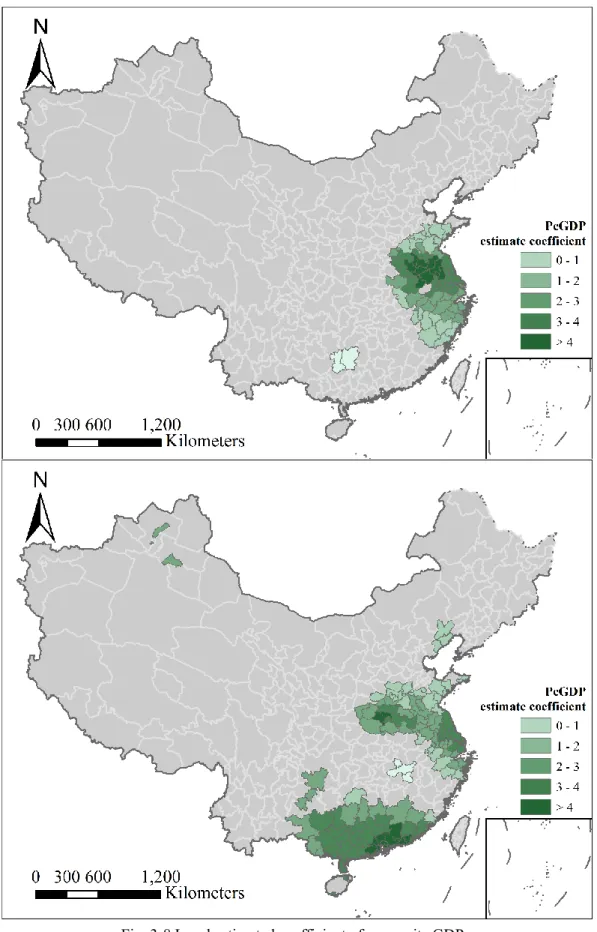
Fig. 3-5 Research flow of assessment of the determinants of urbanization in China... 3-8 Fig. 3-6 LISA cluster maps of population change in China (a) from 2005 to 2010; (b) from 2010 to 2015 ... 3-8 Fig. 3-7. Local R2 of urbanization in China based on SGWR (a) from 2005 to 2010; (b) from 2010 to 2015 ... 3-20 Fig. 3-8 Local estimated coefficient of per capita GDP (a) from 2005 to 2010 and (b) from 2010 to 2015 ... 3-23 Fig. 3-9 shows the coefficient of the GDPS (a) from 2005 to 2010 and (b) from 2010 to 2015 3-24 Fig. 10 Local estimated coefficient of AFC (a) from 2005 to 2010 and (b) from 2010 to 2015 . 3-25
Fig. 3-11. Local estimated coefficient of EMBC (a) from 2005 to 2010 and (b) from 2010 to 2015 . ... 3-26 Fig.4-1 Regions of Japan, from north to south: Hokkaido, Tohoku, Kanto, Chubu, Kinki,
Chugoku, Shikoku, and Kyushu ... 4-3 Fig.4-2 Research flow of assessment of the determinants of city shrinkage in Japan ... 4-6 Fig.3 LISA cluster maps of population change (a) from 2005 to 2010; (b) from 2010 to 2015 . 4-10
Fig. 4-4 Parameters estimated coefficients for the local model (a) from 2005 to 2010 and (b) from 2010 to 2015 ... 4-16 Fig. 4-5 The t-value of the parameters for the local model (a) from 2005 to 2010 and (b) from 2010 to 2015 ... 4-16 Fig. 4-6 Local R2 of city shrinkage in Japan based on SGWR (a) from 2005 to 2010; (b) from 2010 to 2015 ... 4-18 Fig. 4-7 Local estimated coefficient of underage population ratio (a) from 2005 to 2010 and (b) from 2010 to 2015 ... 4-21
Fig. 4-8 Local estimated coefficient of ageing population ratio (a) from 2005 to 2010 and (b) from 2010 to 2015 ... 4-22 Fig. 4-9. Local estimated coefficient of enterprise change ratio (a) from 2005 to 2010 and (b) from 2010 to 2015 ... 4-23 Fig. 5-1. Location of Beijing city cluster ... 5-4 Fig. 5-2. Statistics of population indexes of cities in the Beijing city cluster from 2000 to 2017 (a) urban population (10,000 people) variation, (b) population density (people/km2) variation ... 5-12
Fig. 5-3. Statistics of economy indexes of cities in the Beijing city cluster from 2000 to 2017 (a) GDP (billion yuan) variation, (b) electricity consumption (billion kWh) variation ... 5-13 Fig. 5-4 Statistics of society indexes of cities in the Beijing city cluster from 2000 to 2017 (a) urban green ratio (%), (b) area of paved road (million m2) ... 5-14
Fig. 5-5. Statistics of energy consumption (10,000 tons of SCE) of cities in the Beijing city cluster from 2000 to 2017 ... 5-15 Fig. 5-6. Statistics of pollution indexes of cities in the Beijing city cluster from 2000 to 2017 (a) urban sewage discharge (billion tons), (b) SO2 emission (10,000 tons) variation, (c) dust emission (10,000 tons) ... 5-16 Fig. 5-7. Variations of 3 urbanization systems indexes for cities in the Beijing city cluster from 2000 to 2017 (a) Beijing, (b) Tianjin, (c) Shijiazhuang, (d) Tangshan, (e) Qinhuangdao, (f) Baoding, (g) Handan, (h) Xingtai, (i) Zhangjiakou, (j) Chengde, (k) Cangzhou, (l) Langfang, (m) Hengshui, (n) mean of big-cities, (o) mean of mid-cities ... 5-19 Fig. 6-1. Population forecast of Kitakyushu ... 6-1 Fig. 6-2 Relation between population density and administrative per capita cost ... 6-2 Fig. 6-3. Study area (a) location of Kitakyushu; (b) distribution of streets in Kitakyushu ... 6-4 Fig. 6-4 Research flow of evaluating urban regeneration against depopulation in Kitakyushu ... 6-7 Fig. 6-5 Spatial distribution of number of populations change in each street from 2000 to 2015 in Kitakyushu ... 6-9 Fig. 6-6 Frequency distribution histogram of NPC from 2000 to 2015 in Kitakyushu ... 6-9 Fig. 6-7 Scatter plot of global Moran’s I test for NPC ... 6-10 Fig. 6-8 LISA map of NPC from 2000 to 2015 in Kitakyushu ... 6-11 Fig. 6-9 Population and population change of the study areas ... 6-12 Fig. 6-10 Zonal statistics of demographic factors – before “compact city” ... 6-13 Fig. 6-11 Zonal statistics of demographic factors – variation since “compact city” ... 6-15 Fig. 6-12 Zonal statistics of urban vitality factors – before “compact city” ... 6-17 Fig. 6-13 Zonal statistics of urban vitality factors – variation since “compact city” ... 6-19 Fig. 7-1 Location of study area ... 7-3 Fig. 7-2 Land use and land cover of Fukuoka in (a) 2006, and (b) 2016 ... 7-6 Fig. 7-3 Sample of a RF regression model ... 7-7 Fig. 7-4 Flow chart of downscaling MODIS LST products based on random forests ... 7-8 Fig. 7-5 The distribution of Densely Inhabited Districts in the study area ... 7-9 Fig. 7-6 250 m downscaled LST using random forests regression during summer daytime ... 7-14
Fig. 7-10 LISA cluster statistics between population and the LSTs during the eight study periods ... 7-19 Fig. 7-11 LISA cluster statistics between urban, water, bare land and the LSTs during the eight study periods ... 7-20 Fig. 7-12 LISA cluster statistics between coast, forest, grassland and the LSTs during the eight study periods ... 7-21 Fig. 7-13 The variation of the SUHII during the eight study periods in Fukuoka and Kitakyushu.
... 7-22 Fig. 7-13 Relationship between mean SUHII and population ... 7-22 Fig. 7-14 Relationship between mean SUHII and distance to population ... 7-22 Fig. 7-15 Relationship between mean SUHII and distance to urban area ... 7-23 Fig. 7-16 Relationship between mean SUHII and distance to coastal area ... 7-24 Fig. 7-17 Relationship between mean SUHII and distance to water area ... 7-25 Fig. 7-18 Relationship between mean SUHII and distance to forest ... 7-26 Fig. 7-19 Relationship between mean SUHII and distance to grassland ... 7-27 Fig. 7-20 Relationship between mean SUHII and distance to bare land ... 7-28 Fig. 8-1 Urban population ratio and urban development phases of China since 1949 ... 8-3 Fig. 8-2 Urban population ratio and urban development phases of Japan since 1890 ... 8-5 Fig. 8-3 Urban population ratio between China and Japan from 1950 to 2018 ... 8-7 Fig. 8-5 Urban land distribution and urban boundary extraction of the Beijing city cluster in 2015
... 8-11 Fig. 8-6 Spatial distribution of LST in Beijing city cluster in 2005 and 2015 (a) LST in summer daytime of 2005, (b) LST in summer nighttime of 2005, (c) LST in summer daytime of 2015, (d) LST in summer nighttime of 2015 ... 8-12 Fig. 8-7 Spatial distribution of LST in Beijing city cluster in 2005 and 2015 (a) LST in winter daytime of 2005, (b) LST in winter nighttime of 2005, (c) LST in winter daytime of 2015, (d) LST in winter nighttime of 2015 ... 8-13 Fig. 8-4 Location of study cities in (a) China, (b) Japan ... 8-11
Fig. 8-8 SUHII of selected cities of (a) China in 2005, (b) China in 2015, (c) Japan in 2005, (d) Japan in 2015 ...8-15
CONTENTS OF TABLES
Table 2-1. Four kernel type options available in GWR4. ... 2-7 Table 2-2. Landsat 5 bands parameters ... 2-15 Table 2-3. Landsat 8 bands parameters ... 2-16 Table 2-4. MODIS bands parameters ... 2-17 Table 3-1. City level division and numbers of city ... 3-5 Table 3-2. The ratio of urbanization cities classified by city level ... 3-7 Table 3-3. Classification, name, and description for explanatory variables for urbanization
evaluation in China
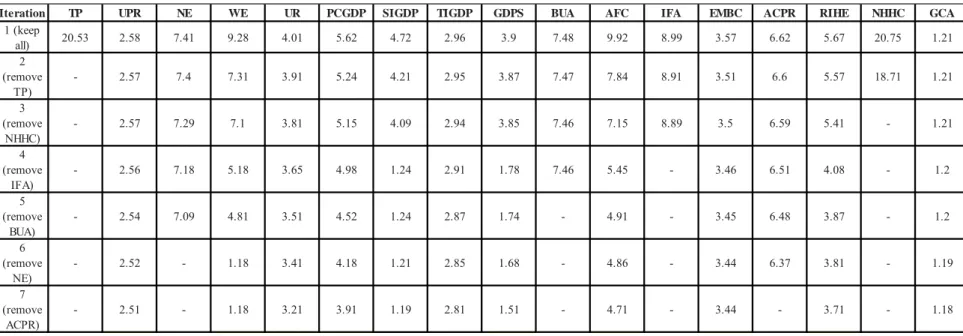
... 3-9 Table 3-4. Global Moran’s I results for population change in China ... 3-11 Table 3-5. Variance inflation factor (VIF) value of variables selection procedure of the China urbanization model study period 2005 to 2010 ... 3-15 Table 3-6. Variance inflation factor (VIF) value of variables selection procedure of the China urbanization model study period 2010 to 2015 ... 3-16 Table 3-7. Municipality parameters estimated coefficient for the global model (China) ... 3-17 Table 3-8. Municipality parameters estimated coefficient for the GWR model (China study period from 2005 to 2010) ... 3-17 Table 3-9. Municipality parameters estimated coefficient for the GWR model (China study period from 2010 to 2015) ... 3-18 Table 3-10. Determination of parameters for the SGWR models (China) ... 3-19 Table 3-11. Accuracy evaluation for the global, local, and SGWR model (China) ... 3-19 Table 4-1. Municipalities level classification ... 4-4 Table 4-2. The ratio of shrinking cities classified by municipalities level ... 4-4 Table 4-3. The ratio of shrinking cities classified by region ... 4-5 Table 4-4. Classification, name, and description for explanatory variables ... 4-7 Table 4-5. Classification, name, and description for explanatory variables ... 4-9 Table 4-6. Variance inflation factor (VIF) value of variables selection procedure of the model study period 2005 to 2010 ... 4-13 Table 4-7. Variance inflation factor (VIF) value of variables selection procedure of the model study period 2010 to 2015 ... 4-14 Table 4-8. Municipality parameters estimated coefficient for the global model (Japan) ... 4-15 Table 4-9. Determination of parameters for the SGWR models (Japan) ... 4-17 Table 4-10. Accuracy evaluation for the global, local, and SGWR model... 4-17 Table 5-1. Outline of 13 cities in the Beijing city cluster ... 5-5 Table 5-2. Indicators for urbanization system ... 5-8 Table 5-3. Classification of coupling coordination degree ... 5-10 Table 5-4. Data availability ... 5-10 Table 5-5. The CUL of cities in the Beijing city cluster from 2000 to 2017 ... 5-21
... 6-20 Table 6-3. Coefficient of determinant R2 between NPC and demographic factors – variation since “compact city” ... 6-21 Table 6-4. Coefficient of determinant R2 between NPC and urban vitality factors – before
“compact city”
... 6-22 Table 6-5. Coefficient of determinant R2 between NPC and urban vitality factors – variation since “compact city” ... 6-23 Table 6-5. Population change characteristics of the study areas ... 6-24 Table 7-1. Random forests variable importance scores for each scene ... 7-12 Table 7-2. Downscaled LST results based on random forests regression, R2 is the determination coefficient, RMSE is the root-mean-square error (K) ... 7-13 Table 7-3. Bivariate global Moran's I value for the variables and downscaled LSTs ... 7-18 Table 7-4.. The cooling effect of the LST and distance for the urban blue-green spaces ... 7-29 Table 8-1. Percent of city type in China and Japan from 2005 to 2015 ... 8-8 Table 8-2. SUHI indicator and its definition ... 8-10
1.1.Introduction ...1-1 1.2.Research background and significance ...1-4 1.2.1 Introduction of urbanization and city shrinkage ...1-4 1.2.2 Trends of urban development implications ...1-5 1.2.3 Research Significance ...1-7 1.3.Review of previous study ...1-8 1.3.1 Study on urban development ...1-8 1.3.2 Study on urban heat island ...1-9 1.4.Purpose of this study ...1-10 Reference ...1-13
1.1. Introduction
As of 2019, more than half of the world’s population is living in urban areas, and the rate is expected to reach 65% by 2030 and 70% by 2050 [1]. With the rapid development of information networks, the global mobility of capital and labor has increased, and large-scale urbanization movements have begun around the world [2]. For developed countries, it has entered the post-urbanization stage. And most developing countries are still in the period of excessive urbanization from the beginning to rapid development. In recent years, there has been a positive understanding of urban development, which has been incorporated into the national development policy [3].
At the turn of the century in 2000, there are 371 cities with a population of over 1 million worldwide. By 2018, the number of the cities with at least 1 million inhabitants has increased to 548, and by 2030, 706 cities are expected to have at least 1 million inhabitants. Cities with a population of more than 10 million are often referred to as megacities. The number of megacities globally is expected to be 33 in 2018 and 43 by 2030. In 2018, 48 cities had a population between 5 and 10 million. By 2030, 10 of them are expected to become megacities. Between 2018 and 2030, there will be 13 in Asia and 10 in Africa. In 2030, the population of 66 cities is expected to be between 5 and 10 million inhabitants. Most cities in the world have fewer than 5 million inhabitants. Asia has the largest population in the world, with most countries being the developing countries (Fig. 1-1) [4]. In the next decades, population growth will be the most noticeable, and corresponding strategies are urgently needed to deal with related problems.
Fig. 1-1 Urban trends by world regions, 1950-2050 (Source: UN World urbanization prospects: The 2012 revision)
CHAPTER ONE: PREVIOUS STUDY AND PURPOSE OF THE STUDY
Fig. 1-2 City development model
(Source: Berg, L. van den, Klassenn, L.H., Rossi, A. and Vijverberg, C.H.T. (1982). Urban Europe: a Study of Growth and Decline, vol 1: Oxford: Pergamon)
Berg et al. (1982) portrayed the evolutionary course of a metropolitan region in four phases (Fig 1-2) [5]. In the first phase, urbanization, the central city occupies a dominant position. It has achieved a positive immigration balance and has become the main node of regional employment. In the second stage, suburbanization is the shift of the focus of population and land-intensive uses to the suburbs. However, the central city is still the core of employment in the region. In the third stage, de-urbanization, the metropolis tends to split into many urban centers, some of which are located on the edge of the city [6]. At this stage, the metropolis has lost its compact node structure, and population and employment in the central city and its surrounding suburbs have tended to decline. The fourth stage, re-urbanization, although in the theoretical stage before theory, is considered by Berg et al. (1982) as a remedy for the split structure of the metropolis. The fourth phase is now more likely refers to a strict re-urbanization strategy aimed at reviving their original metropolitan core to become a high-density, function-intensive "compact city"[7].
With the development of urbanization, there are many urban phenomena occurred. This includes population issues, environmental issues, social issues and many other aspects. Each city is facing or will face some of these problems during its development. Meanwhile, these problems are gradually intensifying with the development of the city and have aroused widespread concern. Cities at different stages of urban development, are facing with many different problems. Therefore, it is necessary to
analyze the problems and their causes facing cities at different development stages, and explore countermeasures to provide effective responses to the government and policymakers.
CHAPTER ONE: PREVIOUS STUDY AND PURPOSE OF THE STUDY
1.2. Research background and significance
1.2.1 Introduction of urbanization and city shrinkage
Urbanization is a population movement phenomenon that people shift from rural area to an urban area. The phenomenon is having a massive impact on the economic, social, environmental landscape all over the world. While the process of urbanization keeping going on, more and more problems occur that we are required to make it process on a more sustainable and equitable path [1].
Urbanization took place over a period of several decades in Europe countries and North America countries. And it is happening in East Asia only a few years. It’s an essential role for urban policy makers that they take the responsibility for making all the residents living in the urban areas a better living environment [2].Urban growth and sprawl have severely altered the biophysical environment. Rapid urbanization has significant influence on different aspects of the quality of life and research in determining the patterns of urbanization and quantifying their impacts is the need of the hour. Unplanned urbanization an urban sprawl will directly affect the land use and land cover of the area. The changes in land cover include loss of agricultural lands, loss of forest lands, increase of barren area, an increase of impermeable surface of the area because of the built-up area. For the sustainable urban eco-systems, the amount of land required for growing the vegetation can be estimated from these studies. For a city being built, it will be really hard to change the urban form and land use patterns of the city. If there is something defective of the urban form, it will cost a large sum of money and years to undo the mistakes.
The process of urbanization provides people in urban areas a better living environment and working opportunities. East Asia has a numerous population, and a large amount of developing countries. Therefore, we can foresee a fast expansion of urban areas where millions of East Asia people will have the chance to leave extreme poverty behind and to prosper in the coming decades.
Urbanization is not easy to evaluate due to the processing of urbanization itself is very complicated and confused to understand, the scholars around the world would like to judge the level of urbanization by many parameters such as the urban population, the economic index, the energy usage, also the urban facilities construction, etc. Urbanization reflected in every regard of a city, to have a comprehensive understanding of urbanization of a city, it is necessary to do the analysis from many different parts of the urban development and have a comprehensive assessment of the city development [3].
However, city shrinkage, as the antithesis of urbanization, is an ongoing extreme phenomenon not only in developed countries, but also emerging in some fast-urbanizing countries [11, 12]. City shrinkage is characterized by population loss, economic downturn, and inefficient land use [13-15]. Especially in the developed world, with a background of globalization and de-industrialization, many large cities are considered shrinking cities or will be shrinking cities [16-19]. Research on the city shrinkage not only provides solutions for the affected regions, but also alerts fast-urbanizing areas
about future problems.
The process of city shrinkage occurs within a complex system, so studies on city shrinkage considered many aspects. Many studies focused on the policies and response to city shrinkage and called for local corresponding strategies for the sustainable development of the cities. For example, by assessing four policy responses to city shrinkage in Europe, improving the quality of life of local citizens is the optimal strategy for local government [20]; by identifying the shortcomings of the local government response to city shrinkage as lack of transparency and lack of understanding of best practices, the development of local adaptation policies in shrinking cities is required [21]. Some scholars focused on exploring the factors driving city shrinkage. The driving factors vary from demographics, economy, society, and policies at global and local levels. For example, socio-spatial inequalities were found to more strongly influence city shrinking compared with economic factors in the American Rust Belt [22]; falling birth rates and the effects of German reunification were the main factors affect shrinkage in Germany [23]. The demographic change, which refers to the ageing population and low birth rate, is the primary cause of city shrinkage in Japan [12]; the economic level and population structure are highly related to city shrinkage in China [24].
1.2.2 Trends of urban development implications
Increasing inequality in and among cities: Inequality has become a major trend that has an impact on achieving the New Urban Agenda and the Sustainable Development Goals. The gap between rich and poor is currently at its highest level in the past 30 years; since the 1980s, the highest-income 1% share of global economic growth has doubled the poorest 50%. At the city level, 75% of the world ’s cities have higher income inequality than they did 20 years ago. Inequality in cities is more pronounced than in rural areas, and women, youth and the elderly are particularly affected by inequality. The New Urban Agenda and the 2030 Agenda for Sustainable Development seek to address inequality by leaving no one behind, which requires the provision of equal infrastructure and basic services and adequate and affordable housing, and promotes productive employment and decent work for everyone. On the other hand, due to the different functions and different development levels of cities in urban agglomerations, the city gaps in some urban agglomerations have gradually widened. How to achieve collaborative development has become an important issue.
Population aging is happening all over the world: Globally, the population aged 60 and above is growing at a rate of 3.3% per year, faster than any other age group. Planning for the aging of the urban population requires innovation to meet the increasing demand for health care, leisure, transportation, housing and other facilities for the elderly, and to respond to the impact of social protection and pension schemes. This phenomenon is particularly prominent in Japan. Japan’s population has continued to decline in recent years. The low birth rate, strict naturalization policy, and the extension of life expectancy brought by the advanced medical system have made Japan's aging rate increase very
CHAPTER ONE: PREVIOUS STUDY AND PURPOSE OF THE STUDY
quickly. The shrinking population in Japanese cities is also due to the primary cause of the population structure.
Urban expansion and low-density development: As the urban population increases, the land area occupied by the city increases at a faster rate. On average, the growth rate of urban land area is twice that of the urban population. This has led to a decrease in density and a more scattered urbanization model, manifested in the disordered expansion of cities. Low-density development not only wastes resources, but also increases travel distance and energy consumption, increases the cost of providing infrastructure, reduces the economic effects of agglomeration, and reduces urban productivity.
Environmental implications: Climate change is one of the biggest challenges that cities must deal with. Urban energy 60% to 80% of source consumption and produce up to 70% of anthropogenic greenhouse gas emissions. Cities are also extremely vulnerable to climate change and extreme weather events. Therefore, climate change is not only a global issue but also a local issue. Cities play a vital role in addressing climate change and achieving the goals of the Paris Agreement. To address the impact of climate change on cities, partnerships have been established. The New Urban Agenda and the 2030 Agenda for Sustainable Development provide many opportunities for developing strategies to mitigate and adapt to climate change, especially through environmental sustainability and resilient urban development. In cities around the world, there are large differences in environmental issues, such as the water pollution, air pollution, etc. The environmental problems facing cities in developing countries are much more complicated than those in developed countries. For example, the PM2.5 problem in China in recent years has rarely been affected in other countries. Kitakyushu City in Japan has caused serious air and water pollution due to urban development, but through effective management, these environmental problems have been effectively improved. Different the other environmental implications, the urban heat island (UHI) is a kind of environmental implication that all the cities are facing. The UHI effect refers to the city's "high temperature" caused by a large number of artificial heat generation, high heat storage bodies such as buildings and roads, and the reduction of green space. The temperature in the city is significantly higher than that in the surrounding suburbs. On the near-surface temperature map, the suburban air temperature changes little, and the urban area is a high-temperature area, like an island protruding from the sea. Because this island represents a high-temperature urban area, it is called the urban heat island. The main factors that form the urban heat island effect include urban underlying surface, artificial heat source, water vapor influence, air pollution, green space reduction, population migration and many other factors. The distribution of UHI is often correlate to the urban rain island (URI), urban dry island (UDI), urban fog island (UFI), and urban pollution island (UPI). This study investigated the impact of urban development on the urban environment through the analyst of UHI.
1.2.3 Research Significance
Urban development refers to the process of the change and growth of the city's status and role, its attractiveness, and its radiant power within a certain region. It is a process to meet the multi-level needs of the growing urban population. Including quantitative expansion and qualitative improvement. The quantitative expansion is manifested by the increase in the number of cities and the expansion of scale, that is, the improvement of the level of urbanization; the improvement of quality is manifested by the strengthening of urban functions and the improvement of modernization. Urban development, from a spatial perspective, is a unique form of settlement that exists in a country or region. As a gathering point of regional economy, technology, politics, production, population, information, transportation, culture, etc., the city has a certain attraction to its surrounding area, and the city continues to produce radiation to the surrounding area during its operation. As previous studies on policy responses to urbanization and urban shrinkage illustrate the local strategies are more effective and required than corresponding global policies, understanding the local driving factors from the global level is essential for policies makers and actors to better respond to this phenomenon. Most previous studies did not take the spatial effects into consideration, this significance of the urban research needs to be explored in terms of spatial effects.
Spatial dependence results from various spatial spillover effects, and spatial heterogeneity results from inherent differences between spatial units and variations over space [25, 26]. Ordinary least squares (OLS) regression can be used to assess the general correlates of city shrinkage where the correlates are spatially stationary [24]. However, local adaptation strategies are required to identify the spatial heterogeneity of city shrinkage. Geographically weighted regression (GWR) has become an increasingly essential tool for revealing local variables’ effects on the dependent variable over a geographical area [27-30]. In the GWR model, all the explanatory variables are spatially non-stationary. The semiparametric geographically weighted regression (SGWR) model, which is a mix of OLS and GWR models, is useful in situations where certain explanatory variables influencing the response are global while others are local [31]. Compared with the traditional OLS and GWR models, the SGWR model is usually more interpretive [32-34]. As shrinking cities may have several similar characteristics, which are better considered as spatially stationary impact factors, the SGWR model could be more appropriate for modeling the driving factors of urban development.
CHAPTER ONE: PREVIOUS STUDY AND PURPOSE OF THE STUDY
1.3. Review of previous study
1.3.1 Study on urban development
During the past few decades, the world was undergoing fast pace urbanization, particularly in China [37,38]. With the continuous rural-urban migration and urban expansion, more mega cities, large cities have emerged continuously in China. However, there are quite differences in urbanization level according to cities in China [39, 40]. Along with the rapid urbanization and modernization, built-up areas replaced with natural landscapes, and thus many environmental issues occurred, such as water and air pollution, increase in greenhouse gas, increase in fossil fuel energy consumption, and urban heat islands [41-43]. The most significant environmental implications of urbanization are water-air pollution, increase in energy consumption, and the urban heat island (UHI). Numerous studies have found that urbanization has a significant effect on the environment and urban quality [44-46]. With increasing closely economic and traffic connection among cities, three principal urban agglomerations emerged in China, including the Yangtze River Delta Region, the Peral River Delta Region, and the Beijing city clyster (also known as Beijing-Tianjin-Hebei Region) [47]. The urban built-up areas and the urban environment form a complex system with multiple feedback loops. Hence, it is essential to study the urbanization process and its impact on the urban environment on the urban agglomeration scale instead of a signal city for maintaining a good quality of urbanization and better urban planning strategies.
Within systems theory, a complex system refers to its constituent elements cannot explain the overall characteristics for their nonlinear links [48]. Previous studies showed urbanization process is a complex system which is inappropriate to evaluate only using population, such economy factors and social infrastructure factors are also essential parts for urbanization evaluation [49-52]. At present, there are several methods applied to assess urbanization including AHP, fuzzy comprehensive evaluation method, entropy method, gray relational analysis, and so on [53-56]. The entropy method is a useful tool according to the abstraction and quantitative difficulty of urbanization impact factors. Information entropy is defined as the measurement of the degree of order that higher entropy indicates more information, and lower entropy indicates less information. The urbanization coupling coordination model treats demographic urbanization, economic development, and social development as three subsystems that interact with each other nonlinearly. The three subsystems are considered as independent but integrated systems. The coordination statement between subsystems is an indicator of sustainable development, providing a standard for judging whether the system is tending to higher-order [57].
1.3.2 Study on urban heat island
With urban development, environmental implications become essential issues for urban planning. Panel data and monitoring stations data were the primary sources for evaluation of environmental implications such as water pollution and air pollution. However, remote sensing (RS) and GIS technologies enable large-scale research of the UHI which are increasingly used in recent UHI studies [58]. Compared with the traditional method for UHI studies of observing meteorological data, which has the limitation that the local meteorological observation points are not able to represent the whole study region, the RS based studies provided high resolution of spatial-temporal information. There are several RS datasets used in UHI studies, including NOAA AVHRR [59], ASTER [60,61], MODIS [62], and Landsat series [63,64]. However, there are many limitations of the satellite remote sensing approach. One of the most significant weaknesses of remote sensing data is that the data accuracy could affect by could cover. Therefore, two possible solutions including choosing cloud-free images or constructing temporally composited data are mainly adopted to decrease the impact of clouds [60, 65-67]. Hence, Moderate Resolution Imaging Spectroradiometer (MODIS) LST products have become an increasingly important source in UHI studies for providing land surface temperature (LST) images with 1 km spatial resolution and high temporal resolution (per day) which decrease the clouds impact and make temporal UHI studies available.
CHAPTER ONE: PREVIOUS STUDY AND PURPOSE OF THE STUDY
1.4. Purpose of this study
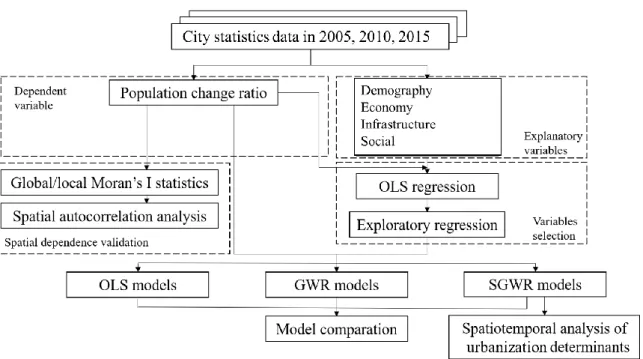
This study focuses on evaluation of urban development and its environmental implications. Cities and regions in different urban development stage were taken into consideration with the integration of geographic information system and remote sensing. Based on the previous study and theory analysis, the explanatory spatial data analysis methods were applied in the study. Fig. 1-3 is the research flow.
Previous study
In chapter one, research background and significance of urban development and environmental implications are investigated. In addition, the importance of evaluation of urban environment is analysis and the previous study about this research is reviewed. Finally, Purpose of this study is proposed.
Study methods
In chapter two, firstly, the concept and application of GIS and RS is introduced. In addition, the application and principle of explanatory spatial data analysis are described. The requirement, of integration component for the association between GIS and RS is discussed.
Numerical analysis of urban development
In chapter three, as the urbanization and land sprawl had drawn more and more attention, it is meaningful and useful to have an investigation of the urbanization in China. The investigation of urbanization can help us to get a comprehensive understanding of the urban land use and land cover variation during the years. After the investigation, not only can we get the advantages and benefit from the development, but also present the imbalance and weakness to remind us what we should do for our city to get a better condition. The investigation of urbanization also can let us know the urban development trend where more attention should be paid to make sure the steady development of the city from a global view.
In chapter four, the population change ratio derived from national census data in 2005, 2010, and 2015 was selected as the city shrinkage index, and a total of 1647 municipalities in Japan were selected as study objects. The objectives of this study were to (1) investigate the spatiotemporal distributions and patterns of shrinking cities in Japan; (2) reveal the interrelationship between city shrinkage and demographic, economy, and social indexes on global and local scales; and (3) compare the determinants across different regions from a global view. The findings illustrate the local determinants of city shrinkage in Japan, improve the understanding of the situation and the factors driving city shrinkage, provide valuable information for governments and planners developing effective coping strategies on the global and local levels, and hopefully will draw the attention of fast-developing countries to this possible future issue.
In chapter five, we took the Beijing city cluster as a local case of urbanization study, which is locating on the North China Plain, being the economic and cultural center in north China. There are in total 13 cities with quite differences in urbanization level in the region. This research is structured as
follows: after presenting study area, data and methods, we will evaluate the urbanization process and it coupling coordination degree for the 13 cities in the Beijing city cluster from 2000 to 2017. Then the surface urban heat island (SUHI), one of the environmental implications, will be investigated utilizing two indicators from SUHI magnitude and extent aspects for the 13 cities in summer and winter both in daytime and nighttime from 2000 to 2017. Then, four cities in the core area of the region are selected for analyzing the impact of urbanization effect on SUHI.
In chapter six, we explored the spatial population change patterns and its impact factors in Kitakyushu from a local level. As the first city plan based on the compact city idea was issued in 2003, the study period was selected from 2000 to 2015. The objectives of this study were to (1) investigate the spatiotemporal distributions and patterns of population change in Kitakyushu; (2) reveal the interrelationship between urban shrinkage and aggregation and demographic, economy, and social indexes on global and local scales; and (3) compare the determinants across different regions. The findings illustrate the local determinants of urban shrinkage in Kitakyushu, improve the understanding of the situation and the factors driving city shrinkage, provide valuable information for governments and planners developing effective coping strategies on the global and local levels, and hopefully will draw the attention of other cities to this possible future issue.
Numerical analysis of urban heat island
In chapter seven, one of the most urbanized areas, Fukuoka prefecture (Japan) was selected as the study area. The main objectives are first to investigate the UHI in this area during summer and winter both in the daytime and nighttime; second to explore the spatial correlation between the population, the LULC and the LSTs; and third to explore the urban cooling effect of the urban blue-green spaces. For the following reasons, we developed RF models to downscale the LSTs in the area with MODIS LST products from 1 km spatial resolution to 250 m: (1) the area is cloudy and rainy during the years that remote sensors with the low temporal resolution are not applicable for this area for the discontinuous time-series observations for the same area and high possibility of the images with high cloud cover; (2) various studies concluded the urban cooling effect of the water bodies and green spaces was relate to its size, and the affected distance is less than 1 km; and (3) the RF models for downscaling LSTs have better fitting performance than the other methods. The study contributes to illustrate the spatial correlates of LSTs, improve the understanding of the situation and the factors driving UHI, provide valuable information for governments and planners developing effective coping strategies on the UHI, and hopefully will draw the attention of the urbanizing cities.
Discussion of urban development and thermal environment between China and Japan In chapter eight, we took sixty cities in China and Japan as targets to compare the urbanization and UHI, one of the most severe environmental implications. The main purpose of this chapter is to have a comprehensive understanding of the numerical analysis chapters, to have a comparison and better understanding of urban development similarities and differences in China and Japan.
CHAPTER ONE: PREVIOUS STUDY AND PURPOSE OF THE STUDY
Conclusion
In chapter nine, a conclusion of the whole study is summarized.
Reference
[1] Nations U. 2018 revision of world urbanization prospects. United Nations Department of Economic and Social Affairs; 2018.
[2] Nations U. The worlds cities in 2018 data booklet. United Nations Department of Economic and Social Affairs; 2018.
[3] Habitat U N. State of the world's cities 2012/2013: Prosperity of cities[M]. Routledge, 2013. [4] Nations U. 2012 revision of world urbanization prospects. United Nations Department of Economic and Social Affairs; 2018.
[5] Berg, L. van den, Klassenn, L.H., Rossi, A. and Vijverberg, C.H.T. (1982). Urban Europe: a Study of Growth and Decline, vol 1: Oxford: Pergamon
[6] Johnson, J. H. (1974). "Geographical Processes at the Edge of the City". In Johanson, J.H., Suburban Growth. London: Wiley, 1-16.
[7] Shachar, A. (1997). "A Metropolitan Approach in Planning the Urbanized Area of Tel Aviv". In Nachmias, D. and Nahum, G. (editors), Tel Aviv-Yafo, Social Processes and Public Policy. Tel Aviv: Ramot Press, Tel Aviv University, 305-319.
[11] Haase A, Rink D, Grossmann K, Bernt M, Mykhnenko V. Conceptualizing urban shrinkage. Environment and Planning A. 2014;46:1519-34.
[12] Mallach A, Haase A, Hattori KJC. The shrinking city in comparative perspective: Contrasting dynamics and responses to urban shrinkage. 2017;69:102-8.
[13] Hattori K, Seike Y, Yoshida Z, Hamaguchi S, Yamada H, Suzuki N, et al. Shrinkage of tokamak current channel by external ergodization. 1984;121:368-73.
[14] He SY, Lee J, Zhou T, Wu DJC. Shrinking cities and resource-based economy: The economic restructuring in China's mining cities. 2017;60:75-83.
[15] Hospers G-JJUdi. Coping with shrinkage in Europe's cities and towns. 2013;18:78-89.
[16] Großmann K, Bontje M, Haase A, Mykhnenko VJC. Shrinking cities: Notes for the further research agenda. 2013;35:221-5.
[17] Haase D, Haase A, Kabisch N, Kabisch S, Rink DJEM, Software. Actors and factors in land-use simulation: The challenge of urban shrinkage. 2012;35:92-103.
[18] Haase DJN, Culture. Urban ecology of shrinking cities: an unrecognized opportunity? 2008;3:1-8.
[19] Rieniets TJN, Culture. Shrinking cities: causes and effects of urban population losses in the twentieth century. 2009;4:231-54.
[20] Hospers G-JJEPS. Policy responses to urban shrinkage: From growth thinking to civic engagement. 2014;22:1507-23.
[21] Syssner JJARdEsDyDR. Planning for shrinkage? Policy implications of demographic decline in Swedish municipalities. 2016:7-31.
CHAPTER ONE: PREVIOUS STUDY AND PURPOSE OF THE STUDY
[22] Sadler RC, Lafreniere DJ. Racist housing practices as a precursor to uneven neighborhood change in a post-industrial city. Housing Studies. 2017;32:186-208.
[23] Wiechmann T, Pallagst KMJIjou, research r. Urban shrinkage in Germany and the USA: A comparison of transformation patterns and local strategies. 2012;36:261-80.
[24] Zhang Y, Fu Y, Kong X, Zhang FJSC, Society. Prefecture-level city shrinkage on the regional dimension in China: spatiotemporal change and internal relations. 2019;47:101490.
[25] Anselin L. The Moran scatterplot as an ESDA tool to assess local instability in spatial association: Regional Research Institute, West Virginia University Morgantown, WV; 1993.
[26] Anselin LJGa. Lagrange multiplier test diagnostics for spatial dependence and spatial heterogeneity. 1988;20:1-17.
[27] Brunsdon C, Fotheringham AS, Charlton MEJGa. Geographically weighted regression: a method for exploring spatial nonstationarity. 1996;28:281-98.
[28] Fotheringham AS, Brunsdon C, Charlton M. Geographically weighted regression: the analysis of spatially varying relationships: John Wiley & Sons; 2003.
[29] Fotheringham AS, Charlton ME, Brunsdon CJE, A p. Geographically weighted regression: a natural evolution of the expansion method for spatial data analysis. 1998;30:1905-27.
[30] Van Donkelaar A, Martin RV, Spurr RJ, Burnett RTJEs, technology. High-resolution satellite-derived PM2.5 from optimal estimation and geographically weighted regression over North America. 2015;49:10482-91.
[31] Mei CL, He SY, Fang KT. A note on the mixed geographically weighted regression model. Journal of Regional Science. 2004;44:143-57.
[32] Jin C, Xu J, Huang ZJHI. Spatiotemporal analysis of regional tourism development: A semiparametric Geographically Weighted Regression model approach. 2019;87:1-10.
[33] Li W, Cao Q, Lang K, Wu JJSotTE. Linking potential heat source and sink to urban heat island: Heterogeneous effects of landscape pattern on land surface temperature. 2017;586:457-65.
[34] Zhao Q, Wentz EA, Fotheringham S, Yabiku ST, Hall SJ, Glick JA, et al. Semi-parametric Geographically Weighted Regression (S-GWR): a Case Study on Invasive Plant Species Distribution in Subtropical Nepal. 2016.
[35] Hattori K, Kaido K, Matsuyuki MJC. The development of urban shrinkage discourse and policy response in Japan. 2017;69:124-32.
[36] Frey WH. Migration and depopulation of the metropolis: regional restructuring or rural renaissance? American Sociological Review. 1987:240-57.
[37] Pallagst K. Shrinking cities in the United States of America. The Future of Shrinking Cities: Problems, Patterns and Strategies of Urban Transformation in a Global Context Los Angeles (University of California). 2009:81-8.
[39] A. R. dos Santos et al., "Spatial and temporal distribution of urban heat islands," Science of the Total Environment, vol. 605, pp. 946-956, 2017.
[40] Q. Chen and Z. Song, "Accounting for China's urbanization," China Economic Review, vol. 30, pp. 485-494, 2014.
[41] B. Qin and Y. Zhang, "Note on urbanization in China: Urban definitions and census data," China Economic Review, vol. 30, pp. 495-502, 2014.
[42] J. A. Foley et al., "Global consequences of land use," science, vol. 309, no. 5734, pp. 570-574, 2005.
[43] L. Zhou et al., "Evidence for a significant urbanization effect on climate in China," Proceedings of the National Academy of Sciences, vol. 101, no. 26, pp. 9540-9544, 2004.
[44] H.-M. Zhu, W.-H. You, and Z.-f. Zeng, "Urbanization and CO2 emissions: A semi-parametric panel data analysis," Economics Letters, vol. 117, no. 3, pp. 848-850, 2012.
[45] N. B. Grimm et al., "The changing landscape: ecosystem responses to urbanization and pollution across climatic and societal gradients," Frontiers in Ecology and the Environment, vol. 6, no. 5, pp. 264-272, 2008.
[46] S. Peng et al., "Surface urban heat island across 419 global big cities," Environmental science & technology, vol. 46, no. 2, pp. 696-703, 2011.
[47] D. Zhou, S. Zhao, L. Zhang, and S. Liu, "Remotely sensed assessment of urbanization effects on vegetation phenology in China's 32 major cities," Remote Sensing of Environment, vol. 176, pp. 272-281, 2016.
[48] X. Zhu et al., "The inhabited environment, infrastructure development and advanced urbanization in China's Yangtze River Delta Region," Environmental Research Letters, vol. 11, no. 12, 2016. [49] R. Gallagher and T. Appenzeller, "Beyond reductionism," Science, vol. 284, no. 5411, pp. 79-80, 1999.
[50] M. Chen, D. Lu, and L. Zha, "The comprehensive evaluation of China’s urbanization and effects on resources and environment," Journal of Geographical Sciences, vol. 20, no. 1, pp. 17-30, 2010. [51] M. Chen, D. Lu, and H. Zhang, "Comprehensive evaluation and the driving factors of China’s urbanization," Acta Geographica Sinica, vol. 64, no. 4, pp. 387-398, 2009.
[52] L. Guo-ping, "The analysis and evaluation of the compatible relationship between industrialization and urbanization in China," Areal Research and Development, vol. 5, no. 002, 2008. [53] Y. Sakieh, B. J. Amiri, A. Danekar, J. Feghhi, and S. Dezhkam, "Scenario-based evaluation of urban development sustainability: an integrative modeling approach to compromise between urbanization suitability index and landscape pattern," Environment, Development and Sustainability, vol. 17, no. 6, pp. 1343-1365, 2015.
[54] A. Beskese, H. H. Demir, H. K. Ozcan, and H. E. Okten, "Landfill site selection using fuzzy AHP and fuzzy TOPSIS: a case study for Istanbul," Environmental Earth Sciences, vol. 73, no. 7, pp.
3513-CHAPTER ONE: PREVIOUS STUDY AND PURPOSE OF THE STUDY
3521, 2015.
[55] Y. Liu, R. Li, and X. Song, "Grey associative analysis of regional urbanization and eco-environment coupling in China," Acta Geographica Sinica, vol. 2, pp. 237-247, 2005.
[56] S. Wang, H. Ma, and Y. Zhao, "Exploring the relationship between urbanization and the eco-environment—A case study of Beijing–Tianjin–Hebei region," Ecological Indicators, vol. 45, pp. 171-183, 2014.
[57] G. Yan-bing, "Comprehensive assessment on ecological risk of Hexi Corridor urbanization based on normal cloud model and entropy weight," Journal of Arid Land Resources and Environment, vol. 26, no. 5, pp. 169-173, 2012.
[58] K. P. Gallo and T. W. Owen, "Satellite-based adjustments for the urban heat island temperature bias," Journal of applied meteorology, vol. 38, no. 6, pp. 806-813, 1999.
[59] J. A. Sobrino, J. C. Jiménez-Muñoz, P. J. Zarco-Tejada, G. Sepulcre-Cantó, and E. de Miguel, "Land surface temperature derived from airborne hyperspectral scanner thermal infrared data," Remote Sensing of Environment, vol. 102, no. 1-2, pp. 99-115, 2006.
[60] D. R. Streutker and N. F. Glenn, "LiDAR measurement of sagebrush steppe vegetation heights," Remote Sensing of Environment, vol. 102, no. 1-2, pp. 135-145, 2006.
[61] L. Liu and Y. Zhang, "Urban heat island analysis using the Landsat TM data and ASTER data: A case study in Hong Kong," Remote Sensing, vol. 3, no. 7, pp. 1535-1552, 2011.
[62] R. Pu, P. Gong, R. Michishita, and T. Sasagawa, "Assessment of resolution and multi-sensor data for urban surface temperature retrieval," Remote Sensing of Environment, vol. 104, no. 2, pp. 211-225, 2006.
[63] J. Quan, Y. Chen, W. Zhan, J. Wang, J. Voogt, and M. Wang, "Multi-temporal trajectory of the urban heat island centroid in Beijing, China based on a Gaussian volume model," Remote Sensing of Environment, vol. 149, pp. 33-46, 2014.
[64] P. Fu and Q. Weng, "Consistent land surface temperature data generation from irregularly spaced Landsat imagery," Remote Sensing of Environment, vol. 184, pp. 175-187, 2016.
[65] Q. Weng and P. Fu, "Modeling annual parameters of clear-sky land surface temperature variations and evaluating the impact of cloud cover using time series of Landsat TIR data," Remote Sensing of Environment, vol. 140, pp. 267-278, 2014.
[66] B. N. Holben, "Characteristics of maximum-value composite images from temporal AVHRR data," International journal of remote sensing, vol. 7, no. 11, pp. 1417-1434, 1986.
[67] P. J. Sellers et al., "A global 1 by 1 NDVI data set for climate studies. Part 2: The generation of global fields of terrestrial biophysical parameters from the NDVI," International Journal of Remote Sensing, vol. 15, no. 17, pp. 3519-3545, 1994.
2.2 Theories and applications of Geographic Information System ...2-3 2.2.1 Theories and development of GIS ...2-3 2.2.2 Panel data analysis ...2-4 2.2.3 Explanatory spatial data analysis in GIS ...2-6 2.3 Theories and applications of Remote Sensing ...2-13 2.3.1 Theories and development of RS ...2-13 2.3.2 Applications of RS data ...2-14 2.3.3 Introduction and pre-processing of RS data ...2-14 2.4 Integration methods of urban development and environmental implication assessments ...2-18 2.4.1 Requirements for the comprehensive assessment for urban sustainable development ...2-18 2.4.2 Conceptual framework of GIS-RS integration ...2-19 2.5 Summary ...2-21 Reference ...2-22 2.1 Introduction ...2-1
2.1Introduction
The development of cities takes place in a very complex system. Although cities can be investigated through the population, economy, and other aspects, the endogenous of these factors cannot be avoided. In addition, the First Law of Geography, according to Waldo Tobler, is "everything is related to everything else, but near things are more related than distant things" [1]. This law makes the evaluation of urban development require more complex and in-depth consideration, because compared with the model developed based on the general panel data, the relevant model of a city or a region often require a spatial model which takes the location and the neighbors into consideration to make the evaluation more accurate. Besides, due to the large scale of a city or a region, there are great differences among the statistics data quality, the statistics caliber and standard of the urban related data. The timeliness, accuracy, and reliability of data are all essential issues to be considered in model design. Hence, especially for a city or a region, how to evaluate the spatial-temporal development require the most appropriate model design with the data source, processing, and analysis methods. In this context, this paper presents works done by integrating a Geographic Information System (GIS) and Remote Sensing (RS) to evaluate the urbanization and urban shrinkage (two types of urbanization), and urban heat island, one of the biggest urban environmental issues, in China and Japan both from global and local level.
GIS is a computer system for collection, storage, analysis and display of spatial information, and a common technology for processing and analyzing geographic data. During the integration process of water quality model and GIS, GIS is a powerful tool for spatial discretization, parameterization and visualization of water quality model. Geographic information systems are utilized in multiple technologies, processes, techniques and methods. It is attached to various operations and numerous applications, that relate to: engineering, planning, management, transport/logistics, insurance, telecommunications, and business [2]. Therefore, GIS is at the foundation of location-enabled services, that rely on geographic analysis and visualization.
Exploratory Spatial Data Analysis (ESDA), which is based on GIS technologies, includes a series of spatial analyst methods. ESDA are developed to statistically analyze spatial data and mine necessary knowledge of features' spatial structure and correlation [3-5]. Before applying these measures, it is necessary to at first define the spatial correlation between proximate features by Spatial Weight Matrix [6] and test if there is a statistically significant spatial correlation by Global Moran's I [7-9]
RS is the acquisition of information about an object or phenomenon without making physical contact with the object and thus in contrast to on-site observation, especially the Earth [10]. In current usage, RS refers to the use of satellite- or aircraft-based sensor technologies to detect and classify objects on Earth, including on the surface and in the atmosphere and oceans. RS is used in numerous fields, including geography, land surveying, urban planning and most Earth science disciplines [11, 12]. The advantage of RS is accurate multi-attribute data. However, the spatial, temporal, spectral, and
CHAPTER TWO: THERIES AND METHODS OF URBAN DEVELOPMENT ASSESSMENT
radiometric resolution of the RS data could significantly affect the choice of optimal RS for a specified study.