IRUCAA@TDC : Analysis of dental treatment performed by dental residents at General Dentistry Department of Tokyo Dental College Chiba Hospital over 6 years following introduction of mandatory dental clinical training system.
11
0
0
全文
(2) Bull Tokyo Dent Coll (2013) 54(3): 177–186. Clinical Report. Analysis of Dental Treatment Performed by Dental Residents at General Dentistry Department of Tokyo Dental College Chiba Hospital Over 6 Years Following Introduction of Mandatory Dental Clinical Training System Daiki Yamakura, Toshiyuki Takahashi, Atsushi Kameyama, Akio Noro, Toshiko Sugiyama, Yoshihiro Kondo, Setsuko Sugiyama, Akiko Haruyama, Tomotaka Takeda* and Kazunori Nakajima* Division of General Dentistry, Tokyo Dental College Chiba Hospital, 1-2-2 Masago, Mihama-ku, Chiba 261-8502, Japan * Department of Sports Dentistry, Tokyo Dental College, 1-2-2 Masago, Mihama-ku, Chiba 261-8502, Japan Received 28 January, 2013/Accepted for publication 8 March, 2013. Abstract Six years have passed since the introduction of legislation mandating at least 1 year of clinical training for those who have passed the national dentist examination. To determine whether clinical training has been appropriately implemented at the General Dentistry Department of Tokyo Dental College Chiba Hospital, a managed-type clinical training facility, the number of patients treated and types of dental and dental technical work performed by dental residents trained by the department were summarized and analyzed. The number of patients treated per dental resident increased from 11 in 2006 to 15 in 2011. By treatment type, periodontic treatment was the most frequently performed throughout the study period, followed by endodontic treatment. Conservation treatment, prosthodontic treatment with crowns/bridges, and prosthodontic treatment with dentures were performed at a similar moderate frequency, while oral surgical treatment was performed least frequently throughout the study period. The frequency of periodontic treatment increased slightly, whereas that of endodontic treatment decreased slightly or remained almost unchanged after introduction of the mandatory clinical training system. When the distribution of dental treatment performed at our department was compared with that of dental treatment performed by general dentists across Japan in 2011, our department showed a slightly lower frequency of periodontic treatment and higher frequency of endodontic treatment than the national total, whereas the frequency of other types of treatment was similar between the two populations. These results demonstrated that appropriate clinical training has been provided by our department to meet the purpose of offering dentists the opportunity to acquire the basic diagnostic and treatment abilities that would enable them to provide appropriate treatment for injuries and diseases frequently encountered in daily practice. The study also revealed some problems, such as a decreasing number of residents engaging in dental technical work each year. For additional improvement in the quality of dental clinical training, more analyses are needed to further identify and address potential problems in the system. Key words:. Dental clinical training — Dental treatment — General dentistry — Tokyo Dental College Chiba Hospital. 177.
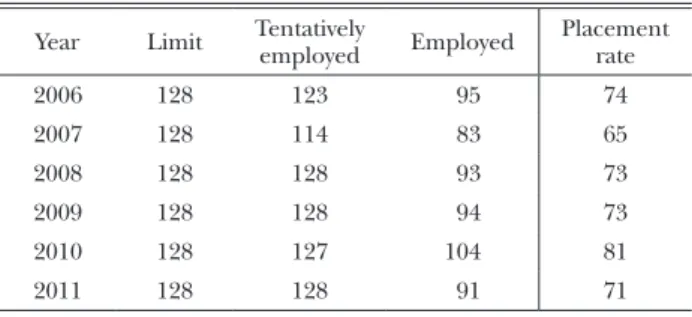
(3) 178. Yamakura D et al.. Table 1 Number of dental residents employed Year. Limit. Tentatively employed. Employed. Placement rate. 2006. 128. 123. 95. 74. 2007. 128. 114. 83. 65. 2008. 128. 128. 93. 73. 2009. 128. 128. 94. 73. 2010. 128. 127. 104. 81. 2011. 128. 128. 91. 71. unit: persons. Introduction Six years have passed since the introduction of legislation in 2006 mandating at least 1 year of clinical training for those who have passed the national dentist examination. We at Tokyo Dental College Chiba Hospital have provided single-type and managed-type dental training programs for 560 dental residents since 2006. The Dental Practitioners Act states that clinical dental resident training must offer dentists the opportunity to cultivate the personality required for a dentist and to acquire basic diagnostic and treatment abilities. This should be done while recognizing the social role to be fulfilled by dentistry and dental services, regardless of a dentist’s intended specialty, so that dentists can provide appropriate treatment for injuries and diseases frequently encountered in daily practice. To determine whether clinical training that meets these requirements has been provided by our department, we collected data on types of dental treatment performed by dental residents at our department over 6 years after the introduction of the mandatory clinical training system. We then compared this data with data from the pre-mandatory era, as well as data from a national survey conducted at general dental clinics across Japan in 2011.. Materials and Methods We collected and analyzed the following. unit: %. data from a table summarizing types of dental treatment and technical work performed by dental residents at our department at Chiba Hospital over a 6-year period from 2006 to 2011: 1) the number of dental residents who underwent annual clinical training; 2) the number of patients treated per dental resident; 3) details of types of dental treatment performed; and 4) details of technical work performed.. Results and Discussion 1. Number of dental residents The number of dental residents trained at the Chiba Hospital is shown in Table 1. In each year, the acceptance limit of 128 trainees was almost reached at the matching performed in the fall of the previous year, but the number was eventually reduced to about 70% of the limit because some of the candidates were suspended from graduation or failed the national examination. When each year was divided into 3 terms, the number of dental residents trained at the department in each term varied from 28 to 46 (Table 2), although the annual variation was relatively small. In comparison, from 2003 to 2005, during which clinical training was not man datory, an average of 28, 28, and 26 dental residents were trained in each term in 2003, 2004, and 2005, respectively, as reported by Takahashi et al.2). Thus, the number increased after the introduction of the mandatory clinical.
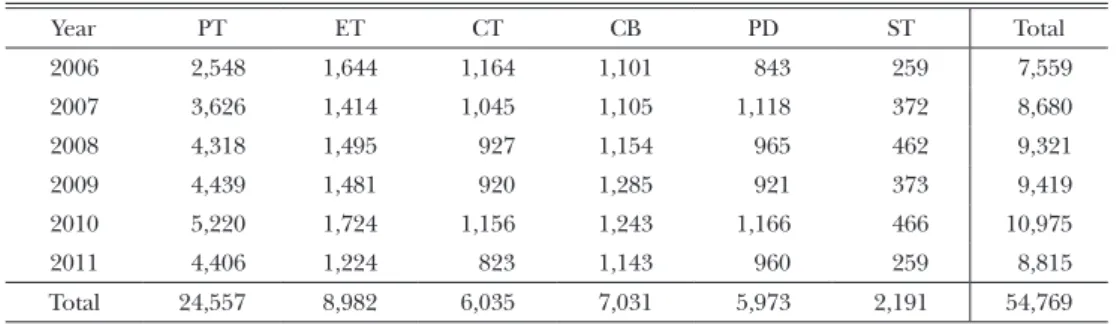
(4) 179. Dental Treatment Performed by Residents. Table 2 Number of dental residents at General Dentistry Department. Table 3 Number of patients treated by dental residents Year. No. of patients. No. of patients/ residents. Total. 38. 2006. 418. 11. 7,038. 28. 31. 2007. 434. 14. 7,565. 39. 39. 2008. 475. 12. 7,686. 38. 38. 38. 2009. 539. 14. 8,086. 40. 43. 46. 43. 2010. 559. 13. 8,541. 36. 36. 34. 36. 2011. 540. 15. Year. Term 1. Term 2. Term 3. Average. 2006. 38. 38. 36. 2007. 33. 32. 2008. 38. 39. 2009. 38. 2010 2011. 7,435. unit: persons. unit: persons. training system. In addition, the total number of dental residents in the post-mandatory era was almost twice that in the pre-mandatory era: 48 in 2003, 53 in 2004, and 41 in 2005. This increase may have occurred because students in the pre-mandatory era who wished to take a graduate course in basic or clinical dental science were allowed to do so imme diately after passing the national exam. In contrast, in the post-mandatory era, all students except those not intending to practice clinical dentistry in the future were required to undergo at least 1 year of clinical training before being admitted to a graduate school, which led to an increase in the number of dental residents.. In the pre-mandatory era, the corresponding numbers were 8.5 in 2003, 10.5 in 2004, and 10.2 in 2005, as reported by Takahashi et al.2). The number in 2006, the first year after the introduction of the mandatory clinical training system, was comparable to that in 2005, but a clear trend toward an increase in the number was observed from 2007 onward. This may have been because all supervisory dentists in the pre-mandatory era were working for both the general dentistry and specialized departments. In contrast, a system was established in 2007 during the post-mandatory era to ensure that all the supervisors in the General Dentistry Department were specialists.. 2. Number of patients treated per dental resident Table 3 summarizes the number of dental residents, total number of patients, and number of patients treated by dental residents at our department. The total number of patients increased between 2006 and 2010 and then decreased substantially to 7,435 in 2011. The average number of patients treated per dental resident was 11, 14, 12, 14, 13, and 15 in fiscal years 2006, 2007, 2008, 2009, 2010, and 2011, respectively. Although the number of patients per dentist in 2011 (n=15) is consistent with the number described by Tsunoda et al. as being appropriate4), it is simply because a decrease in the total number of dental residents resulted in an increase in the number of patients per dentist.. 3. Details of type of dental treatment performed by dental residents 1) Overview of types of dental treatment Table 4 summarizes the frequency of each type of dental treatment performed each year. The total number of treatments continued to increase from 2006 to 2010, when the number peaked at 10,975 before dropping to 8,815 in 2011. The most frequently performed type of individual treatment each year was periodontic treatment, followed by endodontic treatment. Conservation treatment, prosthodontic treatment with crowns/bridges, and prosthodontic treatment with dentures were performed at a moderate frequency each year, while oral surgical treatment was less frequently performed throughout the study period. The frequency of periodontic treatment. Average per term 1: Average.
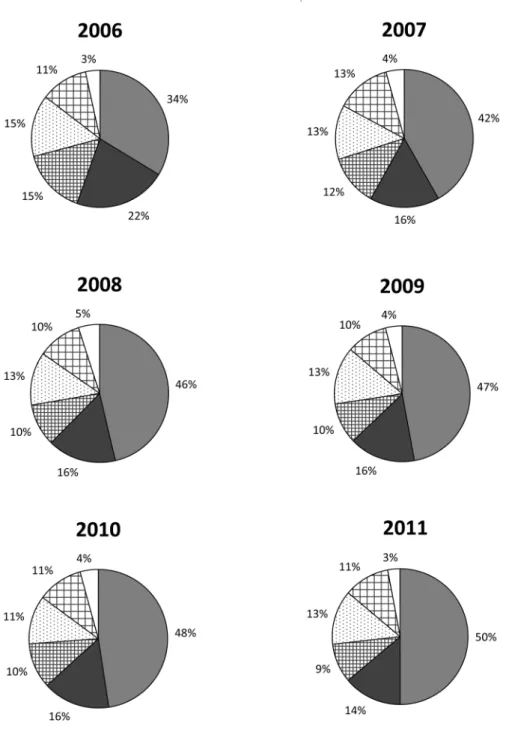
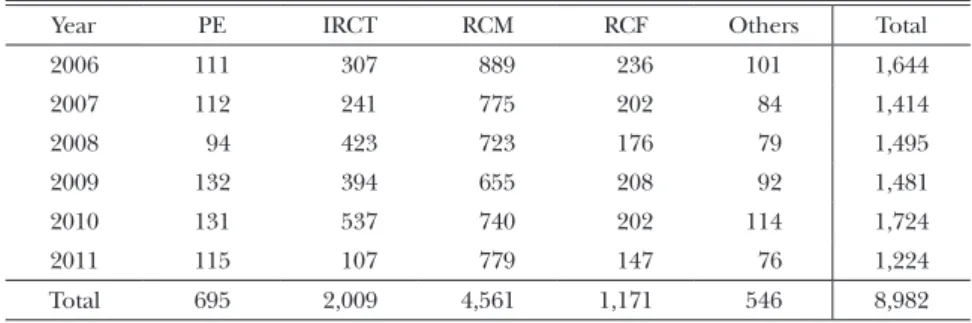
(5) 180. Yamakura D et al.. Table 4 Frequency of different types of dental treatment Year. PT. ET. CT. CB. PD. ST. Total. 2006. 2,548. 1,644. 1,164. 1,101. 843. 259. 7,559. 2007. 3,626. 1,414. 1,045. 1,105. 1,118. 372. 8,680. 2008. 4,318. 1,495. 927. 1,154. 965. 462. 9,321. 2009. 4,439. 1,481. 920. 1,285. 921. 373. 9,419. 2010. 5,220. 1,724. 1,156. 1,243. 1,166. 466. 10,975. 2011. 4,406. 1,224. 823. 1,143. 960. 259. 8,815. Total. 24,557. 8,982. 6,035. 7,031. 5,973. 2,191. 54,769 unit: times. Periodontic treatment: PT, Endodontic treatment: ET, Conservation treatment: CT, Prosthodontic treatment with crowns/bridges: CB, Prosthodontic treatment with dentures: PD, Oral surgical treatment: ST. continued to increase from 2006 to 2010, but dropped in 2011. The frequency of other types of treatment was similar each year. In terms of the proportion of each type of treatment relative to the total types of treatment performed annually, periodontic treatment accounted for the largest proportion in all years, followed by endodontic treatment. Conservation treatment and prosthodontic treatment with crowns/bridges or dentures accounted for about 10%, while oral surgical treatment accounted for ≤5% of all treatments (Fig. 1). 2) Details of individual dental treatments (1) Periodontic treatment Periodontic treatment was divided into periodontal examination, brushing instruction, scaling, scaling/root planing, and other types of treatment for summary purposes (Table 5). The most commonly performed periodontic treatment was scaling, followed by periodontal examination, scaling/root planing, and brushing instruction. The frequency of periodontic treatment, except for scaling/root planing, brushing instruction and “other periodontic treatment”, continued to increase from 2006 to 2010, but decreased in 2011. The frequency of “other periodontic treatment” continued to increase each year. This trend is in line with the total number of patients, reflecting the basic policy of our department to perform oral unit treatment while maintaining good. oral cleaning status and improving periodontal tissue health4). (2) Endodontic treatment Endodontic treatment was divided into pulp extirpation under anesthesia, infected root canal treatment, root canal medication, root canal filling and other types of endodontic treatment for summary purposes (Table 6). Root canal medication was performed most frequently in all years, followed by infected root canal treatment and root canal filling, while pulp extirpation under anesthesia was performed relatively infrequently. The frequency of infected root canal treatment and root canal filling in 2011 was lower than that in other years. In particular, the frequency of infected root canal treatment dropped sharply to 107 treatments in 2011. (3) Conservation treatment Conservation treatment was divided into composite resin filling, inlay preparation/ impression, and inlay placement for summary purposes (Table 7). Composite resin restoration accounted for more than half of all conservation treatments performed each year, at a frequency of nearly 3 times that of inlay placement. Inlay preparation/impression was slightly more frequent than inlay placement in all years, except 2011. This is probably because inlay preparation/ impression includes re-preparation and reimpression of inlays. The frequency of inlay preparation/impression and that of inlay.
(6) Dental Treatment Performed by Residents. 181. Fig. 1 Percentage of dental treatment categories in each year Periodontic treatment: PT, Endodontic treatment: ET, Conservation treatment: CT, Prosthodontic treatment with crowns/bridges: CB, Prosthodontic treatment with dentures: PD, Oral surgical treatment: ST. placement dropped slightly in 2011. (4) Prosthodontic treatment with crowns/ bridges. Prosthodontic treatment with crowns/bridges was divided into preparation/impression of abutment teeth for crown, crown placement,.
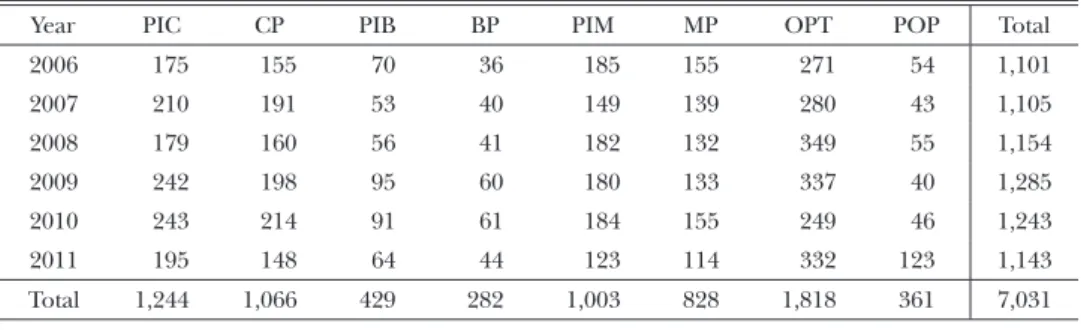
(7) 182. Yamakura D et al.. Table 5 Frequency of different types of periodontic treatment Year. PE. TBI. Scaling. SRP. Others. Total. 2006. 575. 398. 750. 529. 296. 2,548. 2007. 808. 615. 1,140. 770. 293. 3,626. 2008. 988. 680. 1,310. 961. 379. 4,318. 2009. 1,166. 668. 1,394. 806. 405. 4,439. 2010. 1,272. 939. 1,493. 1,009. 507. 5,220. 2011. 1,172. 724. 1,083. 801. 626. 4,406. Total. 5,981. 4,024. 7,170. 4,876. 2,506. 24,557 unit: times. Periodontal examination: PE, Tooth brushing instruction: TBI, Scaling and root planing: SRP. Table 6 Frequency of different types of endodontic treatment Year. PE. IRCT. RCM. RCF. Others. Total. 2006. 111. 307. 889. 236. 101. 1,644. 2007. 112. 241. 775. 202. 84. 1,414. 2008. 94. 423. 723. 176. 79. 1,495. 2009. 132. 394. 655. 208. 92. 1,481. 2010. 131. 537. 740. 202. 114. 1,724. 2011. 115. 107. 779. 147. 76. 1,224. Total. 695. 2,009. 4,561. 1,171. 546. 8,982 unit: times. Pulp extirpation under anesthesia: PE, Infected root canal treatment: IRCT, Root canal medication: RCM, Root canal filling: RCF. Table 7 Frequency of different types of conservation treatment Year. CR. PII. IP. Total. 2006. 752. 220. 192. 1,164. 2007. 654. 215. 176. 1,045. 2008. 550. 204. 173. 927. 2009. 573. 193. 154. 920. 2010. 774. 201. 181. 1,156. 2011. 550. 136. 137. 823. Total. 3,853. 1,169. 1,013. 6,035 unit: times. Composite resin filling: CR, Preparation and impression of inlay: PII, Inlay placement: IP. preparation/impression of abutment teeth for bridge, bridge placement, metal core prep aration/impression, metal core placement,. other types of prosthodontic treatment, and placement of other prostheses for summary purposes (Table 8). The most common type of prosthodontic treatment was “other types of prosthodontic treatment”, followed by crown preparation/ impression, crown placement, metal core preparation/impression, and metal core placement. This may have been because other types of prosthodontic treatment included composite resin construction and provisional restoration. The number of bridge preparation/impression and bridge placement treatments performed did not reach 100 in any year. No specific trend was observed in any type of prosthodontic treatment over the study period. (5) Prosthodontic treatment with dentures Prosthodontic treatment with dentures was.
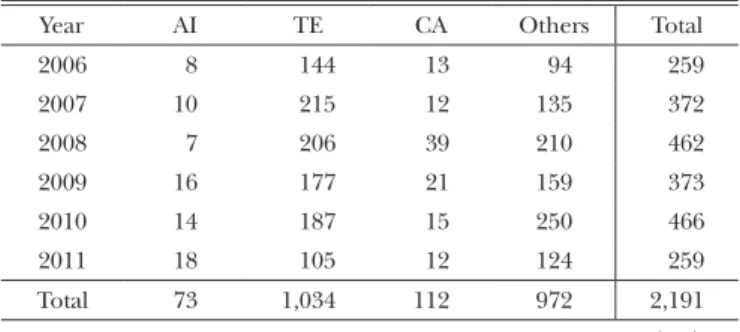
(8) 183. Dental Treatment Performed by Residents. Table 8 Frequency of different types of prosthodontic treatment with crowns/bridges Year. PIC. CP. PIB. BP. PIM. MP. OPT. POP. Total. 2006. 175. 155. 70. 36. 185. 155. 271. 54. 1,101. 2007. 210. 191. 53. 40. 149. 139. 280. 43. 1,105. 2008. 179. 160. 56. 41. 182. 132. 349. 55. 1,154. 2009. 242. 198. 95. 60. 180. 133. 337. 40. 1,285. 2010. 243. 214. 91. 61. 184. 155. 249. 46. 1,243. 2011. 195. 148. 64. 44. 123. 114. 332. 123. 1,143. Total. 1,244. 1,066. 429. 282. 1,003. 828. 1,818. 361. 7,031 unit: times. Preparation/impression for crown: PIC, Crown placement: CP, Preparation/impression for bridge: PIB, Bridge placement: BP, Preparation/impression of metal core: PIM, Metal core placement: MP, Other prosthodontic treatment: OPT, Placement of other prostheses: POP. Table 9 Frequency of different types of prosthodontic treatment with dentures Year. FI. BT. DP. DA. RD. DR. TC. Total. 2006. 79. 82. 92. 429. 110. 19. 32. 843. 2007. 118. 87. 121. 672. 82. 26. 12. 1,118. 2008. 112. 70. 107. 522. 107. 36. 11. 965. 2009. 90. 69. 108. 479. 122. 32. 21. 921. 2010. 114. 81. 132. 629. 160. 33. 17. 1,166. 2011. 77. 51. 89. 577. 147. 11. 8. 960. Total. 590. 440. 649. 3,308. 728. 157. 101. 5,973 unit: times. Final impression of removable dentures: FI, Bite taking of removable dentures: BT, Denture placement: DP, Denture adjustment: DA, Denture repair: RD, Denture relining: DR, Tissue conditioning: TC. divided into final impression taking, bite taking, denture placement, denture adjustment, denture repair, denture relining, and tissue conditioning for summary purposes (Table 9). Denture adjustment was performed most frequently in all years, accounting for more than half of all prosthodontic treatments involving dentures, followed by denture repair, denture placement, and final impression taking. The frequency of bite taking was lower than that of denture placement in all years, probably because bite taking for dentures when only a few teeth have been lost does not require a bite plate and was therefore not reported in some cases. In addition, bite taking for preparing dentures for both the. upper and lower jaw was reported as a single treatment. The frequency of final impression taking, bite taking, and denture placement dropped in 2011 compared with other years. (6) Oral surgical treatment Oral surgical treatment as further divided into three common procedures consisting of abscess incision, tooth extraction and conduction anesthesia, or other types of oral surgical treatment for summary purposes (Table 10). Tooth extraction and “other types of oral surgical treatment” were performed at a similar frequency throughout the study period and accounted for nearly 90% of all oral surgical treatment performed. The frequency of abscess incision was very low in all years, with.
(9) 184. Yamakura D et al.. Table 10 Frequency of different types of oral surgical treatment Year. AI. TE. CA. Others. Total. 2006. 8. 144. 13. 94. 259. 2007. 10. 215. 12. 135. 372. 2008. 7. 206. 39. 210. 462. 2009. 16. 177. 21. 159. 373. 2010. 14. 187. 15. 250. 466. 2011. 18. 105. 12. 124. 259. Total. 73. 1,034. 112. 972. 2,191 unit: times. Abscess incision: AI, Tooth extraction: TE, Conduction anesthesia: CA. Fig. 2 Relative proportions of different types of dental treatment performed by dental residents (2006– 2011, post-mandatory) Periodontic treatment: PT, Endodontic treatment: ET, Conservation treatment: CT, Prosthodontic treatment with crowns/bridges: CB, Prosthodontic treatment with dentures: PD, Oral surgical treatment: ST. Fig. 3 Relative proportions of different types of dental treatment performed by dental residents (2003– 2005, pre-mandatory) Periodontic treatment: PT, Endodontic treatment: ET, Conservation treatment: CT, Prosthodontic treatment with crowns/bridges: CB, Prosthodontic treatment with dentures: PD, Oral surgical treatment: ST. a peak of 18 treatments in 2011, indicating that oral antiphlogistic procedures are rarely performed at our department. The frequency of tooth extraction dropped sharply between 2007 and 2011. 3) Comprehensive discussion on dental treatment The cumulative frequency of each type of dental treatment performed by dental residents over a 6-year period from 2006 to 2011 (Fig. 2) was compared with that over a 3-year period from 2003 to 2005 in the pre-mandatory era (Fig. 3)3). The comparison revealed that the frequency of periodontic. treatment increased from 39 to 45%, while the frequency of endodontic treatment decreased slightly from 21 to 16% after the introduction of the mandatory clinical training system. This trend may have resulted from the sharing and spread of the basic policy of the general dentistry department between supervisory dentists and resident dentists; the basic policy states that oral unit treatment should be performed while maintaining good oral cleaning status and improving periodontal tissue condition. The cumulative frequencies of each type of dental treatment over the 6-year study period (Fig. 2) were compared with the national total.
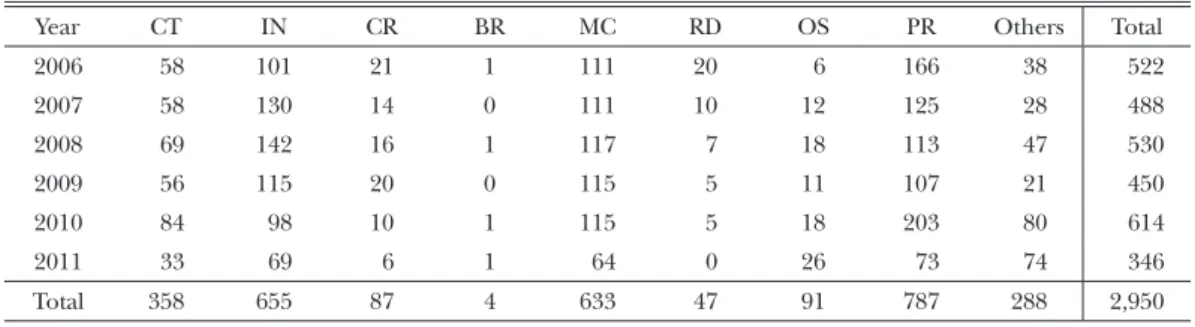
(10) 185. Dental Treatment Performed by Residents. Fig. 4 Relative proportions of different types of dental treatment performed by dentists across Japan ( June 2011) Periodontic treatment: PT, Endodontic treatment: ET, Conservation treatment: CT, Prosthodontic treatment with crowns/bridges: CB, Prosthodontic treatment with dentures: PD, Oral surgical treatment: ST. Table 11 Frequency of different types of dental technical work Year. CT. IN. CR. BR. MC. RD. OS. PR. Others. Total. 2006. 58. 101. 21. 1. 111. 20. 6. 166. 38. 522. 2007. 58. 130. 14. 0. 111. 10. 12. 125. 28. 488. 2008. 69. 142. 16. 1. 117. 7. 18. 113. 47. 530. 2009. 56. 115. 20. 0. 115. 5. 11. 107. 21. 450. 2010. 84. 98. 10. 1. 115. 5. 18. 203. 80. 614. 2011. 33. 69. 6. 1. 64. 0. 26. 73. 74. 346. Total. 358. 655. 87. 4. 633. 47. 91. 787. 288. 2,950 unit: cases. Preparation of custom trays: CT, Preparation of inlays: IN, Preparation of crowns: CR, Preparation of bridges: BR, Preparation of metal cores: MC, Preparation of removable dentures: RD, Preparation of occlusal sprints: OS, Preparation of provisional restorations: PR. of dental treatments performed in Japan in June 2011 based on the Survey of Medical Care Activities in Public Health Insurance in 2011 (Fig. 4)1). Our department had a lower frequency of periodontic treatment and higher frequency of endodontic treatment performed by dental residents than those performed by general dentists across Japan. This may be partially because periodontic treatment seldom involves periodontic surgical treatment requiring more specialized knowledge and skills and because root canal medication accounts for a large proportion of all endodontic treatment performed. Even when taking these factors into consideration, the distribution of dental. treatment performed at our department during the 6-year period was similar to that from the national survey, suggesting that dental services were provided at our department according to the purposes of clinical training. 4. Dental technical work performed by dental residents Dental technical work was divided into preparation of custom trays, inlays, crowns, bridges, metal cores, dentures, splints, and provisional restorations and other technical work for summary purposes (Table 11). Preparation of inlays, metal cores, and provisional restorations were performed at a.
(11) 186. Yamakura D et al.. similar frequency each year, accounting for nearly 70% of all technical work performed annually. This may reflect our hospital’s policy of minimizing the outsourcing of preparation of inlays, metal cores, and provisional resto rations, and the clinical training program, which mandates dental residents to perform technical work. These treatments were followed, in terms of frequency, by preparation of custom trays and other technical work. The frequency of preparation of crowns/dentures was extremely low, and preparation of bridges was performed only 4 times during the 6year period. Except for splint preparation, all types of technical work decreased in 2011 compared with the previous year. In par ticular, it should be noted that almost no bridge preparation was performed in all years. Immediate measures are required to improve the awareness of dental residents of the importance of experiencing technical dental work, as dentists are required to give precise instructions to dental technicians while taking responsibility for the preparation and management of dental prostheses.. Conclusion We summarized and analyzed the number of patients treated, types of dental treatment performed, and dental technical work performed by dental residents at the General Dentistry Department of Tokyo Dental College Chiba Hospital over 6 years after the intro duction of the mandatory dental clinical training system. The results demonstrated that appropriate clinical training has been provided at our department to offer dentists the opportunity to acquire the basic diagnostic and treatment abilities that would enable them to provide appropriate treatment for injuries and diseases frequently encountered in daily practice. This study also revealed unsolved problems such as the varying number of dental. residents each year and the relationship to patient volume, as well as the decreasing number of residents engaging in dental technical work. For additional improvement in the quality of dental clinical training, more detailed analyses are needed to further identify and address potential problems in the system.. Acknowledgements We would like to thank Associate Professor Jeremy Williams, Tokyo Dental College, for his assistance with English of this manuscript.. References 1) Survey of Social Medical and Clinical Actions 2011 (2012) http://www.e-stat.go.jp/SG1/estat/ List.do?lid=000001096339 (accessed 3 January 2013) (in Japanese) 2) Takahashi T, Tsunoda M, Sugiyama T, Yamakura D, Kondo Y, Noro A (2009) Clinical care provided on post-graduate dental clinical training course at Tokyo Dental College Chiba Hospital, Department of General Dentistry. Bull Tokyo Dent Coll 50:205–213. 3) Takahashi T, Tsunoda M, Yamakura D, Sugiyama T, Miyashita Y, Adachi R, Morinaga K, Itou A, Haruyama T, Takeda T, Nakajima K (2007) Clinical care in post-graduate dental training course at Chiba hospital General Dentistry. The Shikwa Gakuho 107:519–527. (in Japanese) 4) Tsunoda M, Takase Y, Takahashi T, Kondo Y, Noro A, Yamakura D, Sugiyama T, Kameyama A, Kukidome N, Takeda T, Nakajima K (2010) Clinical care in post-graduate dental training course at Chiba hospital General Dentistry (3rd report). The Shikwa Gakuho 110:409. (in Japanese) Reprint requests to: Dr. Daiki Yamakura Division of General Dentistry, Tokyo Dental College Chiba Hospital, 1-2-2 Masago, Mihama-ku, Chiba 261-8502, Japan E-mail: [email protected].
(12)
図

+5
関連したドキュメント
Moreover, to obtain the time-decay rate in L q norm of solutions in Theorem 1.1, we first find the Green’s matrix for the linear system using the Fourier transform and then obtain
H ernández , Positive and free boundary solutions to singular nonlinear elliptic problems with absorption; An overview and open problems, in: Proceedings of the Variational
Department of Orthopedic Surgery Okayama University Medical School Okayama Japan.. in
If condition (2) holds then no line intersects all the segments AB, BC, DE, EA (if such line exists then it also intersects the segment CD by condition (2) which is impossible due
Keywords: Convex order ; Fréchet distribution ; Median ; Mittag-Leffler distribution ; Mittag- Leffler function ; Stable distribution ; Stochastic order.. AMS MSC 2010: Primary 60E05
Keywords and Phrases: moduli of vector bundles on curves, modular compactification, general linear
Inside this class, we identify a new subclass of Liouvillian integrable systems, under suitable conditions such Liouvillian integrable systems can have at most one limit cycle, and
In order to be able to apply the Cartan–K¨ ahler theorem to prove existence of solutions in the real-analytic category, one needs a stronger result than Proposition 2.3; one needs
