• 検索結果がありません。

Understanding the Nature of Sentence-Based Error Recognition Competence from the Perspective of Listening Sub-Skills

N/A
N/A
Protected

Academic year: 2021

シェア "Understanding the Nature of Sentence-Based Error Recognition Competence from the Perspective of Listening Sub-Skills"

Copied!
21
0
0

読み込み中.... (全文を見る)

全文

(1)

Perspective of Listening Sub‑Skills

著者 KAWASHIMA Hirokatsu

journal or

publication title

The Journal of Nagasaki University of Foreign Studies

number 14

page range 213‑232

year 2010‑12‑30

URL http://id.nii.ac.jp/1165/00000147/

(2)

Understanding the Nature of Sentence-Based Error Recognition Competence from the Perspective of Listening Sub-Skills

KAWASHIMA Hirokatsu

Abstract

リスニングの下位技能の特徴を理解するための調査を日本人英語学習者を対象に行った。文レベルで の音声的、文法的、意味的な間違いを認識する能力をリスニングの重要な下位技能として位置づけ、

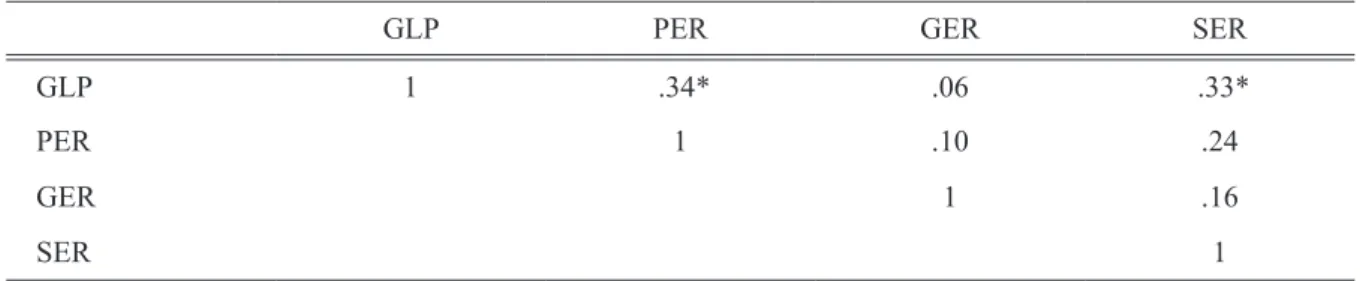
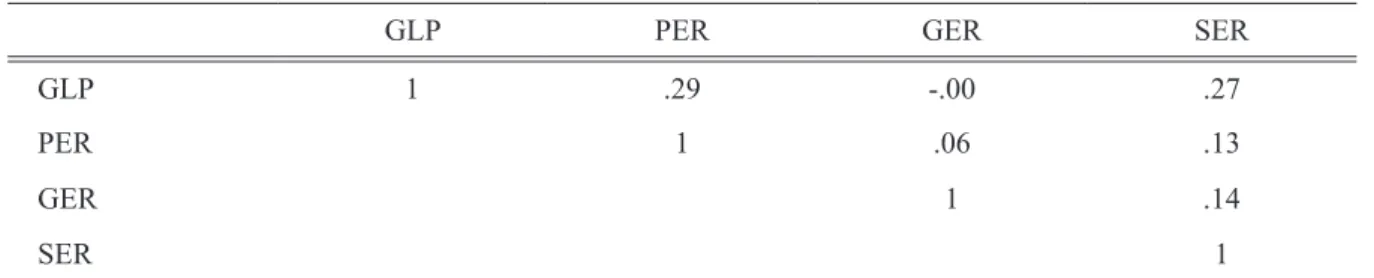
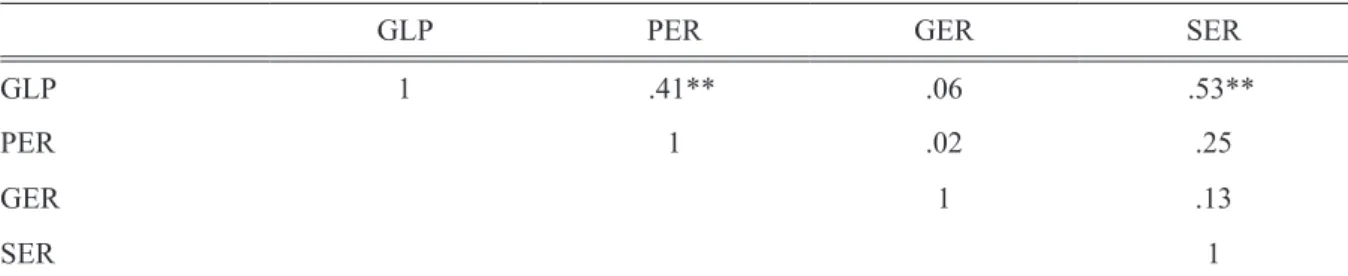
それらと総合的リスニング能力の関係を調べた。調査の結果、1)文レベルにおける意味的間違いの 認識能力のパフォーマンスが最も高く、また、総合的リスニング能力に最も深く関与している、2)

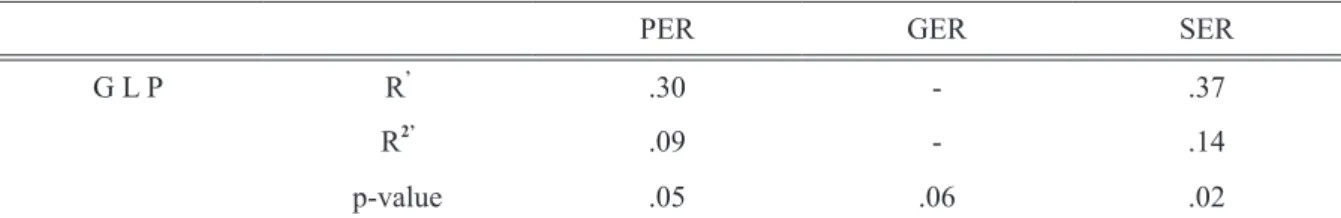
文レベルにおける音声的間違いの識別能力および意味的間違いの認識能力と総合的リスニング能力の 
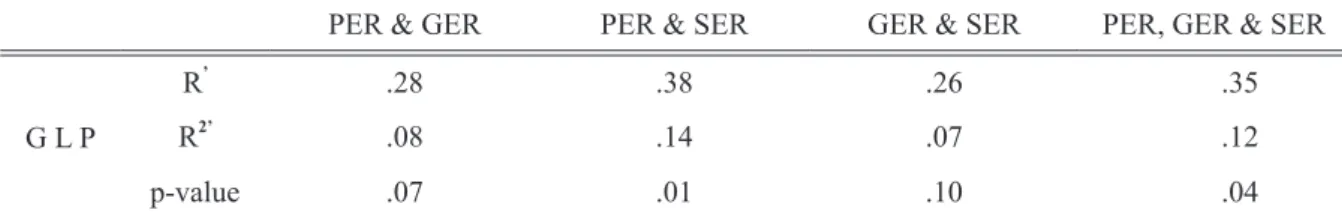
間には非線形的な関係が認められる、3)総合的リスニング能力の34%は、文レベルの意味的間違 いの識別能力と音声的間違いの認識能力で説明することができる、こと等が明らかにされている。

Background

Currently most English listening tests, especially comprehension-focused ones, tend to provide a single totaled score of a certain number of items correct, which represents test-takers’ level of listening ability. This is more or less true of the listening section of standardized English tests, including national English tests, such as the unified university entrance examination in Japan: the Center Test. It must be pointed out, however, that it is very difficult in general to interpret single totaled scores in terms of the classroom setting, and that test takers fail to specifically and properly understand their weaknesses in listening to English. For example, the 60 score a learner has got in a listening test usually means nothing more/less than 60, which does not offer him/her specific information on which part of listening skills are well developed and which must be improved.

  This kind of test situation is hardly preferable, because language teaching regularly and consistently needs feedback to learners on their progress. Unfortunately, however, little attention seems to have been directed at what the results of standardized English tests may/may not inform their test takers of, and few systematic listening tests have been developed from the perspective of classroom diagnostic assessment. One possible reason for this may be that little has been properly understood on the nature of listening sub-skills as Buck (2001: p. 257) claims that “clearly more research is needed to explore ways of describing listening ability in meaningful ways that could be used as the basis for diagnostic assessments.”

  This research situation has been gradually improved, however, by recent studies dealing directly or indirectly with the nature of listening sub-skills (e.g., Takeno & Takatsuka 2007 and Icho 2008). Takeno &

Takatsuka (p. 5), who deal with nine types of hypothetical listening sub-skills, report, for example, that general

listening proficiency has “significantly high correlation” with vocabulary/grammar (r = 0.211, p < 0.01, n = 232)

and non-verbal short-term memory (r = 0.130, < 0.05, n = 232). It is suggested in this study that vocabulary/

(3)

grammar “may affect listening comprehension ability of EFL learners,” and that short-term memory capacity

“might affect listening comprehension ability.” The same kind of empirical study, Icho (pp. 7-8), who deals with six types of hypothetical listening sub-skills, reports, for instance, that general listening proficiency has

“moderate or relatively strong correlations” with sound change recognition (r = 0.47, p < 0.05, n = 74) and verbal working memory capacity (r = 0.38, p < 0.05, n = 74). It is claimed in this study that poor sound change recognition and insufficient verbal working memory capacity “cause their [EFL learners’] failure in listening.”

  These kinds of relationships are understandable considering the importance of vocabulary/grammar and short-term memory capacity and of sound change recognition and verbal working memory in listening. It must be noted, however, that the results of the above two studies are not conclusive and need to be examined from different research perspectives. As for Takeno & Takatsuka (2007), the relationships of general listening proficiency with vocabulary/grammar and short-term memory seem to be overestimated, for example. They were certainly proved to be statistically significant, but only 4.5% and 1.7% of the variance of general listening proficiency can be accounted for by vocabulary/grammar and non-verbal short-term memory, respectively. It may be not appropriate to claim, just based upon statistical significance, that general listening proficiency has

“significantly high correlation” with vocabulary/grammar and non-verbal short-term memory. All that can be ascertained at this stage is that there are some weak relationships between general listening proficiency and vocabulary/grammar and non-verbal short-term memory.

  As far as Icho (2008) is concerned, it must be pointed out that little attention is directed at interrelationships among the targeted listening sub-skills, for instance. Although it is found that verbal working memory is

“moderately” related to general listening proficiency, it may be possible that such a relationship is superficially recognized because of the influences of the other listening sub-skills, and that verbal working memory is in fact strongly related to general listening proficiency. The results of this study are based upon simple correlation analysis alone, but partial correlation analysis, which examines the relationship between two variables after removing the influence of other variables, may show somewhat different results. The use of partial correlation analysis may show no difference, but it is highly advisable that it should be employed, too, as it is deemed to enhance understanding of the nature of listening sub-skills.

  These research perspectives exemplified above are important, but it may be more important to view research assuming that the nature of listening sub-skills should involve multi-faceted and complicated aspects. In Takeno &

Takatsuka (2007) and Icho (2008), relationships between general listening proficiency and the targeted listening sub-

skills are examined separately employing simple correlation analysis. Some relationships, however, may be multi-

faceted considering that listening sub-skills are more or less related to one another and that there should be some

overlaps between one and the others, and need to be examined accordingly in a comprehensive manner: employing

multiple correlation analysis, for example. With regard to complicated aspects that listening sub-skills may have,

Takeno & Takatsuka (2007) and Icho (2008) presuppose that relationships between general listening proficiency and

listening sub-skills should be linear, in which no attention is paid to non-linearity. It is quite conceivable, however,

that some relationships are more complicated than has been possibly imagined, embracing non-linearity. If these two

studies are viewed from the perspective of multi-correlation and non-linearity, too, different aspects of the nature of

listening sub-skills may be disclosed.

(4)

  As a review of the literature shows (Rost 2002, Field 2008, and Nation & Newton 2009), much of the nature of learning and teaching of listening remains unclear and unexplored, and it is not yet clear exactly what listening sub-skills are composed of. Elucidating even the nature of listening sub-skills itself seems to require various types of empirical studies, but those taking the above research directions into consideration will bring us one step closer to the nature of listening sub-skills.

Current Study

The author launched a research project in 2007 in an attempt to elucidate the nature of listening sub-skills, in which a series of empirical studies have been conducted. The current study, which is a basic investigation conducted as part of this project, aims at offering a clearer map of the nature of sub-skills of listening.

  Its research designs are summarized below, and then some of the major findings are reported.

1. Research Designs 1.1 Research Questions

The current study involves four main research questions:

1) Which of the listening sub-skills (cf., 1.2 below) is the most/least difficult in performance?

2) Which of the listening sub-skills is the most/least related in performance to comprehension-based general listening proficiency?

3) Are there any non-linear relationships between the listening sub-skills and comprehension-based general listening proficiency? If so, how large are they?

4) What is the best combination of the listening sub-skills that may well account for the variance of comprehension-based general listening proficiency?

1.2 Defining Listening Sub-skills

As has been stated above, it is not clear yet exactly what listening sub-skills are composed of, and their nature

is little understood. It can be claimed that since they are deemed to be more or less interrelated and overlapped

with one another, it is not easy to clearly identify what listening sub-skills are. In Takeno & Takatsuka (2007)

and Icho (2008), hypothetical listening sub-skills were more or less defined and measured at the sentence

level, such as sentence repeatability and verbal working memory capacity. This research approach is quite

(5)

understandable and in a way standard looking at Buck’s framework (2001: p. 105) for describing listening ability, in which the importance of “knowledge of the sound system” and “understanding local linguistic meaning” is discussed, for example. It must be pointed out, however, that in order to enhance the identification of listening sub-skills at the sentence level, research needs to be conducted defining them more precisely so that they may be well compared and closely examined in terms of interrelatedness and overlap.

  Although dictation, which is also used to measure verbal working memory capacity in Icho (2008), is claimed to be one important listening sub-skill at the sentence level (e.g., Hio 1983, Sugawara 1999, and Field 2008), there is little empirically-based systematic consensus on what sentence-based listening sub-skills should be, because such a consensus depends upon a clear definition of what it is to process and understand spoken sentences. The current study, which holds that sentence-level listening may embrace some important elements of listening sub-skills, assumes that if a listener can recognize errors in uttered sentences (known as error recognition tasks), it means that he/she is also capable of processing and understanding spoken sentences properly.

  Flowerdew & Miller (2005: p. 30) claim that “ in order to comprehend a spoken message, four main types of knowledge may be drawn: phonological–the sound system; syntactic–how words are put together; semantic–

word and propositional knowledge; and pragmatic–the meaning of utterances in particular situations.” The current study, considering that the last type of knowledge, pragmatics, is difficult to deal with at sentence-level listening, focused upon the other three, and three types of sentence-based phonetic/grammatical/semantic error recognition tasks were constructed for the investigation.

  The following PE1) and PE2) are examples of sentence-based phonetic error recognition tasks, in which the subjects listen to ten-word short sentences and judge if they are phonetically correct:

PE1) The center of the city is far away from here. (phonetically correct) PE2) I don’t sink this Saturday is good to go out. (phonetically incorrect)

  The following GE1) and GE2) are examples of sentence-based grammatical error recognition tasks, in which the subjects listen to ten-word short sentences and judge if they are grammatically correct:

GE1) The student said she was interested in international volunteer work. (grammatically correct) GE2) This song is very popular between girls in Asian countries. (grammatically incorrect)

  The following SE1) and SE2) are examples of sentence-based semantic error recognition tasks, in which the subjects listen to ten-word short sentences and judge if they are semantically correct:

SE1) I started going to school when my parents became rich. (semantically correct)

SE2) Kaori enjoyed swimming yesterday, because she had a bad cold. (semantically incorrect)

(6)

1.3 General Listening Proficiency

In order to measure learners’ general listening proficiency, the current study employed the listening sections of standardized objective tests (STEP Grade 2), which are widely and frequently administered in Japan.

1.4 Subjects

91 first-year students of the general education course at a university in Japan participated in the current investigation.

1.5 Materials

1.5.1 General Listening Proficiency

In order to measure the subjects’ general listening proficiency (referred to as GLP hereinafter), three sets of listening sections of STEP Grade 2 tests were used, which had been originally designed to match the level of high school graduates in general and administered in June 21 and October 8, 1998 and June 18, 2000. Each set had 20 four-option multiple-choice test items, and 60 test items were used in total.

1.5.2 Listening Sub-Skills

In order to measure the subjects’ listening sub-skills (referred to as LSS hereinafter), 20 ten-word and 20 fifteen- word sentences were prepared for each of sentence-based phonetic/grammatical/semantic error recognition tasks, respectively. All these sentences, 120 in total, were recorded onto CD at a self-selected normal speaking rate by a male native speaker of English.

1.6 Data Collection and Procedure

The investigation was conducted during regular English classes, which lasted from the beginning of April to the end of July in 2008. Their main goal was to improve the learners’ overall listening proficiency.

1.6.1 Measuring GLP

The subjects took three GLP tests at certain intervals in order to grasp their general listening proficiency and

monitor their progress periodically: at the middle of April, the beginning of June, and the end of July. About

20 minutes were allocated for each test, after which the distributed computer-scored investigation sheets were

collected, and then the subjects immediately checked with their sub-investigation sheet if their answers were

correct and grasped their general listening proficiency by the totaled score.

(7)

1.6.2 Measuring LSS

The subjects took eight LSS tests as part of their regular classroom listening activities, in which they carried out the sentence-based phonetic/grammatical/semantic error recognition tasks and checked their weaknesses in listening to English. Prior to measuring their LSS, which started in the middle of May in 2008, the subjects had received general instructions about LSS tests as classroom listening activities and taken three similar practice LSS tests so that they could get accustomed to their forms and contents. These three practice LSS tests were considered to serve to increase the subjects’ awareness of the significance of grasping their LSS competence and to make them fully prepared for the investigation and its procedures.

  During each of the first four classes, the subjects listened to 5 ten-word sentences for each of the sentence- based phonetic/grammatical/semantic error recognition tasks. Likewise, during each of the next four classes, the subjects listened to 5 fifteen-word sentences for each of the sentence-based phonetic/grammatical/semantic error recognition tasks. About 20 minutes were allocated for each class, after which the distributed investigation sheets were collected, and then the subjects immediately checked with their sub-investigation sheet if their answers were correct and grasped their LSS competence.

2. Scoring and Processing of the Data

All the investigation sheets were collected after each of the classes was over, and the raw data were scored, examined, and processed for analysis.

2.1 Scoring

With regard to GLP tests, the computer-scored investigation sheets were read and processed by an optical mark reader (SR-3500, Sekonic) and a mark reader computer software (SS kun II, Software for Education), in which the correctness of each test item was provided with the item scores (0, 1) representing correct and incorrect answers, respectively.

  As far as the sentence-based phonetic/grammatical/semantic error recognition tasks of the LSS tests were concerned, the correctness of each test item on the investigation sheets was carefully checked by the author with the same item scores above.

2.2 Handling Missing Data

The whole scored data had a number of missing data, which is understandable considering that data collection

was carried out for about three months. Each of the classes saw some different subjects unable to participate in

the investigation itself because of their personal reasons, such as illness. Obviously there were some subjects

who found themselves unable to follow task instructions properly because of lack of concentration, failing to

offer required information. Since the current study employs multivariate statistics, which basically assumes

(8)

the data to have valid values for every variable for a subject, every set of data that the subjects had provided was omitted if it contained any missing data. After meticulous examination, the current study determined that complete and valid data obtained from 45 subjects, out of 91, should be used for analysis.

2.3 Examining Internal Consistency Reliability

The selected data were then examined in terms of internal consistency reliability using the Cronbach Alpha coefficient.

1)

First, the internal consistency reliability coefficient of the three GLP tests (the total number of test items is 60) and those of the LSS tests (sentence-based phonetic/grammatical/semantic error recognition tasks, the numbers of whose test items are 40, 40, and 40, respectively) were measured. Table 1 presents their results:

  As is quite obvious from this table, the internal consistency reliability of the sentence-based phonetic/

grammatical/semantic tasks is extremely low. A number of reasons are deemed to lie behind this, but it must be noted that the small number of subjects and the inappropriateness of some of the sentence-based phonetic/

grammatical/semantic tasks in the LSS tests seem most likely to have caused this kind of poor internal consistency reliability. Higher internal consistency reliability may be obtained with a greater number of subjects, but since the number of subjects is uncontrollable after the investigation, the current study made some attempts to raise the internal consistency reliability of the sentence-based phonetic/grammatical/semantic tasks by paying careful attention to each test item used and reconsidering what should constitute those tasks.

  It is generally assumed that Cronbach Alpha coefficient should exceed at least 0.7 for reliable analysis, so the current study has expunged a number of “unsuitable” test items from each test item list of the sentence- based phonetic/grammatical/semantic tasks so that Cronbach Alpha coefficients might get as closer to 0.7 as possible. Table 2 presents the results of measuring the internal consistency reliability coefficients of the LSS tests (sentence-based phonetic/grammatical/semantic error recognition tasks) whose original test items have been restructured:

Table 1: Internal Consistency Reliability by Cronbach Alpha Coefficient (Original Test Items)

GLP PER GER SER

Number of Test Items 60 40 40 40

Cronbach Alpha Coefficient .77 .29 .09 .60

PER: Phonetic Error Recognition GER: Grammatical Error Recognition SER: Semantic Error Recognition

Table 2: Internal Consistency Reliability by Cronbach Alpha Coefficient (Restructured Test Items)

PER GER SER

Number of Test Items 19 22 22

Cronbach Alpha Coefficient .65 .60 .72

PER: Phonetic Error Recognition GER: Grammatical Error Recognition SER: Semantic Error Recognition

(9)

  It is found from this Table 2) that a great number of test items have been removed from the LSS tests (sentence-based phonetic/grammatical/semantic error recognition tasks), and consequently that their internal consistency reliability has been greatly increased as a whole, although Cronbach Alpha coefficients in excess of 0.70 have not been obtained except for the LSS test (semantic error recognition tasks). With regard to the first point, the current study assumes that although the degree at which the original test items were reduced may be viewed as quite large, downgrading the construct validity, the numbers of the reduced test items, 19, 22, and 22 for sentence-based phonetic, grammatical, and semantic error recognition tasks, respectively, should stay within an acceptable range of construct validity although not optimal.

  As far as the second point is concerned, the current study more or less takes Dörnyei (2007: p.207)'s view that “somewhat lower Cronbach Alpha coefficients are to be expected” owing to “the complexity of the second language acquisition process”, and holds that although the Cronbach Alpha coefficients of the sentence-based phonetic and grammatical error recognition tests (0.65 and 0.60, respectively) fall below 0.70, those tests can be used to a certain degree while paying attention to their limits in terms of internal consistency reliability.

2.4 Examining Normal Distribution

Lastly, the restructured data of the GLP and LSS tests was examined in terms of normal distribution, upon which the statistical analyses of the current study are based. Shapiro-Wiki tests, whose α value had been set at 0.01, were conducted for this examination.

2)

Table 3 presents the results:

  It is statistically found from this table that the restructured data of the GLP tests and LSS tests (sentence- based phonetic and grammatical error recognition tasks) is normally distributed, in which each p-value is much greater than 0.01. The p-value of the LSS tests (sentence-based semantic error recognition tasks) in Table 3 is the figure rounded off to the second decimal place. Originally, this p-value was calculated to be 0.011, greater than the setαvalue. A pure statistical stance may claim automatically that since the p-value is greater than 0.01, the restructured data of the LSS tests (sentence-based semantic error recognition tasks) should be normally distributed, but it must be noted that the difference between both α-value and p-value was quite small, and that careful attention is needed before becoming conclusive. The current study examined the normal distribution of this restructured data by looking at the following Normal Q-Q Plot:

Table 3: Normal Distribution of the Restructured Data of the GLP and LSS Tests (α= .01)

GLP PER GER SER

W .98 .98 .97 .93

p-value .48 .60 .25 .01

PER: Phonetic Error Recognition GER: Grammatical Error Recognition SER: Semantic Error Recognition

(10)

  The straight line in Figure 1 presents what the data would look like if it were perfectly normally distributed, and the actual data is represented by the small squares plotted along this line. The closer the small squares are located to the line, the more normally distributed the data is plotted. The current study assumes that most of the small squares fall along the line, though not perfectly, and that the restructured data of the LSS tests (sentence- based semantic error recognition tasks) is normally distributed.

3. Data Analysis

The pre-examined data above were then processed for analysis.

3.1 Descriptive Statistics

First, the minimum, maximum, mean score and standard deviation of the processed data of the GLP and sentence-based error recognition competence (referred to as SBERC hereinafter) tests were calculated.

1)

The results are presented in Table 3:

  This table shows that the subjects’ performance of the SBERC tests may vary with the three types of error recognition, and that it may be the highest in semantic error recognition (mean: 15.20).

Table 3: Descriptive Statistics for the GLP and SBERC Tests

GLP PER GER SER

Min. 14.00 5.00 6.00 7.00

Max. 46.00 19.00 20.00 21.00

Mean 29.16 12.20 12.20 15.20

S.D. 7.14 3.26 3.48 3.81

PER: Phonetic Error Recognition GER: Grammatical Error Recognition SER: Semantic Error Recognition

Figure 1: Normal Q-Q Plot

(11)

3.2 Performance of the Sentence-Based Error Recognition Tests

In order to verify the above tentative results with statistic significance, the current study first examined the data employing GLM Repeated Measures.

3)

The results are presented in Table 4 and Table 5:

  As Table 4 shows, the assumption of sphericity is valid for data analysis (p = 0.84). Table 5, based upon this statistical validity, claims that the subjects’ performance of the SBERC tests varies significantly with their types [(F (2, 88) = 12.76, p = .00) ].

  Multiple comparisons by Bonferroni, which could be used for repeated measured data, were then conducted in order to examine whether the subjects’ performance of the semantic error recognition test was the highest among the three types. The results are presented in Table 6:

Table 4: Mauchly Test of Sphericity

Epsilon Within-Subject

Effect Mauchly’W Approximateative

Chi-Square df P

-Value Greenhouse-

Geisser Huynh-

Feldt Infimum

Types of Tasks .99 .36 2 .84 .99 1.00 5.00

Table 5: Test of Within-Subject Effect

Sums of Squares:

Type III df Mean Square F-Value P-Value

Type Assumption of Sphericity 270.00 2 135.00 12.76 .00

Greenhouse-Geisser 270.00 1.98 136.11 12.76 .00

Huynh-Feldt 270.00 2.00 135.00 12.76 .00

Infimum 270.00 1.00 270.00 12.76 .00

Error Assumption of Sphericity 931.33 88 10.58

Greenhouse-Geisser 931.33 87.28 10.67

Huynh-Feldt 931.33 88.00 10.58

Infimum 931.33 44.00 21.17

Table 6: Multiple Comparisons by Bonferroni for the SBERC Data

Combination Difference MSe P-Value

PER-GER 0.00 .68 1.00

GER-SER 3.00 .71 .00

SER-PER 3.00 .66 .00

PER: Phonetic Error Recognition GER: Grammatical Error Recognition SER: Semantic Error Recognition

(12)

  This table shows 1) that there is a statistically significant difference in performance between semantic error recognition and either phonetic or grammatical error recognition (MSe = 0.66 & P = 0.00, and MSe = 0.71 &

P = 0.00, respectively), and consequently 2) that the subjects’ performance of the semantic error recognition is certainly the highest among the three types. Figure 2) illustrates the results on a horizontal line:

Figure 2: Performance of Sentence-Based Error Recognition

High Semantic Error Recognition > Grammatical Error Recognition = Phonetic Error Recognition Low

3.3 Linear Relationships between General Listening Proficiency and Sentence-Based Error Recognition Competence

In order to explore linear relationships between general listening proficiency and sentence-based error recognition competence, their simple linear correlation coefficients were first computed.

4)

Table 7 presents the results:

  This table shows 1) that some types of sentence-based error recognition competence are related with statistic significance to general listening proficiency (phonetic and semantic error recognition competence), and 2) that the strengths of the relationships of phonetic and semantic error recognition competence with general listening proficiency are almost identical (r = 0.34 , < 0.05 and r = 0.33, < 0.05, respectively).

  It must be noted, however, that these relationships may be superficial and unstable, because it is possible that they are mere reflections of some unrevealed third relationships (known as pseudo correlations), subsistent in the nature of sentence-based error recognition. In order to closely examine these relationships between general listening proficiency and sentence-based error recognition, partial regression analysis was conducted, in which partial regression coefficients of direct relationships between two variables were computed, thereby eliminating the influences of the rest. Table 8 presents the results:

Table 7: Simple Correlation Matrix for the GLP and SBERC Data

GLP PER GER SER

GLP 1 .34* .06 .33*

PER 1 .10 .24

GER 1 .16

SER 1

PER: Phonetic Error Recognition GER: Grammatical Error Recognition SER: Semantic Error Recognition * < .05

(13)

  This table shows that none of the three types of sentence-based error recognition competence is related with statistic significance to general listening proficiency. This result may need some careful examination, but considering the figures in Table 8 and the nature of statistical significance in a broad sense, the relative strength of relationships in performance between general listening proficiency and sentence-based error recognition competence might be delineated on a horizontal line as in Figure 3:

Figure 3: Relative Strength of Relationships between General Listening Proficiency and Sentenced-Based Error Recognition Competence

Strong Phonetic Error Recognition = Semantic Error Recognition > Grammatical Error Recognition Weak

3.4 Non-Linear Relationships between General Listening Proficiency and Sentence-Based Error Recognition Competence

The simple/partial linear regression analysis in 3.3 above has examined if there is a statistically significant relationship between general listening proficiency and sentence-based error recognition competence, and showed its strength. It must be pointed out, however, that even if such a relationship is not recognizable, it does not directly mean that there is no relationship between the two variables, because the analysis presupposes that relationships between general listening proficiency and sentence-based error recognition competence are linear, and therefore because it fails to recognize non-linear relationships, such as quadratic ones. In order to better understand relationships between general listening proficiency and sentence-based error recognition competence, they must be viewed also from the perspective of non-linearity. There are a number of ways to explore the non-linearity of relationships between two variables. As a first step, the current study has focused upon exploring quadratic and cubic relationships between general listening proficiency and sentence-based error recognition competence.

5)

3.4.1 Quadratic and Cubic Relationships

First, quadratic relationships were examined between general listening proficiency and sentence-based error recognition competence, and their multiple coefficients and coefficients of determination were calculated. The Table 8: Partial Correlation Matrix for the GLP and SBERC Data

GLP PER GER SER

GLP 1 .29 -.00 .27

PER 1 .06 .13

GER 1 .14

SER 1

PER: Phonetic Error Recognition GER: Grammatical Error Recognition SER: Semantic Error Recognition

(14)

results are shown in Table 9:

  This table shows that although they are not very strong, quadratic relationships are recognizable between general listening proficiency and sentence-based error recognition competence (PER: p = 0.05 and SER: p = 0.02).

  Next, examinations were likewise conducted in order to determine if there were cubic relationships between general listening proficiency and sentence-based error recognition competence, and their multiple coefficients and coefficients of determination were calculated. The results are shown in Table 10:

  This table shows that although they are not very strong, cubic relationships are also recognizable between general listening proficiency and sentence-based error recognition competence (PER: p = 0.05 and SER: p = 0.00).

  Careful consideration must be taken in order to determine which statistically significant non-linearity may represent in a more accurate and comprehensive manner the relationship between general listening proficiency and sentence-based error recognition competence. The current study, paying attention to the distribution of the actual data, assumes as a first step 1) that the strength of coefficient of determination adjusted for the degree of freedom may be used for such a purpose, and 2) that higher coefficient of determination adjusted for the degree of freedom indicates that the relationship between general listening proficiency and sentence-based error recognition competence can be represented better by its non-linearity.

  It follows from this assumption that relationships between general listening proficiency and sentence- based error recognition competence are more cubic (11% and 23% of the variance of GLP can be accounted for by PER and SER, respectively) than quadratic (9% and 14% of the variance of GLP can be accounted for by Table 9: Multiple Coefficients and Coefficients of Determination in Quadratic Relationships between

General Listening Proficiency and Sentence-Based Error Recognition Competence

PER GER SER

G L P R

.30 - .37

R

2’

.09 - .14

p-value .05 .06 .02

GLP: General Listening Proficiency PER: Phonetic Error Recognition GER: Grammatical Error Recognition SER: Semantic Error Recognition R

: multiple coefficient adjusted for the degree of freedom R

2’

: coefficient of determination adjusted for the degree of freedom

Table 10: Multiple Coefficients and Coefficients of Determination in Cubic Relationships between General Listening Proficiency and Sentence-Based Error Recognition Competence

PER GER SER

G L P R

.33 - .48

R

2’

.11 - .23

p-value .05 .06 .00

GLP: General Listening Proficiency PER: Phonetic Error Recognition GER: Grammatical Error Recognition SER: Semantic Error

Recognition R

: multiple coefficient adjusted for the degree of freedom R

2’

: coefficient of determination adjusted for the degree of

freedom

(15)

PER and SER, respectively), although neither quadratic or cubic relationships were recognized between general listening proficiency and GER.

3.4.2 Directness of Non-Linear Relationships

As has been stated above in 3.3, these cubic relationships may be superficial, unstable and merely reflections of some unrevealed third relationships (known as pseudo correlations). In order to confirm that they are intrinsic and stable, partial regression analysis was conducted, for which the non-linear cubic data was transferred into linear data. Table 11 presents the results:

  This table shows 1) that phonetic and semantic error recognition competence are related with statistic significance to general listening proficiency, and 2) that the strength of the relationship of semantic error recognition competence with general listening proficiency (r = 0.53, < 0.05) is greater than that of phonetic error recognition competence (r = 0.41, < 0.05). Based upon these partial regression results and the nature of statistical significance in a broad sense, the relative strength of relationships in performance between general listening proficiency and sentence- based error recognition competence may be delineated on a horizontal line as in Figure 4:

Figure 4: Relative Strength of Relationships between General Listening Proficiency and Sentence-Based Error Recognition Competence Based upon their Non-Linearity

Strong Semantic Error Recognition > Phonetic Error Recognition > Grammatical Error Recognition Weak

3.5 Relationships between General Listening Proficiency and Sentence-Based Error Recognition Competence Based upon Multi-Regression Analysis

Figure 4 above shows one aspect of relationships between general listening proficiency and sentence-based error recognition competence. The current study has also investigated these relationships in a comprehensive manner by conducting multi-regression analysis.

6)

First, the predictive power of each combination of two of the three types of sentence-based error recognition competence (PER, GER and SER) and that of all the three types with general listening proficiency was examined employing their linear data used above in 3.3. The results are shown in Table 12:

Table 11: Partial Correlation Matrix for the GLP and SBERC Data with Linear Transformation

GLP PER GER SER

GLP 1 .41** .06 .53**

PER 1 .02 .25

GER 1 .13

SER 1

PER: Phonetic Error Recognition GER: Grammatical Error Recognition SER: Semantic Error Recognition ** < 0.01

(16)

  This table shows 1) that the best combination of two of the three types of sentence-based error recognition competence (PER, GER and SER), which generates the highest predictive power with general listening proficiency, is PER & SER, 2) that this combination can account for 14% of the variance of general listening proficiency (p = 0.01), and 3) that this accountability is slightly better than the one created by all the three types of sentence-based error recognition competence: 12%.

  Next, the predictive power of each combination of two of the three types of sentence-based error recognition competence (PER, GER and SER) and that of all the three types with general listening proficiency was likewise examined employing their non-linear cubic data transformed for linear multi regression analysis used above in 3.4. The results are shown in Table 13:

  This table shows 1) that the best combination of two of the three types of sentence-based error recognition competence (PER, GER and SER), which generates the highest predictive power with general listening proficiency, is PER & SER, too, 2) that this combination can account for 34% of the variance of general listening proficiency (p = 0.00), which is much greater than the linear result above (14%), and 3) that its accountability (34%) is also slightly greater than that created by all the three types of sentence-based error recognition competence: 32%.

Table 12: Predictive Power of Sentence-Based Error Recognition Competence with General Listening Proficiency Based upon the Linear Data

PER & GER PER & SER GER & SER PER, GER & SER G L P

R

.28 .38 .26 .35

R

2’

.08 .14 .07 .12

p-value .07 .01 .10 .04

GLP: General Listening Proficiency PER: Phonetic Error Recognition GER: Grammatical Error Recognition SER: Semantic Error Recognition R

: multiple coefficient adjusted for the degree of freedom R

2’

: coefficient of determination adjusted for the degree of freedom

Table 13: Predictive Power of Sentence-Based Error Recognition Competence with General Listening Proficiency Based upon Non-Linear Cubic Data

PER & GER PER & SER GER & SER PER, GER & SER G L P

R

.37 .58 .50 .57

R

2’

.14 .34 .25 .32

p-value .02 .00 .00 .00

GLP: General Listening Proficiency PER: Phonetic Error Recognition GER: Grammatical Error Recognition SER: Semantic Error

Recognition R

: multiple coefficient adjusted for the degree of freedom R

2’

: coefficient of determination adjusted for the degree of

freedom

(17)

4. Summary & Discussion

The above analyses have made clear several points with regard to the nature of sentence-based error recognition competence.

4.1 Performance of Sentence-Based Error Recognition

It has been found that there is no statistically significant difference in the subjects’ performance between sentence-based phonetic and grammatical error recognition, and that the performance of sentence-based semantic error recognition outweighs that of the other two types of error recognition with statistic significance.

In theory, several other possibilities may be considered regarding the performance difficulty of the three types of sentence-based error recognition. It is quite possible, for example, that the performance of sentence-based semantic error recognition is the lowest considering that its proper feasibility depends upon understanding the whole meaning of the given sentence well.

  It is hard to correctly and comprehensively interpret this research finding with the limited data, but a possible interpretation can be attempted taking the general nature of error recognition of spoken sentences into account. Its essence may be integrated as follows:

  1) The processing of spoken sentences may be more semantic-focused than phonetic/grammatical-focused considering its time-restricted nature (uttered sentences have to be processed and comprehended along the time axis) and their elements of general daily-like conversations (in which usually relatively less attention is directed at their phonetic and grammatical errors than semantic ones).

  2) The subjects thus may have found it more difficult to recognize phonetic and grammatical errors than semantic ones, and their performance of sentence-based semantic error recognition was better than that of sentence-based phonetic and grammatical error recognition.

  Assuming that this kind of interpretation is correct, some claims can be made developmentally when heeding how the sentence is uttered and listened to. In the current study, the subjects listened to the sentences spoken at a self-selected normal speaking rate as mentioned in 1.5.2 above. It is highly likely that if the sentences had been spoken at a different self-selected normal speaking rate, a faster speed, for example, the subjects would have found it even more difficult to recognize phonetic and grammatical errors than semantic ones. This presumption may be generalized as follows:

  3) It may be more difficult to recognize phonetic and grammatical errors than semantic ones when the sentence is uttered at a faster speed.

  Furthermore, two developmental claims may be laid, too, from the perspective of general relationships

between semantic error recognition and phonetic/grammatical error recognition and of learners’ listening

(18)

proficiency. Their essence would be integrated as follows:

  4) Sentence-based phonetic and grammatical error recognition may become more difficult than sentence- based semantic error recognition both when the whole meaning of the sentence must be properly understood and when its phonetic and grammatical errors are not “locally embedded,” in which they can be easily identified and understood, but deeply related to the whole meaning.

  5) 4) may be more true of learners of lower listening proficiency, who are able to catch general meanings of spoken sentences to a certain degree but fail to turn their substantial attention to their details, whereas those of higher listening proficiency may be able to understand spoken sentences much better with balanced attention to their phonetic and grammatical elements.

  Future empirical studies may examine the validity of the above interpretation, in which more of the nature of the performance of sentence-based error recognition would be elucidated.

4.2 Sentence-Based Error Recognition Competence and General Listening Proficiency

With regard to relationships between sentence-based error recognition competence and general listening proficiency, a number of findings have been made by the above analyses, the essence of which can be integrated as follows:

  1) Relationships between sentence-based phonetic/semantic error recognition competence and general listening proficiency are multi-faceted and complicated, embracing non-linear cubic elements.

  2) Overall, semantic error recognition competence is most related with statistic significance to general listening proficiency as a single variable, whereas grammatical error recognition competence is hardly related.

  3) The combination of sentence-based phonetic and semantic error recognition competence generates the highest predictive power with general listening proficiency (explaining 34% of the variance) when their non-linear cubic elements are combined.

  It is hard to correctly and comprehensively interpret these research findings with the limited data, but some

possible interpretations can be made taking the general nature of error recognition of spoken sentences into

account as claimed in 4.1 above. Usually relationships between two variables such as semantic error recognition

competence and general listening proficiency are assumed to be linear, in which correlation coefficients, the

strength of the linear association between two variables, are measured. The current study, however, challenged

this assumption, and a new finding [see 1) above] has been made, which deserves attention. In general, non-

linear relationships are not easy to interpret, but considering a property pertaining to the cubic curve, the non-

linearity of finding 1) may be overall understood as follows:

(19)

  4) Phonological/semantic error recognition competence increases sharply as general listening proficiency does.

  5) Phonological/semantic error recognition competence then increases less sharply or stays at a certain level for a certain period even though general listening proficiency goes up.

  6) Phonological/semantic error recognition competence starts to increase sharply again as general listening proficiency does.

  These “stages” or “changes” in the relationships between phonological/semantic error recognition competence and general listening proficiency are understandable considering the non-linear development of language-related competence and proficiency that average learners often experience. Such “changes” may represent better the nature of relationships between phonological/semantic error recognition competence and general listening proficiency. It may be even possible to claim that relationships between language-related variables are more non-linear than linear.

  As far as the research finding 2) above is concerned, the strongest relationship between semantic error recognition competence and general listening proficiency is quite understandable considering that the processing of spoken sentences may be more semantic-focused than phonetic/grammatical-focused as mentioned in 4.1 above. It is hard to presume, however, that grammatical error recognition competence is not related to general listening proficiency. In theory, grammar plays an important role in processing spoken sentences, and grammatical error recognition competence should be more or less related to general listening proficiency.

Several reasons for this can be considered. One possible reason is that the research materials may not have been suitable for measuring grammatical error recognition competence, and that they may have examined something else. The current study used This song is very popular between girls in Asian countries as a grammatically incorrect sentence as stated in 1.2 above. The preposition between in this sentence may have been too difficult or too easy to function as an appropriate measure of grammatical error recognition competence, for example.

Another possible reason is that some of the research data to measure grammatical error recognition competence may have been reduced in order to raise the internal consistency reliability of the target data. It is highly likely that a number of suitable test items were lost in the process of reduction, and therefore that grammatical error recognition competence was not measured properly.

  Finding 3) above shows that phonological/semantic error recognition competence may be independent important elements of general listening proficiency or listening sub-skills. It must be noted, however, that only 34% of the variance of general listening proficiency is accounted for by phonological/ semantic error recognition competence, and that the remaining 66% remains unexplained. It is unknown at this moment whether the figure 34% is inherently the maximum and unchangeable, but it may be possible to raise it with more accurately measured grammatical error recognition competence, for instance.

  Future empirical studies should examine the validity of the above interpretation, in which more of the

nature of relationships between sentence-based error recognition competence and general listening proficiency

(20)

would be elucidated.

Concluding Remarks

The current study is a basic investigation conducted as part of a research project that the author started in 2007 in an attempt to obtain a clearer map of the nature of listening sub-skills. The results reported and discussed above are tentative and must be reexamined from several experimental perspectives. Firstly, more control of such experimental factors as internal consistency reliability, construct validity, and their balance of test items is needed, and careful attention must also be directed at the validity of general listening proficiency. Secondly, more subjects must be used, and their language learning-related backgrounds should also be considered.

Thirdly, more attention must be paid to how to make appropriate interpretation of non-linearity of the data as well as to using different mathematical models. Finally, the speed at which the subjects listen to target sentences must be controlled. A higher speed is considered to make it more difficult for learners to process and comprehend spoken sentences. Future studies, taking these points into account, will take us closer to a clear map of the nature of listening sub-skills.

Notes

1) SPSS (Version 16.0.: SPSS Inc.) was used for this examination/analysis.

2) XLSTAT-PRO (Version 2009.: Addinsoft Inc.) was used for this examination/analysis.

3) SPSS (Version 16.0.: SPSS Inc.) was used for this examination/analysis.

4), 5), 6) TAHENRYOU-KAISEKI (Version 5.0: Esumi Inc.) was used for this examination/analysis.

Acknowledgements

This study is supported by Grant-in-Aid for Scientific Research (1952539) from the Japan Society for the

Promotion of Science. The author is grateful to Dr. Richard Hodson, an English lecturer at University of

Nagasaki, Siebold for his full support for making the LSS tests and proofreading the first & second drafts.

(21)

References

Bachman, L. F. (2004). Statistical Analyses for Language Assessment. Cambridge University Press.

Buck, G. (2001). Assessing Listening. Cambridge University Press.

Dörnyei, Z. (2007). Research Methods in Applied Linguistics. Oxford University Press.

Field, J. (2008). Listening in the Language Classroom. Cambridge University Press.

Flowerdew, J. & Miller, L. (2005). Second Language Listening: Theory and Practice. Cambridge University Press.

Hio, Y. (1983). Dictation as a Testing Device –Based on Error Analysis–. Language Laboratory, 20, 2-16.

Icho, H. (2008). Understanding the Differences between Successful and Unsuccessful Japanese High School EFL Listeners: Focusing on Explanatory Factors. ARELE, 19, 1-10.

Kawashima, H. (2009). Understanding Sub-Skills of Listening from the Perspective of Classroom Diagnostic Assessment. Conference Book: Interface between National Tests and Classroom Assessment. The 4th Annual KELTA Conference: 2009 International Conference, 102-106.

Mackey, A. & Gass, S. M. (2005). Second Language Research: Methodology and Design. Mahwah, N. J.:

Lawrence Erlbaum.

Nation, I.S.P. & Newton, J. (2009). Teaching ESL/EFL Listening and Speaking. Routledge, Taylor and Francis.

Rost, M. (2002). Teaching and Researching Listening. Longman.

Seliger, H. W. & Shohamy, E. (1989). Second Language Research Method. Oxford: Oxford University Press.

Sugawara, Y. (1999). Dictation and Listening Comprehension-Does Dictation Promote Listening Comprehension? –. Language Laboratory, 36, 33-50.

Takeno, J. & Takatsuka, S. (2007). Factors Affecting Listening Comprehension Ability of Japanese Learners of English. ARELE, 18, 1-10.

[email protected]

Table 2: Internal Consistency Reliability by Cronbach Alpha Coefficient (Restructured Test Items)
Table 3: Normal Distribution of the Restructured Data of the GLP and LSS Tests (α= .01)
Figure 1: Normal Q-Q Plot
Table 6: Multiple Comparisons by Bonferroni for the SBERC Data
+6

参照

関連したドキュメント

We have formulated and discussed our main results for scalar equations where the solutions remain of a single sign. This restriction has enabled us to achieve sharp results on

Kilbas; Conditions of the existence of a classical solution of a Cauchy type problem for the diffusion equation with the Riemann-Liouville partial derivative, Differential Equations,

Related to this, we examine the modular theory for positive projections from a von Neumann algebra onto a Jordan image of another von Neumann alge- bra, and use such projections

The study of the eigenvalue problem when the nonlinear term is placed in the equation, that is when one considers a quasilinear problem of the form −∆ p u = λ|u| p−2 u with

So far as we know, there were no results on random attractors for stochastic p-Laplacian equation with multiplicative noise on unbounded domains.. The second aim of this paper is

Key words and phrases: Optimal lower bound, infimum spectrum Schr˝odinger operator, Sobolev inequality.. 2000 Mathematics

The main problem upon which most of the geometric topology is based is that of classifying and comparing the various supplementary structures that can be imposed on a

modular proof of soundness using U-simulations.. &amp; RIMS, Kyoto U.). Equivalence