Original
Utility of Plain Chest Computed Tomography in Diagnosing Cardioembolic Stroke due to Paroxysmal
Atrial Fibrillation
Yuka Tsukahara, MD*1;Hidehiro Takekawa, MD, PhD1,2,3;Akio Iwasaki, MD, PhD1; Keisuke Suzuki, MD, PhD1;and Koichi Hirata, MD, PhD1
1 Department of Neurology, Dokkyo Medical University
2 Stroke Center, Dokkyo Medical University Hospital
3 Center of Medical Ultrasonics, Dokkyo Medical University Hospital
Background:Diagnosing cardioembolic stroke due to paroxysmal atrial fibrillation(PAF)is difficult, mainly due to low detection rate. We evaluated whether left atrial volume, which can be simply measured using non-contrast chest computed tomography(CT-LAV), can contribute to the diagnosis of cardioem- bolic stroke due to PAF(PAF-CE).
Methods:Fifty-one consecutive patients with acute ischemic stroke within 24 h of onset were included in this study. Upon admission, we measured the left atrial diameter using transthoracic echocardiography
(TTE-LAD)and CT-LAV. Patient background factors such as sex, age, and stroke risk factors were noted as well as brain natriuretic peptide(BNP)value and QTc interval were evaluated on admission. Util- ities of BNP value, CT-ALV, and TTE-LAD in PAF-CE diagnosis were compared.
Results:Patients were classified into three groups:cerebral thrombosis(CTB)group including large- artery atherosclerosis and small-vessel occlusion(n=16), cardioembolic stroke due to non-valvular atrial fibrillation(AF-CE)group(n=20), and cardioembolic stroke due to paroxysmal atrial fibrillation(PAF- CE)group(n=15). BNP value was highest in the AF-CE group(240.5 pg/mL), followed by the PAF-CE
(187.9 pg/mL)and CTB groups(35.0 pg/mL)(p<0.001). There was a significant difference in TTE-LAD among the groups(AF-CE group, 43.8 mm;PAF-CE group, 38.3 mm;CTB group, 34.1 mm)(p<0.001).
CT-LAV was higher in the AF-CE group(142 mm3)than in the PAF-CE(95.8 mm3)and CTB groups
(95.8 mm3)(p<0.001). In differentiating PAF-CE, the area under the receiver operating characteristic curve was 0.867, 0.742, and 0.845 for BNP value, TTE-LAD, and CT-LAV, respectively. A cut-off CT- LAV value of ≥ 69.6 mm3 had a high diagnostic rate(>80% of sensitivity, specificity, positive predictive value, negative predictive value, and accuracy).
Conclusion:CT-LAV can be useful in diagnosing PAF-CE. Further studies with larger sample size are required to confirm our findings and determine better cut-off value for CT-LAV.
Keywords: chest computed tomography, paroxysmal atrial fibrillation, left atrial volume, transthoracic echocardiography, cardioembolic stroke
Received November 14, 2018;accepted November 26, 2018 Reprint requests to:Yuka Tsukahara, MD
Department of Neurology, Dokkyo Medical University, 880 Kitakobayashi, Mibu, Shi- motsuga, Tochigi 321-0293, Japan.
INTRODUCTION
Cardioembolic stroke resulting from non-valvular atrial fibrillation(NVAF)(AF-CE)is known to result in poor outcomes, with many cases leading to in-hos- pital death1). There are also some cases of cerebral embolism in which the embolic source cannot be detected. These cases are described as embolic strokes of undetermined source(ESUS)2). When treat- ing ESUS, the efficacy of antithrombotic agents for secondary prevention is unclear, and aspirin is cur- rently recommended as the better choice3). However, in terms of causes of cardioembolic stroke, paroxysmal atrial fibrillation(PAF)is also known to be associated with a high primary risk for ischemic stroke4). Approximately 30% of cases of ESUS are thought to be caused by PAF5), and some patients require treat- ment with an anticoagulant agent as secondary pre- vention.
Patients who do not exhibit NVAF at the time of ischemic stroke onset require long-term electrocardi- ography(ECG)monitoring. As the PAF detection rate for 24-h observation is only 2.9% , ECG monitoring must be performed for at least 72 h1). Therefore, vari- ous tests are performed to differentiate cardioembolic stroke due to PAF6,7). Transthoracic echocardiogra- phy(TTE)can be used simply and noninvasively to measure left atrial diameter(LAD). TTE-LAD dilata- tion is a finding that is suggestive of the presence of PAF8〜10). However, there is a risk of measurement error resulting from difference in body position during testing or technical skill of the tester.
As aortic arch calcification detected via chest com- puted tomography(CT)is also known to be a risk factor for ischemic stroke11), many patients are assessed for ischemic stroke upon admission.
Therefore, we measured simple left atrial volume
(CT-LAV)with non-contrast chest CT in patients with acute ischemic stroke and investigated whether these values were useful in diagnosing cardioembolic stroke due to PAF(PAF-CE).
MATERIALS AND METHODS
We retrospectively observed a total of 238 patients, including 158 with large-artery atherosclerosis and small-vessel occlusion and 80 with cardioembolic
stroke due to NVAF or PAF who were hospitalized between April 2014 and March 2018 at the Depart- ment of Neurology, Dokkyo Medical University Hospi- tal, and whose condition developed within 24 h after admission. Ischemic stroke was classified using the Stop Stroke Study TOAST(SSS-TOAST)by Ay et al4). Definitive diagnosis of PAF-CE was defined as meeting the ESUS diagnostic criteria2)upon admission and NVAF being noted during hospitalization.
Brain natriuretic peptide( BNP)levels were observed with blood testing during admission as well as QTc interval on ECG testing. Smoking, daily alco- hol consumption, hypertension, dyslipidemia, and dia- betes mellitus were evaluated as risk factors for cere- brovascular disease. We also investigated the duration of hospitalization.
We excluded patients who did not undergo BNP or QTc interval evaluation while being hospitalized and patients who did not undergo non-contrast chest CT or TTE within 24 h after hospitalization as well as those with cryptogenic stroke and stroke of other determined etiologies including ESUS.
Evaluation of TTE-LAD and CT-LAV
TTE was performed using Vivid7(GE Healthcare Japan), Vivid E9(GE Healthcare Japan), Sonos-7500
(Philips, Japan), and iE33(Philips, Japan). We used a sector-array probe in the parasternal long-axis view to measure TTE-LAD.
In non-contrast chest CT, we used Aquilion CXL
(Canon Medical Systems, Japan), Aquilion One Vision edition(Canon Medical Systems, Japan), Sensation 40
(Siemens Healthineers, Japan), and Sensation 64(Sie- mens Healthineers, Japan)with the horizontal section- al view. Imaging conditions were mediastinal window
(window level 50, window width 400)with slice thick- ness of 0.5 mm or 0.8 mm. CT-LAV was calculated with the following formula.
CT-LAV(mm3)=longitudinal diameter(mm)×lateral diameter(mm)×number of slice×slice width(5 or 8)
/2
Statistical analysis
Subjects were divided into a cerebral thrombosis
(CTB)group(large-artery atherosclerosis and small- vessel occlusion), AF-CE group, and PAF-CE group.
We analyzed sex, risk factors, duration of hospitaliza- tion, QTc interval, BNP level, TTE-LAD, and CT- LAV differences in each group. The statistical soft- ware used was SPSS Statistics version 25(IBM). We used Pearson’s chi-square test to analyze categorical variables. When analyzing continuous variables, we used the Mann-Whitney U test for comparisons between two groups and the Kruskal-Wallis test for comparisons between three groups. A P-value <0.05 indicated a statistically significant difference.
We used the receiver operating characteristic
(ROC)curve to investigate PAF-CE diagnosis sensi- tivity and specificity, positive predictive value(PPV), negative predictive value(NPV), and accuracy. In addition, we used univariate logistic regression to cal- culate odds ratios.
Ethical standard
All procedures followed were in accordance with the ethical standards of the responsible committee on human experimentation(institutional and national)
and the 1975 Declaration of Helsinki, as revised in 2008. The institutional review board of Dokkyo Medi- cal University Hospital approved the study(IRB approved number, R-8-8). All patients provided writ- ten informed consent to participate.
RESULTS Investigation of three groups
Of the total 238 patients, 16 were classified in the
CTB group, 20 in the AF-CE group, and 15 in the PAF-CE group, and 187 patients were excluded. Male patients accounted for 68.8% of the CTB group, 40.0
% of the AF-CE group, and 80.0% of the PAC-CE group, indicating that there were fewer men in the AF-CE group(p<0.05). However, there were no dif- ferences noted for age, smoking, daily alcohol con- sumption, and duration of hospitalization, and no sig- nificant differences were observed for the prevalence of hypertension, dyslipidemia, or diabetes mellitus
(Table 1).
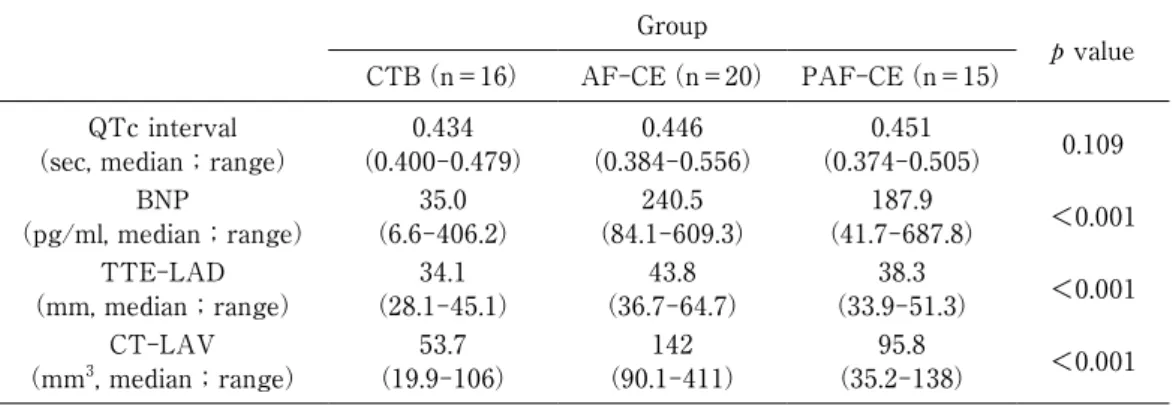
The QTc interval was 0.434 s(median)in the CTB group, 0.446 s in the AF-CE group, and 0.451 s in the PAF-CE group, indicating no significant differences(p
=0.109). The BNP level was highest in the AF-CE group, at 240.5 pg/mL(median). It was elevated in the PAF-CE group, at 187.9 pg/mL, but within the normal range in the CTB group, at 35.0 pg/mL(p<
0.001). TTE-LAD was 43.8 mm in the AF-CE group, 38.3 mm in the PAF-CE group, and 34.1 mm in the CTB group, indicating an intergroup difference(p<
0.001). CT-LAV was highest in the AF-CE group, at 142 mm3. It was 95.8 mm3 in the PAF-CE group and 53.7 mm3 in the CTB group(p<0.001)(Table 2).
Post hoc analysis
No significant differences were noted between the CTB group and the AF-CE group(p=0.474)and PAF-CE group(p=0.0860)in terms of sex(Pearson’s chi-square test). However, a difference was noted Table 1 Clinical background factors among CTB, AF-CE and PAF-CE groups
Groups
p value CTB
(n=16)
AF-CE
(n=20)
PAF-CE
(n=15)
Male(n, %) 11(68.8) 8(40.0) 12(80.0) 0.0413*
Age(years, median;range) 74(43-89) 74.5(66-92) 83(64-93) 0.224
Smoking(n, %) 2(12.5) 3(15.0) 1(6.67) 0.746*
Daily alcohol consumption(n, %) 2(12.5) 4(20.0) 3(20.0) 0.809*
Hypertension(n, %) 13(81.3) 14(70.0) 13(86.7) 0.468*
Dyslipidemia(n, %) 8(50.0) 7(35.0) 4(26.7) 0.392*
Diabetes mellitus(n, %) 3(18.8) 5(25.0) 3(20.0) 0.889* Days of hospitalization(median;range) 15(7-45) 19.5(2-50) 16(10-39) 0.231 Kruskal-Wallis Test, *Pearson’s chi-square test
CTB, cerebral thrombosis;AF, non-valvular atrial fibrillation;PAF, paroxysmal atrial fibrillation;
CE, cardioembolic stroke
between the AF-CE and PAF-CE groups(p=0.0180).
Significant differences were noted in the BNP levels between the CTB group with the AF-CE group and PAF-CE group. However, no difference was noted between the AF-CE and PAF-CE groups(p=0.298, Mann-Whitney U test). Meanwhile, significant differ- ences were noted between all groups for TTE-LAD and CT-LAV(Mann-Whitney U test)(Fig. 1 A, B, C).
Comparison of CTB group and PAF-CE group
When diagnosing PAF-CE, ROC area under the curve was 0.867 for BNP level, 0.742 for TTE-LAD, and 0.845 for CT-LAV, indicating that BNP level and CT-LAV were particularly useful(Fig. 2).
When the BNP cutoff value was set at 79.5 pg/mL or above, PAF-CE diagnosis could be made with a sensitivity of 86.7% , specificity of 81.3% , and accura- cy of 80.7% . Investigation of the diagnostic rate when Table 2 Comparison of four diagnostic markers among CTB, AF-CE and PAF-CE groups
Group
p value CTB(n=16) AF-CE(n=20) PAF-CE(n=15)
QTc interval
(sec, median;range) 0.434
(0.400-0.479) 0.446
(0.384-0.556) 0.451
(0.374-0.505) 0.109 BNP
(pg/ml, median;range) 35.0
(6.6-406.2) 240.5
(84.1-609.3) 187.9
(41.7-687.8) <0.001 TTE-LAD
(mm, median;range) 34.1
(28.1-45.1) 43.8
(36.7-64.7) 38.3
(33.9-51.3) <0.001 CT-LAV
(mm3, median;range) 53.7
(19.9-106) 142
(90.1-411) 95.8
(35.2-138) <0.001 Kruskal-Wallis Test
CTB, cerebral thrombosis;AF, non-valvular atrial fibrillation;PAF, paroxysmal atrial fibrillation;
CE, cardioembolic stroke;
BNP, brain natriuretic peptide;TTE, transthoracic echocardiography;LAD, left atrial diameter;
CT, computed tomography;LAV, left atrial volume
Figure 1 Post hoc analysis of BNP, TTE-LAD and CT-LAV A:BNP, B:TTE-LAD, C:CT-LAV
BNP value was significantly lower in CTB group, but there was no difference between PAF-CE group and AF-CE group(Mann–Whitney U test). TTE-LAD and CT-LAV values were lowest in CTB group and highest in AF-CE group(Mann–Whitney U test).
*p<0.05 **p<0.01 ***p<0.001
CTB, cerebral thrombosis;AF, non-valvular atrial fibrillation;PAF, paroxysmal atrial fibrillation;CE, cardioembolic stroke;BNP, brain natriuretic peptide;TTE, transthoracic echocardiography;LAD, left atrial diameter
CT, computed tomography;LAV, left atrial volume
BNP (pg/ml)
CTB PAF-CE AF-CE CTB PAF-CE AF-CE CTB PAF-CE AF-CE
Group Group Group
TTE-LAD (mm) CT-LAV (mm3)*
***n.s.
*** **
**
***
***
A B C
the CT-LAV cutoff value was set at 69.6 mm3 or higher indicated that sensitivity, specificity, PPV, and NPV were all 80% or higher, with a higher level of 80.6% also achieved for accuracy. However, accuracy was low, at just 61.3% when the TTE-LAD cutoff value was set at 37.2 mm or greater(Table 3).
The results of univariate logistic regression for each of these cutoff values indicated that BNP level(p=
0.00185, odds ratio 19.5, 95% confidence interval 3.01- 127)and CT-LAV(p=0.00171, odds ratio 17.3, 95%
confidence interval 2.92-103)were useful in diagnos- ing PAF-CE. However, TTE-LAD was not found to be useful(p=0.214).
DISCUSSION
We investigated whether QTc interval, BNP level, TTE-LAD, and CT-LAV differed between the CTB, AF-CE, and PAF-CE groups and found that, while BNP level was low in the CTB group, no differences were noted in the AF-CE and PAF-CE groups. We were also able to prove that TTE-LAD and CT-LAV were highest for the AF-CE group and high in the PAF-CE group, with a difference noted with the CTB group. BNP level and CT-LAV were found to be use- ful in the differential diagnosis of CTB and PAF-CE, which is important when selecting the method of sec- ondary prevention12).
Table 3 Diagnostic rate of PAF-CE using BNP, TTE-LAD and CT-LAV
Sensitivity Specificity PPV NPV Accuracy
BNP ≥ 79.5 pg/ml 86.7% 81.3% 76.5% 85.7% 80.7%
TTE-LAD ≥ 37.2 mm 60.0% 62.5% 60.0% 62.5% 61.3%
CT-LAV ≥ 69.6 mm3 80.0% 81.3% 80.0% 81.3% 80.6%
AF, non-valvular atrial fibrillation;PAF, paroxysmal atrial fibrillation;CE, cardioembolic stroke;
BNP, brain natriuretic peptide;TTE, transthoracic echocardiography;LAD, left atrial diameter;
CT, computed tomography;LAV, left atrial volume;
PPV, positive predictive value;NPV, negative predictive value
Figure 2 ROC curve of BNP, TTE-LAD and CT-LAV in diagnosis of PAF-CE
Area under the ROC curve was 0.867, 0.742 and 0.845 for BNP, TEE-LAD and CT-LAV, respectively.
CTB, cerebral thrombosis;AF, non-valvular atrial fibrillation;
PAF, paroxysmal atrial fibrillation;CE, cardioembolic stroke;BNP, brain natriuretic peptide;TTE, transthoracic echocardiography;
LAD, left atrial diameter;CT, computed tomography;LAV, left atrial volume;ROC curve, receiver operating characteristic curve.
BNP TTE-LAD CT-LAV
1-Specificity
Sen si tiv ity
Although our investigation did not reveal any differ- ences in QTc interval. QTc interval prolongation is known to be a risk factor for NVAF13〜15). Hoshino et al.7)measured QTc interval upon hospital admission in 744 ischemic stroke patients and found that PAF was likely to be detected in patients with a prolonged QTc interval. The cutoff value for this was reportedly 0.438 s. While we did not detect any statistically sig- nificant difference, we measured the QTc interval in the CTB group as being 0.434 s(median), while the QTc interval in the PAF-CE group was prolonged, at 0.451 s. Therefore, if the sample size was increased, it might be possible to show that QTc interval is useful in diagnosing PAF-CE.
As BNP level reflects remodeling of the left atrium, it is known to become elevated prior to AF onset and associated with left atrial overload16). Furthermore, in cases of ischemic stroke in the acute stage, elevated BNP level is useful for predicting PAF-CE. Fujii et al.8)consider a BNP level of 144 pg/mL or higher to be of critical importance. However, Yoshioka et al.9)
reported that a level of 90 pg/mL or higher is optimal for predicting PAF, and they have constructed PAF prediction scores using cutoff values of 50 pg/mL, 90 pg/mL, and 150 pg/mL or higher. Thus, there is no optimal cutoff value for elevated BNP level in cases of acute ischemic stroke caused by PAF. A meta-analy- sis of approximately 2,800 patients indicated that BNP levels are more elevated in cases of AF-CE and PAF- CE than in cases of CTB even 72 h after onset6). In our study, which targeted cases of ischemic stroke within 24 h after onset, BNP measurement was also performed within 2 4 h after onset. Therefore, although median BNP levels in cases of CTB were somewhat elevated, at 35.0 pg/mL, they were marked- ly elevated in cases of AF-CE(240.5 pg/mL)and PAF-CE(187.9 pg/mL). Moreover, in the differential diagnosis of CTB and PAF-CE, we found that PAF- CE could be diagnosed at a higher rate with a BNP level of 79.5 pg/mL or higher. While this BNP cutoff value is lower than that reported in previous studies, it is similar to the value reported by Yoshioka et al.9).
In cases of NVAF, structural remodeling causes left atrial enlargement, dilatation, cell death, and fibrosis on weekly basis17). However, left atrial dilatation might not only be the result of atrial remodeling relat-
ed to permanent arrhythmia. In fact, left atrial dilata- tion can arise as a result of thromboembolic cardiolog- ic factors of the fibrillation unrelated to permanent or paroxysmal arrhythmia18,19). In addition, it has been reported that TTE-LAD can also become dilatated in cases of PAF-CE, and PAF-CE diagnosis scores using TTE-LAD have been proposed8〜10). Fujii et al.8)have suggested that the cutoff value for TTE-LAD should be 38.0 mm while Yoshioka et al.9)suggested 40.0 mm.
Suissa et al.10)proposed that a TTE-LAD value larger than the normal range should be considered to be a finding suggestive of PAF-CE. The results of our investigation indicated that TTE-LAD in the CTB group was within the normal range, at 34.1 mm. How- ever, the result was 43.8 mm for the AF-CE group and 38.3 mm for the PAF-CE group. When differenti- ating CTB and PAF-CE, TTE-LAD of 37.2 mm or larger is considered to be a finding suggestive of PAF-CE, and it is similar to the figure reported by Fujii et al. 8). However, accuracy was not overly high, at just 61.3% . Some patients with ischemic stroke cannot maintain a set position during testing, while others cannot follow the directions of the tester. Mea- surement errors may also arise as a result of the tes- ter’s level of skill. These factors may have been the reason why it was unable to achieve a high TTE- LAD diagnostic rate.
CT-LAV was 53.7 mm3 in the CTB group, 142 mm3 in the AF-CE group, and 95.8 mm3 in the PAF-CE group. Like TTE-LAD, it was high in patients with NVAF and PAF. These results suggest that patients in whom it is difficult to measure TTE-LAD, CT- LAV could be useful in diagnosing PAF-CE. We also demonstrated that at 69.3 mm3 or higher, PAF-CE could be diagnosed with a high accuracy of 80.6% , which is almost the same diagnostic rate as that for BNP. To calculate more accurately CT-LAV with chest CT imaging, respiration and heart rate need to be synchronized. However, as no reports have attempted to perform PAF-CE diagnosis using normal chest CT, which is used to diagnose conditions such as aortic arch calcification and pneumonia, we believe that the fact that we were able to obtain findings sug- gestive of PAF-CE with CT-LAV could be very use- ful in clinical settings.
Patients determined to have PAF while hospitalized
were diagnosed as PAF-CE in this study. However, the possibility that some patients exhibited PAF after being discharged cannot be ruled out. Moreover, in cases of insular infarctions, imbalance of sympathetic and parasympathetic activities can cause NVAF to develop20). Therefore, limitations of this study include the possibility that patients with PAF were included in the CTB group, possibility that cases of NVAF due to ischemic stroke were included in the AF-CE group and PAF-CE group, and small sample size.
CONCLUSIONS
Like BNP level, CT-LAV might be useful in diag- nosing PAF-CE. Furthermore, appropriate cutoff val- ues need to be determined based on further investiga- tion on a larger sample size.
Conflicts of interest
There are no financial or other relations that could lead to a conflict of interest.
Acknowledgements.We thank Dr. Ayano Suzuki and Dr. Takahito Nishihira, Department of Neurology, Dokkyo Medical University, for the productive discus- sion and valuable comments on this manuscript.
REFERENCES
1) Toyoda K, Okumura K, Hashimoto Y, et al:Identifi- cation of Covert Atrial Fibrillation in Cryptogenic Ischemic Stroke:Current Clinical Practice in Japan.
J Stroke Cerebrovasc Dis 25:1829-1837, 2016.
2) Hart RG, Diener HC, Coutts SB, et al:Embolic strokes of undetermined source:the case for a new clinical construct. Lancet Neurol 13:429-438, 2014.
3) Hart RG, Sharma M, Mundl H, et al:Rivaroxaban for Stroke Prevention after Embolic Stroke of Undeter- mined Source. N Engl J Med 378:2191-2201, 2018.
4) Ay H, Furie KL, Singhal A, et al:An evidence- based causative classification system for acute isch- emic stroke. Ann Neurol 58:688-697, 2005.
5) Ntaios G, Papavasileiou V, Milionis H, et al:Embolic strokes of undetermined source in the Athens stroke registry:a descriptive analysis. Stroke 46:176-181, 2015.
6) Llombart V, Antolin-Fontes A, Bustamante A, et al:
B-type natriuretic peptides help in cardioembolic
stroke diagnosis:pooled data meta-analysis. Stroke 46:1187-1195, 2015.
7) Hoshino T, Nagao T, Shiga T, et al:Prolonged QTc interval predicts poststroke paroxysmal atrial fibrilla- tion. Stroke 46:71-76, 2015.
8) Fujii S, Shibazaki K, Kimura K, et al:A simple score for predicting paroxysmal atrial fibrillation in acute ischemic stroke. J Neurol Sci 328:83-86, 2013.
9) Yoshioka K, Watanabe K, Zeniya S, et al:A Score for Predicting Paroxysmal Atrial Fibrillation in Acute Stroke Patients:iPAB Score. J Stroke Cerebrovasc Dis 24:2263-2269, 2015.
10) Suissa L, Mahagne MH, Lachaud S:Score for the targeting of atrial fibrillation:a new approach to diagnosing paroxysmal atrial fibrillation. Cerebrovasc Dis 31:442-447, 2011.
11) Itani Y, Watanabe S, Masuda Y:Relationship between aortic calcification and stroke in a mass screening program using a mobile helical computed tomography unit. Circ J 70:733-736, 2006.
12) Kernan WN, Ovbiagele B, Black HR, et al:Guidelines for the prevention of stroke in patients with stroke and transient ischemic attack:a guideline for health- care professionals from the American Heart Associa- tion/American Stroke Association. Stroke 45:2160- 2236, 2014.
13) Nielsen JB, Graff C, Pietersen A, et al:J-shaped association between QTc interval duration and the risk of atrial fibrillation:results from the Copenha- gen ECG study. J Am Coll Cardiol 61:2557-2564, 2013.
14) Mandyam MC, Soliman EZ, Alonso A, et al:The QT interval and risk of incident atrial fibrillation. Heart Rhythm 10:1562-1568, 2013.
15) Perez MV, Dewey FE, Marcus R, et al:Electrocar- diographic predictors of atrial fibrillation. Am Heart J 158:622-628, 2009.
16) Inoue S, Murakami Y, Sano K, et al:Atrium as a source of brain natriuretic polypeptide in patients with atrial fibrillation. J Card Fail 6:92-96, 2000.
17) Corradi D, Callegari S, Maestri R, et al:Structural remodeling in atrial fibrillation. Nat Clin Pract Cardio- vasc Med 5:782-796, 2008.
18) Vaziri SM, Larson MG, Benjamin EJ, et al:Echocar- diographic predictors of nonrheumatic atrial fibrilla- tion. The Framingham Heart Study. Circulation 89:
724-730, 1994.
19) Hughes M, Lip GY, et al:Stroke and thromboembo- lism in atrial fibrillation:a systematic review of stroke risk factors, risk stratification schema and cost effectiveness data. Thromb Haemost 99:295-304,
2008.
20) Sposato LA, Riccio PM, Hachinski V:Poststroke atri- al fibrillation:cause or consequence? Critical review of current views. Neurology 82:1180-1186, 2014.