統計表
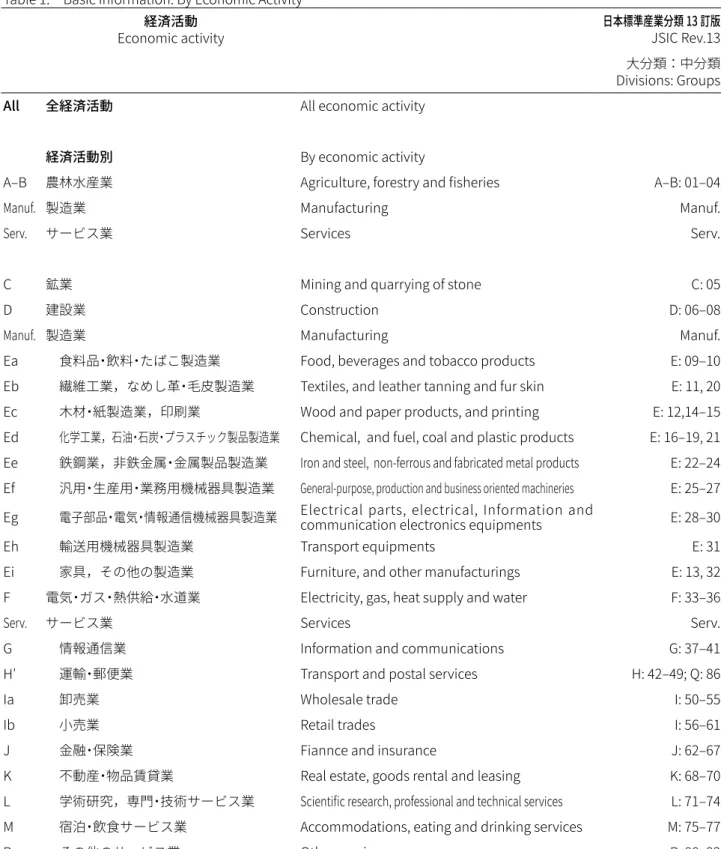
表 1. 基本的情報:経済活動別
Table 1. Basic Information: By Economic Activity
Economic activity
経済活動 日本標準産業分類 13 訂版JSIC Rev.13 大分類:中分類 Divisions: Groups
All 全経済活動All economic activity
経済活動別
By economic activity
A–B 農林水産業 Agriculture, forestry and fisheries A–B: 01 –04
Manuf. 製造業 Manufacturing Manuf.
Serv. サービス業 Services Serv.
C 鉱業 Mining and quarrying of stone C: 05
D 建設業 Construction D: 06 –08
Manuf. 製造業 Manufacturing Manuf.
Ea 食料品・飲料・たばこ製造業 Food, beverages and tobacco products E: 09–10 Eb 繊維工業,なめし革・毛皮製造業 Textiles, and leather tanning and fur skin E: 11, 20 Ec 木材・紙製造業,印刷業 Wood and paper products, and printing E: 12,14–15 Ed 化学工業,石油・石炭・プラスチック製品製造業 Chemical, and fuel, coal and plastic products E: 16–19, 21 Ee 鉄鋼業,非鉄金属・金属製品製造業 Iron and steel, non-ferrous and fabricated metal products E: 22–24 Ef 汎用・生産用・業務用機械器具製造業 General-purpose, production and business oriented machineries E: 25–27 Eg 電子部品・電気・情報通信機械器具製造業 Electrical parts, electrical, Information and
communication electronics equipments E: 28–30
Eh 輸送用機械器具製造業 Transport equipments E: 31
Ei 家具,その他の製造業 Furniture, and other manufacturings E: 13, 32
F 電気・ガス・熱供給・水道業 Electricity, gas, heat supply and water F: 33–36
Serv. サービス業 Services Serv.
G 情報通信業 Information and communications G: 37–41
H′ 運輸・郵便業 Transport and postal services H: 42–49; Q: 86
Ia 卸売業 Wholesale trade I: 50–55
Ib 小売業 Retail trades I: 56–61
J 金融・保険業 Fiannce and insurance J: 62–67
K 不動産・物品賃貸業 Real estate, goods rental and leasing K: 68–70
L 学術研究,専門・技術サービス業 Scientific research, professional and technical services L: 71–74 M 宿泊・飲食サービス業 Accommodations, eating and drinking services M: 75–77
R その他のサービス業 Other services R: 88–92
出所 : 第 4 回全国イノベーション調査(科学技術・学術政策研究所).
Source: Japanese National Innovation Survey 2015 (J-NIS 2015), National Institute of Science and Technology Policy (NISTEP).
註 : 日本標準産業分類は 13 訂版(2013 年 10 月改定).
Note: Japan Standard Industrial Classification (JSIC), Rev.13 (October 2013).
表 1. 基本的情報:経済活動別(つづき)
Table 1. Basic Information: By Economic Activity (cont.)
Economic activity
経済活動 母集団企業数Population
有効回答企業数Response
Enterprise 社 社
Enterprise
All 全経済活動
380,224 12,526
経済活動別
A–B 農林水産業 3,791 478
Manuf. 製造業 100,454 5,186
Serv. サービス業 219,442 5,933
C 鉱業 418 96
D 建設業 55,710 562
Manuf. 製造業
Ea 食料品・飲料・たばこ製造業 15,216 437
Eb 繊維工業,なめし革・毛皮製造業 7,177 568
Ec 木材・紙製造業,印刷業 10,782 530
Ed 化学工業,石油・石炭・プラスチック製品製造業 15,949 1,120
Ee 鉄鋼業,非鉄金属・金属製品製造業 15,457 554
Ef 汎用・生産用・業務用機械器具製造業 15,289 693
Eg 電子部品・電気・情報通信機械器具製造業 9,591 623
Eh 輸送用機械器具製造業 5,876 290
Ei 家具,その他の製造業 5,117 371
F 電気・ガス・熱供給・水道業 409 271
Serv. サービス業
G 情報通信業 12,990 864
H′ 運輸・郵便業 31,090 993
Ia 卸売業 39,109 1,099
Ib 小売業 53,920 546
J 金融・保険業 2,262 570
K 不動産・物品賃貸業 8,687 406
L 学術研究,専門・技術サービス業 11,439 668
M 宿泊・飲食サービス業 32,320 403
R その他のサービス業 27,625 384
出所 : 第 4 回全国イノベーション調査(科学技術・学術政策研究所).
Source: Japanese National Innovation Survey 2015 (J-NIS 2015), National Institute of Science and Technology Policy (NISTEP).
註 : 日本標準産業分類は 13 訂版(2013 年 10 月改定).
Note: Japan Standard Industrial Classification (JSIC), Rev.13 (October 2013).
表 2. 総売上高及び企業新規プロダクト・イノベーション売上高,2014 年:経済活動別
Table 2. Total Turnover and Turnover from New-to-Firm Product Innovation (NTFInno), 2014: By Economic Activity
Economic activity
経済活動 総売上高Total turnover
企業新規プロダクト・イノベーション売上高
Turnover from New-to-Firm Product Innovation (NTFInno)
プロダクト・イノベーション市場新規Turnover from
売上高New-to-Market Product Innovation (NTMInno)
企業にとってのみ新しい プロダクト・イノベーション による売上高
Turnover from Only New-to-Firm Product Innovation
Total
合計Billion yen 十億円 十億円
Billion yen 十億円
Billion yen 十億円 Billion yen
All 全経済活動
1,342,473 42,451 62,332 104,783
経済活動別
A–B 農林水産業 3,458 26 37 63
Manuf. 製造業 337,500 15,581 32,733 48,315
Serv. サービス業 882,578 25,598 23,281 48,878
C 鉱業 365 1 9 10
D 建設業 99,916 1,244 6,269 7,513
Manuf. 製造業
Ea 食料品・飲料・たばこ製造業 26,249 234 2,507 2,741
Eb 繊維工業,なめし革・毛皮製造業 6,574 109 103 212
Ec 木材・紙製造業,印刷業 32,328 290 130 420
Ed 化学工業,石油・石炭・プラスチック製品製造業 74,083 1,355 2,498 3,853
Ee 鉄鋼業,非鉄金属・金属製品製造業 24,761 233 557 789
Ef 汎用・生産用・業務用機械器具製造業 59,953 11,226 3,220 14,446
Eg 電子部品・電気・情報通信機械器具製造業 44,411 1,361 4,910 6,271
Eh 輸送用機械器具製造業 60,185 710 18,729 19,438
Ei 家具,その他の製造業 8,955 64 81 145
F 電気・ガス・熱供給・水道業 18,656 1 3 4
Serv. サービス業
G 情報通信業 84,216 6,511 8,545 15,055
H′ 運輸・郵便業 54,805 5,176 210 5,386
Ia 卸売業 424,221 2,690 5,182 7,873
Ib 小売業 132,430 4,194 5,368 9,563
J 金融・保険業 71,566 620 292 912
K 不動産・物品賃貸業 32,482 130 880 1,010
L 学術研究,専門・技術サービス業 45,809 5,981 110 6,091
M 宿泊・飲食サービス業 19,086 213 2,124 2,337
R その他のサービス業 17,962 82 569 652
出所 : 第 4 回全国イノベーション調査(科学技術・学術政策研究所).
Source: Japanese National Innovation Survey 2015 (J-NIS 2015), National Institute of Science and Technology Policy (NISTEP).
註 : 売上高は 2014 年の値である.
Note: Turnover is for the year 2014.
表 3. 企業新規プロダクト・イノベーション売上率,2014 年:経済活動別
Table 3. Rate of Gross National Turnover from New-to-Firm Product Innovation (NTFInno rate), 2014: By Economic Activity
Economic activity
経済活動企業新規プロダクト・イノベーション売上率
Rate of Turnover from New-to-Firm Product Innovation (NTFInno rate)
プロダクト・イノベーション市場新規Rate of Turnover from
売上率New-to-Market Product Innovation (NTMInno rate)
企業にとってのみ新しい プロダクト・イノベーション による売上率
Rate of Turnover from Only New-to-Firm Product Innovation
Total
合計% % %
All 全経済活動
3 5 8
経済活動別
A–B 農林水産業 1 1 2
Manuf. 製造業 5 10 14
Serv. サービス業 3 3 6
C 鉱業 0 3 3
D 建設業 1 6 8
Manuf. 製造業
Ea 食料品・飲料・たばこ製造業 1 10 10
Eb 繊維工業,なめし革・毛皮製造業 2 2 3
Ec 木材・紙製造業,印刷業 1 0 1
Ed 化学工業,石油・石炭・プラスチック製品製造業 2 3 5
Ee 鉄鋼業,非鉄金属・金属製品製造業 1 2 3
Ef 汎用・生産用・業務用機械器具製造業 19 5 24
Eg 電子部品・電気・情報通信機械器具製造業 3 11 14
Eh 輸送用機械器具製造業 1 31 32
Ei 家具,その他の製造業 1 1 2
F 電気・ガス・熱供給・水道業 0 0 0
Serv. サービス業
G 情報通信業 8 10 18
H′ 運輸・郵便業 9 0 10
Ia 卸売業 1 1 2
Ib 小売業 3 4 7
J 金融・保険業 1 0 1
K 不動産・物品賃貸業 0 3 3
L 学術研究,専門・技術サービス業 13 0 13
M 宿泊・飲食サービス業 1 11 12
R その他のサービス業 0 3 4
出所 : 第 4 回全国イノベーション調査(科学技術・学術政策研究所).
Source: Japanese National Innovation Survey 2015 (J-NIS 2015), National Institute of Science and Technology Policy (NISTEP).
註 : 数値は総売上高に占める割合を表す.「0」は単位未満の値であることを示す.
Note: Figures are the ratios to total turnover.
“
0”
indicates less than half of the given unit.表 4. 国際比較,基本的情報,2014 年:中核産業
Table 4. International Comparison, Basic Information, 2014: Core Industries
Country
国 購買力平価PPP
母集団企業数Population 価格水準指数
Price level indices 社 Enterprise
JPN 日本* 100 217,669
USA 米国
†103 437,444
EU and EFTA EU 及び EFTA 加盟国‡
808,726
ISL アイスランド 122 826
IRL アイルランド 112 6,736
ITA イタリア 101 111,892
EST エストニア 72 3,639
AUT オーストリア 109 16,645
NLD オランダ 110 25,239
CYP キプロス 93 1,602
GRC ギリシャ 83 13,843
HRV クロアチア 63 6,918
CHE スイス 144 23,454
SWE スウェーデン 131 17,808
ESP スペイン 90 64,463
SVK スロヴァキア 66 7,647
SVN スロヴェニア 81 4,157
CZE チェコ 63 21,559
DNK デンマーク 134 7,769
DEU ドイツ 105 135,984
NOR ノルウェー 152 9,115
HUN ハンガリー 57 14,720
FIN フィンランド 124 8,576
FRA フランス 110 70,355
BGR ブルガリア 46 14,255
BEL ベルギー 109 13,543
POL ポーランド 58 58,776
PRT ポルトガル 79 18,601
MLT マルタ 80 890
LVA ラトビア 68 5,003
LTU リトアニア 60 7,613
ROU ルーマニア 50 28,380
LUX ルクセンブルク 121 1,751
GBR 連合王国(イギリス) 118 86,967
出所 : 第 4 回全国イノベーション調査(科学技術・学術政策研究所),Eurostat Database (http://ec.europa.eu/eurostat/data/database),OECD Statis- tics (https://stats.oecd.org/), Business Research and Development and Innovation 2014 (NCSES, NSF) (https://www.nsf.gov/statistics/).
Source: Japanese National Innovation Survey 2015 (J-NIS 2015), National Institute of Science and Technology Policy (NISTEP). The rest is omitted.
註*: 母集団は中核産業に含まれる常用雇用者 10 人以上の企業である.中核産業については,附録を参照のこと.
Note*: The population consists of firms with 10 or more regular persons employed in the core industries. See Annex regarding the definition of the core industries.
註†: 母集団は中核産業に含まれる従業者 5 人以上の企業である.経済活動の詳細については,附録を参照のこと.
Note: The population consists of firms with 5 or more persons employed in the core industries. See Annex for more details of economic activites.
註‡: EU 及び EFTA 加盟国にはリヒテンシュタインが含まれていない.母集団は概ね各国とも中核産業に含まれる従業者 10 人以上の企業である.
Note: The “EU and EFTA” countries in this table does not include Lichtenstein (LIE). In general, the population consists of firms with 10 or more persons employed in the core industries in each country.
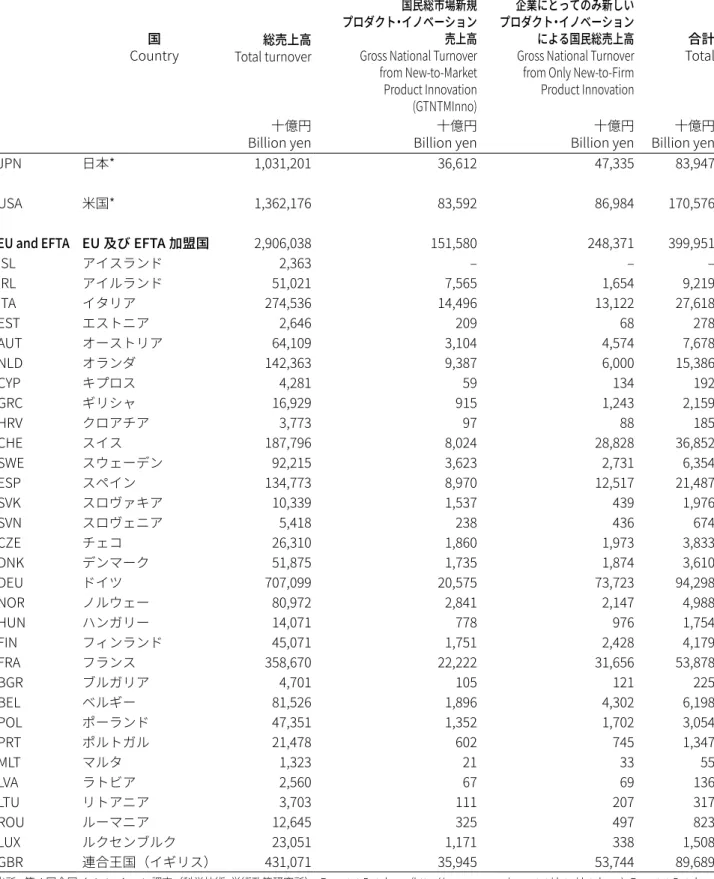
表 5. 国際比較,総売上高及び国民総企業新規プロダクト・イノベーション売上高,2014 年:中核産業
Table 5. International Comparison, Total Turnover and Gross National Turnover from New-to-Firm Product Innovation (GTNTFInno), 2014: Core Industries
Country
国 総売上高Total turnover
国民総企業新規プロダクト・イノベーション売上高 (GTNTFInno)
Gross National Turnover from New-to-Firm Product Innovation (GTNTFInno)
国民総市場新規 プロダクト・イノベーション
Gross National Turnover
売上高from New-to-Market Product Innovation (GTNTMInno)
企業にとってのみ新しい プロダクト・イノベーション による国民総売上高
Gross National Turnover
from Only New-to-Firm Product Innovation
Total
合計Billion yen 十億円 十億円
Billion yen 十億円
Billion yen 十億円 Billion yen
JPN 日本* 1,031,201 36,612 47,335 83,947
USA 米国* 1,362,176 83,592 86,984 170,576
EU and EFTA EU 及び EFTA 加盟国
2,906,038 151,580 248,371 399,951
ISL アイスランド 2,363 – – –
IRL アイルランド 51,021 7,565 1,654 9,219
ITA イタリア 274,536 14,496 13,122 27,618
EST エストニア 2,646 209 68 278
AUT オーストリア 64,109 3,104 4,574 7,678
NLD オランダ 142,363 9,387 6,000 15,386
CYP キプロス 4,281 59 134 192
GRC ギリシャ 16,929 915 1,243 2,159
HRV クロアチア 3,773 97 88 185
CHE スイス 187,796 8,024 28,828 36,852
SWE スウェーデン 92,215 3,623 2,731 6,354
ESP スペイン 134,773 8,970 12,517 21,487
SVK スロヴァキア 10,339 1,537 439 1,976
SVN スロヴェニア 5,418 238 436 674
CZE チェコ 26,310 1,860 1,973 3,833
DNK デンマーク 51,875 1,735 1,874 3,610
DEU ドイツ 707,099 20,575 73,723 94,298
NOR ノルウェー 80,972 2,841 2,147 4,988
HUN ハンガリー 14,071 778 976 1,754
FIN フィンランド 45,071 1,751 2,428 4,179
FRA フランス 358,670 22,222 31,656 53,878
BGR ブルガリア 4,701 105 121 225
BEL ベルギー 81,526 1,896 4,302 6,198
POL ポーランド 47,351 1,352 1,702 3,054
PRT ポルトガル 21,478 602 745 1,347
MLT マルタ 1,323 21 33 55
LVA ラトビア 2,560 67 69 136
LTU リトアニア 3,703 111 207 317
ROU ルーマニア 12,645 325 497 823
LUX ルクセンブルク 23,051 1,171 338 1,508
GBR 連合王国(イギリス) 431,071 35,945 53,744 89,689
出所 : 第 4 回全国イノベーション調査(科学技術・学術政策研究所),Eurostat Database (http://ec.europa.eu/eurostat/data/database), Eurostat Database (http://ec.europa.eu/eurostat/data/database), Business Research and Development and Innovation 2014 (NCSES, NSF) (https://www.nsf.gov/statistics/).
Source: Japanese National Innovation Survey 2015 (J-NIS 2015), National Institute of Science and Technology Policy (NISTEP). The rest is omitted.
註: 売上高は購買力平価を反映した値である.「–」は該当する値がないことを示す.
Note: Turnover adjusted for Purchasing Power Parity (PPP).
“
–”
indicates that figures not applicable. The“
EU and EFTA”
countries in this table does not include Lichtenstein (LIE).註*: 日本及び米国については,EU 及びEFTA 加盟国との比較が可能なように,経済活動が中核産業に限定されている.詳細は附録を参照のこと.
Note*: Economic activities for Japan and USA are confined to core industries for the comparison with the EU and EFTA countires. See Annex for more
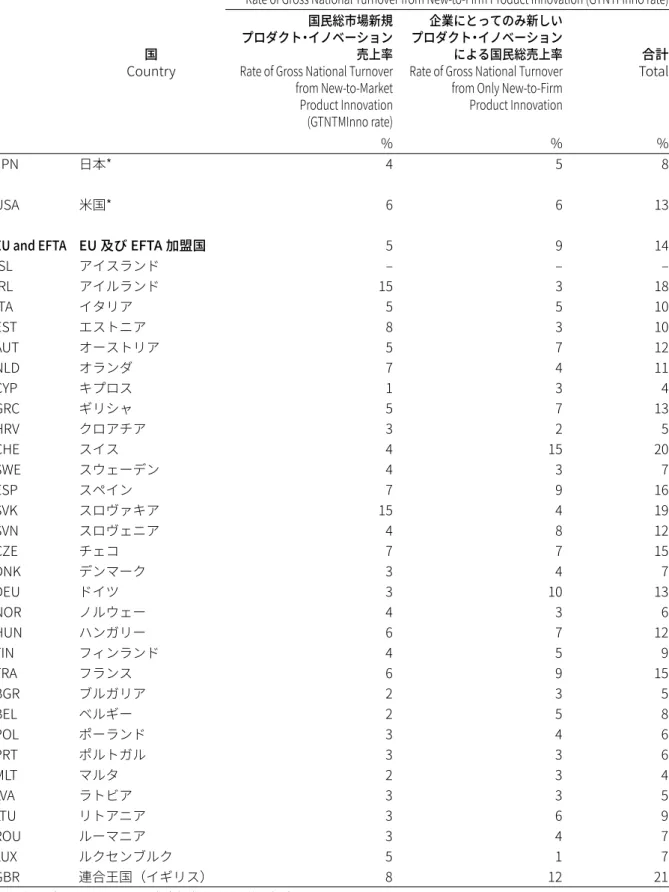
表 6. 国際比較,国民総企業新規プロダクト・イノベーション売上率,2014 年:中核産業
Table 6. International Comparison, Rate of Gross National Turnover from New-to-Firm Product Innovation (GTNTFInno rate), 2014: Core Industries
国民総企業新規プロダクト・イノベーション売上率Rate of Gross National Turnover from New-to-Firm Product Innovation (GTNTFInno rate) Country
国国民総市場新規 プロダクト・イノベーション
Rate of Gross National Turnover
売上率from New-to-Market Product Innovation (GTNTMInno rate)
企業にとってのみ新しい プロダクト・イノベーション による国民総売上率
Rate of Gross National Turnover from Only New-to-Firm Product Innovation
Total
合計% % %
JPN 日本* 4 5 8
USA 米国* 6 6 13
EU and EFTA EU 及び EFTA 加盟国
5 9 14
ISL アイスランド – – –
IRL アイルランド 15 3 18
ITA イタリア 5 5 10
EST エストニア 8 3 10
AUT オーストリア 5 7 12
NLD オランダ 7 4 11
CYP キプロス 1 3 4
GRC ギリシャ 5 7 13
HRV クロアチア 3 2 5
CHE スイス 4 15 20
SWE スウェーデン 4 3 7
ESP スペイン 7 9 16
SVK スロヴァキア 15 4 19
SVN スロヴェニア 4 8 12
CZE チェコ 7 7 15
DNK デンマーク 3 4 7
DEU ドイツ 3 10 13
NOR ノルウェー 4 3 6
HUN ハンガリー 6 7 12
FIN フィンランド 4 5 9
FRA フランス 6 9 15
BGR ブルガリア 2 3 5
BEL ベルギー 2 5 8
POL ポーランド 3 4 6
PRT ポルトガル 3 3 6
MLT マルタ 2 3 4
LVA ラトビア 3 3 5
LTU リトアニア 3 6 9
ROU ルーマニア 3 4 7
LUX ルクセンブルク 5 1 7
GBR 連合王国(イギリス) 8 12 21
出所 : 第 4 回全国イノベーション調査(科学技術・学術政策研究所),Eurostat Database (http://ec.europa.eu/eurostat/data/database), Eurostat Database (http://
ec.europa.eu/eurostat/data/database), Business Research and Development and Innovation 2014 (NCSES, NSF) (https://www.nsf.gov/statistics/).
Source: Japanese National Innovation Survey 2015 (J-NIS 2015), National Institute of Science and Technology Policy (NISTEP). The rest is omitted.
註 : 数値は総売上高に占める割合を表す.「–」は該当する値がないことを示す.EU 及び EFTA 加盟国にはリヒテンシュタインが含まれていない.
Note: Figures are ratios to total turnover. “–” indicates that figures not applicable. The “EU and EFTA” countries in this table does not include Lichtenstein (LIE).
註*: 日本及び米国については,EU 及びEFTA 加盟国との比較が可能なように,経済活動が中核産業に限定されている.詳細は附録を参照のこと.
Note*: Economic activities for Japan and USA are confined to core industries for the comparison with the EU and EFTA countires. See Annex for more details about this.
表 7. 経済センサスとの対照 : 母集団企業数及び総売上高
Table 7. Comparison with the Economic Census: Population and Total Turnover
母集団企業数Population
総売上高Total turnover Economic activity
経済活動第 4 回 全国イノベーション調査
Japanese National Innovation Survey 2015
平成 28 年 経済センサス – 活動調査
Economic Census for Business Activity 2016
第 4 回 全国イノベーション調査
Japanese National Innovation Survey 2015
平成 28 年 経済センサス – 活動調査
Economic Census for Business Activity 2016 2013 年 10 月時点
As of October 2013 2016 年 6 月時点
As of June 2016 2014 年
2014 2015 年
2015
Enterprise 社 社
Enterprise 十億円
Billion Yen 十億円 Billion Yen
All 全経済活動380,224 403,462 1,342,473 1,300,130
経済活動別
A–B 農林水産業 3,791 5,906 3,458 3,616
C 鉱業 418 395 365 1,712
D 建設業 55,710 54,325 99,916 85,490
Manuf. 製造業 100,454 93,932 337,500 382,912
F 電気・ガス・熱供給・水道業 409 474 18,656 25,321
G 情報通信業 12,990 12,324 84,216 58,287
H′ 運輸・郵便業 31,090 29,842 54,805 59,001
Ia 卸売業 39,109 39,966 424,221 314,490
Ib 小売業 53,920 71,328 132,430 135,458
J 金融・保険業 2,262 3,491 71,566 111,617
K 不動産・物品賃貸業 8,687 9,072 32,482 36,472
L 学術研究,専門・技術サービス業 11,439 16,015 45,809 34,780
M 宿泊・飲食サービス業 32,320 38,058 19,086 20,251
R その他のサービス業 27,625 28,334 17,962 30,723
出所 : 第 4 回全国イノベーション調査(科学技術・学術政策研究所),平成 28 年経済センサス – 活動調査.
Source: Japanese National Innovation Survey 2015 (J-NIS 2015), National Institute of Science and Technology Policy (NISTEP), Economic Census for Business Activity 2016.
註 : 総売上高はいずれも推計値である.
Note: Total turover is a population–estimated value.
附表 1. もっとも重要なプロダクトの平均的な寿命,1999 年 –2001 年:全企業に対する割合
Annex Table 1. Average Lifetime of Most Important Product, 1999–2001 : All Firms
Economic activity
経済活動 平均値Average
累積値 (%)
Cumulative value (%)
1 年未満Less than 1 year
1 年以上 3 年以下
1 –3 years
4 年以上 6 年以下
4–6 years
7 年以上 9 年以下
7–9 years
10 年以上10 years and more
Year 年 % % % % %
全経済活動
7.09 12 36 55 61 100
経済活動別
農林水産業 6.94 13 44 54 59 100
製造業 7.22 12 34 54 60 100
サービス業 6.92 12 37 56 63 100
鉱業 8.71 14 28 37 39 100
製造業
食料品・飲料・たばこ・飼料製造業 6.77 20 43 56 59 100
繊維工業 6.65 14 43 58 63 100
衣服・その他の繊維製品製造業 5.04 27 56 73 76 100
なめし革・同製品・毛皮製造業 4.53 35 64 76 77 100
木材・木製品製造業(家具を除く) 7.47 15 34 52 54 100
パルプ・紙・紙加工品製造業 7.98 13 29 45 51 100
出版・印刷・同関連業 6.79 10 36 60 66 100
石油製品・石炭製品製造業 9.21 5 15 35 43 100
化学工業 8.60 3 20 41 50 100
プラスチック製品製造業 6.71 10 36 60 68 100
ゴム製品製造業 7.34 9 29 54 62 100
窯業・土石製品製造業 8.72 9 26 39 42 100
鉄鋼業 9.38 9 18 30 38 100
非鉄金属製造業 8.42 8 22 41 51 100
金属製品製造業 8.42 7 26 43 47 100
一般機械器具等製造業 8.05 8 24 46 55 100
電子計算機・同附属装置製造業 4.66 12 56 77 90 100
電気機械器具製造業 6.52 8 38 63 70 100
通信機械器具・同関連機械器具製造業 6.12 9 40 65 76 100
精密機械器具製造業 6.61 8 35 61 71 100
自動車・同附属品製造業 6.62 8 30 64 73 100
輸送用機械器具製造業 8.68 6 16 42 49 100
家具・装備品製造業 7.76 10 29 49 56 100
その他の製造業 6.16 12 45 65 70 100
電気・ガス・熱供給・水道業 10.51 8 13 19 22 100
電気業 11.40 0 9 12 12 100
ガス業 10.59 11 13 18 20 100
熱供給業 11.43 5 10 10 10 100
水道業 9.52 8 16 28 38 100
附表 1. もっとも重要なプロダクトの平均的な寿命,1999 年 –2001 年:全企業に対する割合(つづき)
Annex Table 1. Average Lifetime of Most Important Product, 1999–2001 : All Firms (cont.)
Economic activity
経済活動 平均値Average
累積値 (%)
Cumulative value (%)
1 年未満Less than 1 year
1 年以上 3 年以下
1 –3 years
4 年以上 6 年以下
4–6 years
7 年以上 9 年以下
7–9 years
10 年以上10 years and more
Year 年 % % % % %
サービス業
卸売業 6.96 13 39 55 61 100
各種商品卸売業 6.16 13 41 62 75 100
繊維・衣服等卸売業 3.85 35 70 84 84 100
飲食料品卸売業 7.00 20 38 52 60 100
建築材料,鉱物・金属材料等卸売業 8.52 10 26 40 45 100
機械器具等卸売業 6.46 2 41 65 71 100
その他の卸売業 7.23 12 36 53 59 100
運輸・倉庫・通信業 7.31 12 33 51 61 100
鉄道業 9.48 11 22 29 32 100
道路旅客運送業 7.79 12 29 46 55 100
道路貨物運送業 7.22 12 32 52 64 100
水運業 10.48 5 15 19 23 100
航空運輸業 8.68 8 23 41 44 100
倉庫業 8.10 10 28 46 50 100
運輸・附帯サービス業 6.79 14 42 59 60 100
郵便・電気通信業 4.32 26 59 82 86 100
金融仲介業 7.93 9 28 49 51 100
銀行・信託業 7.69 7 38 50 50 100
証券業,商品先物取引業 7.19 17 39 53 55 100
保険業 6.90 12 34 61 62 100
非預金信用貸金業,投資業 9.05 4 15 39 43 100
補助的金融業,金融附帯業 10.95 4 10 15 18 100
コンピュータ関連サービス業 5.44 5 44 76 84 100
電子計算機・同関連機器・事務用機械器具賃貸業 5.80 13 35 70 83 100
ソフトウェア業 4.96 6 49 80 89 100
情報処理・提供サービス業 7.02 3 26 64 68 100
研究開発業 7.59 7 28 52 59 100
土木建築サービス業 6.14 18 38 64 73 100
出所:全国イノベーション調査(科学技術政策研究所).
Source: Japanese National Innovation Survey 2003 (J-NIS 2003), National Institute of Science and Techonology Policy (NISTEP).
註:平均値については,「1 年未満」,「1 年以上未満」,「4 年以上未満」,「7 年以上 9 年未満」,「10 年以上」の各区分において,区分の 中央値と考えられる「0.5 年」,「2.5 年」,「5.5 年」,「8.5 年」,それから「12.5 年」であると仮定して算出している.また,青塗りは累 積値が 50% 未満であることを示す.
Note: The averages in this table are calculated on the assumption that the averages in divisions “less than 1 year” , “1–3 years” , “4–6 years” , and “7–9 year” would be “0.5 year” , “2.5 year” , “5.5 year” , and “8.5 year” , i.e. the median of each division, respectively, and that the average in division “10 years or more” would be “12.5 year” . Blue–colored cell indicates that a cumlative value is less than 50%.