Kyushu University Institutional Repository
Study on Modeling of Seismic Wave and Gas Permeability Characteristics through Porous Layers in Goaf
杨, 晓晨
http://hdl.handle.net/2324/1959124
出版情報:九州大学, 2018, 博士(工学), 課程博士 バージョン:
権利関係:
Study on Modeling of Seismic Wave and Gas Permeability Characteristics through Porous Layers in Goaf
YANG XIAOCHEN
JULY 2018
Study on Modeling of Seismic Wave and Gas Permeability Characteristics through Porous Layers in Goaf
A DOCTORAL DISSERTATION
SUBMITTED TO THE GRADUATE SCHOOL OF ENGINEERING KYUSHU UNIVERSITY
AS A PARTIAL FULFILLMENT OF THE REQUIREMENTS FOR THE DEGREE OF
DOCTOR OF ENGINEERING
BY
YANG XIAOCHEN
SUPERVISED BY PROF. KYURO SASAKI
DEPARTMENT OF EARTH RESOURCES ENGINEERING KYUSHU UNIVERSITY
FUKUOKA, JAPAN JULY, 2018
I
CERTIFICATE
I certify that I have read this dissertation and that , in my opinion, it is fully adequate in scope and quality as a dissertation for the degree of Doctor of Engineering.
Prof. Kyuro Sasaki (Principal Supervisor)
Prof. Hemanta Hazarika (Examining Committee)
Prof. Zhang (Examining Committee)
Prof. Yuichi Sugai (Examining Committee)
Graduate School of Engineering, Kyushu University
July, 2018
II
Truth is so large a target that nobody can wholly miss hitting it, but at the same time, nobody can hit all of it…
The investigation of the truth is in one way hard, in another easy. An indication of this is found in the fact that no one is able to attain the truth adequately, while, on the other hand, no one fails entirely, but everyone says something true about the nature of thing, and while individually they contribute little or nothing to the truth, by the union of all a considerable amount is amassed. Therefore, since the truth seems to be like the proverbial door, which no one can fail to hit, in this way it is easy, but the fact that we can have a whole truth and not the particular part we aim at shows the difficulty of it. Perhaps, as difficulties are of two kinds, the cause of the present difficulty is not in the facts but in us.
Aristotle
III
Abstract
The large amount of underground coal excavations have caused about 430 million-m3 goaf widely distributed in China. Goaf is an area that partially or wholly filled with waste and the collapsed rock mass from roof. The monitoring of the goaf properties is important, because the goaf-induced hazards are various with a potential threaten role to the mining operation and natural environment. The seismic method is an effective tool to detect goaf properties. However, in most of the previous investigations using with seismic velocity and attenuation in the goaf areas, goafs were treated as a homogeneous medium and the optimal seismic frequency was not considered against actual rock mass sizes. The characteristics such as porosity, stiffness of discontinuities, size of voids and fragments in the goaf area have not been clearly related to the seismic data, and a model to estimate gas permeability in the goaf also has not been established based on the seismic properties. In the present study, laboratory measurements were done using porous samples compressing rock particles to construct the new model equations for seismic attenuation and gas permeability consisting porosity, ratio of seismic wave length to particle size, and mechanical properties to apply for a field measurement in underground coal mine area.
Furthermore, the quantitative damage by earthquake on the ground surface have been simulated to clear the effect of the goaf on the seismic response.
The dissertation is composed of six chapters as follows:
Chapter 1: This chapter describes a potential inducing hazards by the existence of goaf in the underground strata and provides a background on the detection technologies of goaf field in coal mine areas. Furthermore, this chapter reviews in-situ investigations and theoretical approaches about the seismic and permeability characteristics of goaf presented by previous researches. The research objectives and thesis structures are also described in this chapter.
IV
Chapter 2: This chapter elaborates the measurement apparatuses and methodologies of the seismic and gas permeability in the laboratory. The preparation processes of intact rocks and porous samples compressing rock particles were described. Firstly, elastic modulus, porosity-effective relationship, mineral composition as well as the microstructure of three types of intact rocks, limestone, sandstone and bituminous coal, were measured as basic seismic data to compare the porous rock samples. Three intact rocks were crushed and sieved into particles with three group sizes of 0.12-0.25 mm, 0.25-0.5 mm and 0.5-1.0 mm. Those particles were used to form 135 porous specimens that were pressed in a cylindrical PVC pipe surrounded by a stainless socket using a hydraulic compression press. The porosities of the specimens were controlled to be 0.21 to 0.33 with stepwise compressive process and stress, because seismic property and gas permeability are very sensitive to the porosity. The seismic velocity and attenuation through the specimens were measured by wave frequency from 24 to 500 kHz. The permeability (k) was also measured with same porous specimens used for seismic measurements. The seismic attenuation and elastic velocity changes in rock/coal with different porosities, the effect of particle size (D) and seismic wavelength (λ) were deeply investigated.
Chapter 3: This chapter describes a new seismic attenuation model (the B-R model) based on the multi-fractured rock attenuation model. The B-R model accounts for (i) greater attenuation through fragmented rock due to increased contact points between the particles, and (ii) decreased attenuation caused by network propagating through the porous media. The B-R model was applied to the laboratory measurement results of ultrasonic wave attenuation using compressed porous rock and coal samples, and good agreements were found for various porosities, particle sizes and wavelength.
The relationship between porosity and elastic velocity change was closer to that of the B-R model compared with the empirical relation. The B-R model showed better agreement with measurement results when λ/D varied between 65 and 80, which covers most of the λ/D range expected at a coal mine goaf.
V
Chapter 4: This chapter describes the results of permeability of the porous samples.
The results showed that the measured permeability conformed to the corrected Kozney-Carman equation with percolation threshold porosity of 0.06, tortuosity 5–10 and power 4 on porosity. It was cleared that the permeability of porous samples can be expressed with a new model equation combining average square value of particle sizes and two functions defined for seismic velocity change and attenuation. The estimated permeability by the model equation showed a good agreement with the measured permeability data. The permeability of the actual goaf in coal mine was estimated to be k = 107-109 md based on compressive stress, rock mass size and properties in the goaf.
Chapter 5: This chapter describes seismic damping coefficient input for the simulator to investigate earthquake wave propagation through the gaof area. The variation of the elastic modulus of goaf material with time was also explained. Various simulations models were established considering the depth, porosity, compaction time as well as the varied damping coefficient. The numerical simulation results showed that the peak ground acceleration (PGA) above the goaf area is reduced because of the presence of goaf. The PGA above goaf is gradually increased with the increasing depth and compaction time of goaf. However, peak ground displacement (PGD) above goaf is increased as the reduction of depth and compaction time of goaf. Especially, the PGD above a shallow goaf 100m from the surface is amplified 2 to 7 times compared with that of the free-field condition. Additionally, the resonant period of the response acceleration spectrum above goaf is around 0.2s longer than that of the places above undisturbed coal-seams.
Chapter 6: This chapter presents the conclusions of this study including the seismic and permeability properties of goaf areas as well as the application of the established models for the estimation of permeability and earthquake damage in the underground coal mine field scale.
VI
Table of Contents
CERTIFICATE ... I Abstract ... III List of Tables ... X List of Figures ... XI Acknowledgements ... XVI
Chapter 1: Introduction ... 1
1.1 Energy production from coal ... 1
1.2 High-intensity and large-scale coal production in China... 2
1.3 Goaf-induced hazards in underground coal mine ... 3
1.3.1 What is goaf ? ... 3
1.3.2 The issues induced by underground goaf ... 5
1.4. The characters of the underground goaf areas ... 6
1.4.1 Porosity of goaf... 6
1.4.2 Mechanical modulus of goaf area ... 8
1.4.3 Permeability in the goaf area ... 9
1.4.4 Seismic properties propagating through the goaf area ... 11
1.5 Effective medium theory for the unconsolidated porous sediment ... 13
1.6 Seismic attenuation ... 15
1.7 Objectives of present research ... 18
1.8 Summary of chapters ... 20
VII
Chapter 2: Laboratory measurements of ultrasonic and permeability of the compressed
porous samples ... 22
2.1 Introduction... 22
2.2 Preparation of compressed porous samples ... 23
2.2.1 Intact samples ... 24
2.2.2 Compressed porous samples ... 26
2.3 Microstuctures in compressed rock samples ... 28
2.4 Effective stress and porosity ... 29
2.5 Young’s modulus of compressed porous samples ... 30
2.6 Seismic measurements ... 33
2.6.1 Seismic attenuation ... 35
2.6.2 P-wave velocity measurements ... 38
2.7 Permeability measurement of the compressed porous samples ... 42
2.8 Conclusions... 46
Chapter 3: Model of seismic attenuation of the wave propagating through compressed porous rock... 47
3.1 Introduction... 47
3.2 Establish of seismic attenuation model through porous media ... 50
3.3 Effect of λ/D on seismic attenuation ... 57
3.4 Comparison of the B-R model and laboratory measurements for different particle sizes and frequencies ... 59
3.5 Correlation between P-wave velocity and porosity ... 62
VIII
3.6 Conclusions... 63
Chapter 4: Estimate of permeability of compressed porous rock by seismic velocity and attenuation ... 65
4.1 Introduction... 65
4.2 Kozney-Carman equation ... 66
4.3 Correlation between permeability and seismic properties ... 68
4.3.1 P-wave velocity and permeability ... 69
4.3.2 Seismic attenuation and permeability ... 71
4.3.3 Correlation between tortuosity factor and P-wave velocity ... 71
4.3.4 Correlation between the function of porosity in K-C equation and seismic attenuation ... 74
4.4 Empirical equation for permeability expressed by changes of seismic properties... 75
4.5 Field application ... 76
4.6 Conclusions... 77
Chapter 5: Simulation on seismic damage on the ground surface above goaf ... 79
5.1 Introduction... 79
5.2 Field case in Tangshan earthquake ... 82
5.3 Selection of properties in the simulation model ... 84
5.3.1 Steps of simulation ... 84
5.3.2. The principle of dynamic calculation ... 85
5.3.3. Establish of the model ... 86
IX
5.3.4. Properties of the undistrubed strata and goaf area ... 88
5.4 Damping coefficient of goaf material ... 92
5.5 Test waves and dynamic parameters ... 94
5.6 Results and discussions... 95
5.6.1 Time-history acceleration on the ground surface ... 95
5.6.2 Peak ground acceleration (PGA) above goaf for the cases of different depths and compaction time... 97
5.6.3 The variation of peak acceleration crossing the goafs of the cases of different depths and compaction time ... 98
5.6.4 Seismic displacement on the ground surface above a goaf ... 102
5.6.5 Response acceleration on the ground surface above goaf ... 105
5.7 Conclusions... 108
Chapter 6: Final conclusions and outlook ... 110
6.1 Summary of present research ... 110
6.1.1 Laboratory measurements of seismic and permeability of simulated goaf cases ... 110
6.1.2 Modeling of seismic attenuation through the simulated goaf ... 111
6.1.3 Relationship between permeability and seismic properties of goaf 111 6.1.4 Numerical simulation... 112
6.2 Outlook ... 112
References ... 114
X
List of Tables
Table 1-1. Coal mine goaf classification (Lunarzewski, 2010) ... 4 Table 2-1. Comparison of parameters used in previous field studies and present laboratory measurements ... 23 Table 2-2. Physical parameters of intact samples used for present measurements ... 25 Table 2-3. Mineral composition of the intact samples ... 26 Table 2-4. Comparison of parameters measured in the previous field studies and present laboratory measurements ... 33 Table 4-1. Estimate of the tortuosity factor in the previous studies ... 70 Table 5-1. Comparison of seismic intensity above the goaf of Kailuan mining area and the region above undistributed area ... 84 Table 5-2. Rock properties of the undisturbed strata ... 88 Table 5-3. Properties of goaf materials for the cases of different depths and compaction time ... 91 Table 5-4. The damping coefficient, αL through goaf of different depths and compaction time for numerical simulations ... 94
XI
List of Figures
Figure 1-1. Proportion of resources in the global energy production (BP Statistical Review of World Energy, 2017). ... 1 Figure 1-2. Coal production by region (BP Statistical Review of World Energy, 2017).
... 2 Figure 1-3. The number of the underground and surface coal mines in the three world largest coal production countries (Energy choices, 2014). ... 3 Figure 1-4. Schematic figure of underground goaf. ... 4 Figure 1-5. Distribution of coal field in China (China National Energy Administration, 2015). ... 5 Figure 1-6. Estimate of the height of goaf in a longwall working face. ... 7 Figure 1-7. Methane flow in the goaf and the interaction with adjacent areas. ... 10 Figure 1-8. Velocity tomogram of the area surveyed to detect old mine works. (The lower velocity areas are indicative of fractured material or old works. Higher velocities are obtained in areas of intact coal) (Hanson et al., 2002) ... 12 Figure 1-9. Hashin-Shtrikman arrangements of sphere pack, solid, and void (Dvorkin and Nur, 2002). ... 14 Figure 2-1. Source of the rock samples (a) bituminous coal, (b) limestone and (c) sandstone (Fukuyama et al., 2004; Luan et al., 2018; Pepper et al., 1954). ... 23 Figure 2-2. Coring bit (Left) and surface grinder (Right). ... 24 Figure 2-3. Intact samples of (a) limestone, (b) sandstone (c) bituminous coal and (d) sandstone with PVC pipe. ... 24 Figure 2-4. X-ray fluorescence equipment for rock composition measurement. ... 25
XII
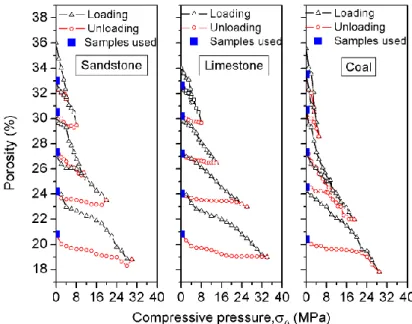
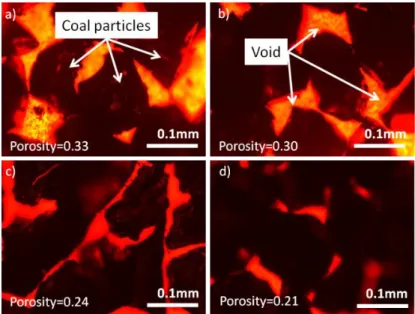
Figure 2-5. Electric high-temperature furnace for coal composition measurement. ... 25 Figure 2-6. Press molding machine (upper panel) used to form the porous rocks and coal samples (lower panel)... 26 Figure 2-7. Porosities of the compressed porous samples under stepwise compression.
... 27 Figure 2-9. Microstructure of compressed porous samples consiting of 0.12-0.25 mm coal particles. ... 29 Figure 2-10. Effective stress versus porosity. ... 30 Figure 2-11. Size distribution of fragmented rock masses in the actual goaf and sandstone particles in our laboratory measurements. ... 31 Figure 2-12. Young’s modulus of compressed porous samples. (a) sandstone, (b) limestone and (c) bituminous coal ... 32 Figure 2-13. Apparatus of seismic and permeability measurement. (1) spring; (2) piston;
(3) transducers; (4) pedestal; (5) compressed porous sample, A = 1.26×10⁻³ m2; (6) pulse transmission apparatus and analyzer (Pundit Lab+); (7) storage and software; (8) PVC pipe, 40 mm inner diameter; (9) display; (10) gas flow meter controller; (11) gas flow meter; (12) differential gas pressure gauge; (13) laser rangefinder; (14) PVC cup ... 34 Figure 2-14. Spectra of the intact sandstone sample (upper) and sample with PVC casing (lower)... 34 Figure 2-15. Seismic attenuation against porosity for different frequencies. (a) sandstone, (b) limestone and (c) bituminous coal ... 36 Figure 2-16. Seismic attenuation against porosity for different particle size. (a) sandstone, (b) limestone and (c) bituminous coal ... 37
XIII
Figure 2-17. P-wave velocity against porosity for different frequencies. (a) sandstone, (b) limestone and (c) bituminous coal ... 39 Figure 2-18. P-wave velocity against porosity for different particle size. (a) sandstone, (b) limestone and (c) bituminous coal ... 41 Figure 2-19. Correction of gas permeabilty. ... 43 Figure 2-20. Corrected permeability by Klinkenberg effect vs. porosity. ... 44 Figure 2-21. Permeability vs. porosity for different particle sizes. (a) sandstone, (b) limestone and (c) bituminous coal ... 45 Figure 3-1. Transmission and reflection of an incident wave at a contact surface between two elastic half-spaces. ... 47 Figure 3-2. Seismic wave attenuation propagating through the contact surfaces in the fragmented rock. (a) A model of spherical rock masses arranged in series on a straight line. (b) Effect of network propagation through porous rock masses in statistically random arrangements. ... 51 Figure 3-3. Hertz theory for the contact surface between particles. ... 53 Figure 3-4. Relationship between porosity and ra. ... 53 Figure 3-5. Mean squared error between the B-R model and measurement results vs.
duplication factor, n, for compressed porous samples (φ = 0.27; D = 0.5–1.0 mm). .. 55 Figure 3-6. Correlation between optimal n and VPG (φ = 0.27–0.33; D = 0.5–1.0 mm).
... 56 Figure 3-8. Difference error ζ (%) between the measured data and the B-R model prediction vs. λ/D. ... 58 Figure 3-9. Attenuation vs. porosity for different particle sizes. (a) D = 0.12–0.25 mm, (b) D = 0.25–0.50 mm and (c) D = 0.50–1.00 mm ... 60
XIV
Figure 3-10. Attenuation vs. porosity for different frequencies. (a) 37 kHz, (b) 54 kHz and (c) 82 kHz ... 61 Figure 3-11. Comparison of seismic attenuation in a wavelength vs. P-wave velocity ratio for the experimental measurements. ... 63 Figure 4-1. Schematic of seismic wave transmitting and gas flow cross the compressed porous material... 66 Figure 4-2. Size distribution of the sandstone particles in our laboratory measurements.
... 68 Figure 4-3. Permeability measurements, normalized by particle size squared, for different rock types and three particle sizes. The solid curve is the K-C relation modified to incorporate a percolation threshold porosity of φc=0.06 and dependent porosity of φ4. (a) sandstone, (b) limestone and (c) bituminous coal ... 73 Figure 4-4. Velocity variation coefficient (η) versus tortuosity (τ) for different rock types. ... 74 Figure 4-5. Permeability measurements, normalized by particle size squared and tortuosity versus attenuation variation coefficient (ξ) for different rock types. ... 75 Figure 4-6. Comparison of estimated permeability (k’) and measured permeability (k).
... 76 Figure 5-1. The schematic of surface seismic response under the integration of earthquake and underground goaf. ... 80 Figure 5-2. Distribution of mined-out areas and seismic intensity region in Kailuan mining areas. ... 83 Figure 5-3. Schematic of the steps of simulation. ... 85 Figure 5-4. Three-dimensional model. ... 86
XV
Figure 5-5. Schematic illustration of goaf area in the model. ... 87 Figure 5-7. Incident Kobe acceleration waves. Figure 5-8. FFT of the incident wave.
... 95 Figure 5-9. Acceleration of point #1 above goaf at different depths. (a) 100m, (b) 400m, (c) 700m and (d) free-field ... 96 Figure 5-10. Ratio of PGA in the presence of goaf and that of free-field for the conditions of different depths of goaf. ... 97 Figure 5-11. Effect of compaction time on PGA in the goaf-presence region. ... 98 Figure 5-13. Variation of peak acceleration through the goaf under different compaction time. (a) 0.1 year, (b) 1 year, and (d) 2 years. ... 101 Figure 5-14. Ratio of PGDg and PGDf at different positions away from goaf on the ground surface. ... 102 Figure 5-15. Effect of compaction time on PGD. ... 103 Figure 5-16. Displacements of subsurface and surface for the cases of different depths of goaf. (a) 100m, (b) 300m, (c) 500m and (d) 700m ... 104 Figure 5-17. Displacement of surface and subsurface for the cases of goafs under different compaction time. (a) 0.1 year, (b) 1 year, (c) 2 years and (d) 4years ... 105 Figure 5-18. Response acceleration spectrum of points with different distances to the center of goaf on the ground surface... 106 Figure 5-19. Response acceleration spectrum of point #1 above different depths of goaf.
... 107 Figure 5-20. Response acceleration spectrum of point #1 above a 100m-depth-goaf for the cases of different compaction time. ... 107
XVI
Acknowledgements
Firstly, I would like to express my sincerely gratitude and highly acknowledge to Prof.
Kyuro Sasaki for the opportunity provided to me to pursue the Ph.D degree at Kyushu University. He has given me not only the professional knowledge and rigorous attitude on academic research, but also the perspective and thinking depth on the study and life. My research can not be conducted without his patient guidance and instructions. I also would like to express my appreciation to Prof. Zhang for his support on my research and my life. I am also very thankful to Prof. Yuichi for his assistance on my research and instruction on my experiment.
I would like to pass my deep gratitude to Prof. Hemanta Hazarika for his reviews and comments to improve my thesis considerably. I thank Prof. Hideki Shimada for his providing and support on my laboratory equipment. I also would like to express my respect and gratitude to Dr. Ronald and Dr. Afika for their professional advises and comments. Furthermore, I thank Dr. Wang from Liaoning Technical University for his useful discussion on my research. Equally, I thank Mr. Jia from the CCTEG Shenyang Research Institute for his valuable in-situ information.
I gratefully acknowledge financial support received from the Japanese Government (MEXT) to pursue Ph.D degree at Kyushu University. I also would like to thank the funding support for my conferences and researches abroad by Kyushu University. I thank the Daliuta coal mine in Inner Mongolia for providing the coal samples.
I would like to thank Mrs. Zhao for her care and help on my life. Meanwhile, I thank all former and present members of Resources Production and Safety Engineering Laboratory for their assistance and lively environment.
Finally, my deep acknowledge to my mother and my girl friend for their support and understanding.
1
Chapter 1: Introduction
1.1 Energy production from coal
The fossil resources including oil, natural gas and coal account for about 86% of the global energy supplements. As is reported by BP Statistical Review of World Energy, the percentage of oil, gas, coal have a share of 33, 24 and 28%, respectively in the global energy mix in 2017. Even if a number of pollution and climate change issues have been caused by fossil resource burning, but the fossil resources are still holding the domination of the energy supply.
Meanwhile, it can be seen in Figure 1-1, the coal production in the last 25 years are steadily increasing in the global energy proportion. As is well known, coal is a finite and non-renewable resource in the nature. Meanwhile, a number of artificial hazards and pollution are induced by mining activity. Therefore, the safe and sustainable as well as environment-friendly mining operation needs to be vigorously developed.
Figure 1-1. Proportion of resources in the global energy production (BP Statistical Review of World Energy, 2017).
2
In my view, three major factors are supposed to be considered in the coal exploitation.
Trying our best to guarantee the safety in the coal mining operation including underground and surface coal mines.
Taking the efforts to reduce the pollution caused by mining activities and coal usages.
Strive to develop the clean, environment-friendly and lower-cost method in monitoring and management in coal fields.
1.2 High-intensity and large-scale coal production in China
According to the latest report, the coal production of China is the largest in the world, which takes account 51% of the global coal production (Figure 1-2) (BP Statistical Review of World Energy June, 2017).
Figure 1-2. Coal production by region (BP Statistical Review of World Energy, 2017).
Coal occupies the absolute majority of primary energy supply in China. Around 72%
of the Chinese energy production are from coal. About 75% of industrial fuels, 85%
of chemical raw materials, and 90% of civil fuels depend on the energy produced by
China 51%
India 10%
US 10%
Australia 7%
Indonesia 6%
Russian Federation
6%
South Africa
4%
Germany 3%
Poland 2%
Kazakhstan 1%
3
coal. Therefore, for a long period in future, coal resource is still the largest source for the Chinese energy demand. With the rapid demand for development, Chinese annual coal production have risen up to about 3.5–4.3 billion tons, in which around 2.8 billion tons come from the underground coal mine. Meanwhile, as the year-to-year increasing exploitation of coal resource, a series of issues have inevitably occurred involving environment, safety and geological damage.
1.3 Goaf-induced hazards in underground coal mine
1.3.1 What is goaf ?
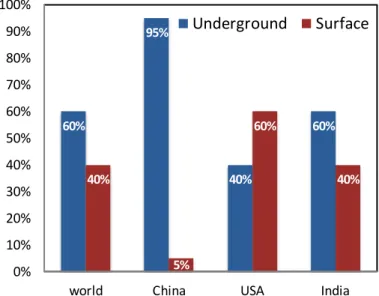
The mining method can be approximately divided into two ways: underground mining and surface mining. Around 60% of the global coal mines are exploited by underground coal mining (Figure1-3). In the process of underground coal exploitation, as the working face moves forward, coal is partially or wholly removed from the coal seam, therefore, the roof above the coal seam will be broken into fragments and collapse into the space behind the working face. This abandoned area behind the working face is called as goaf.
Figure 1-3. The number of the underground and surface coal mines in the three world largest coal production countries (Energy choices, 2014).
60%
95%
40%
60%
40%
5%
60%
40%
0%
10%
20%
30%
40%
50%
60%
70%
80%
90%
100%
world China USA India
Underground Surface
4
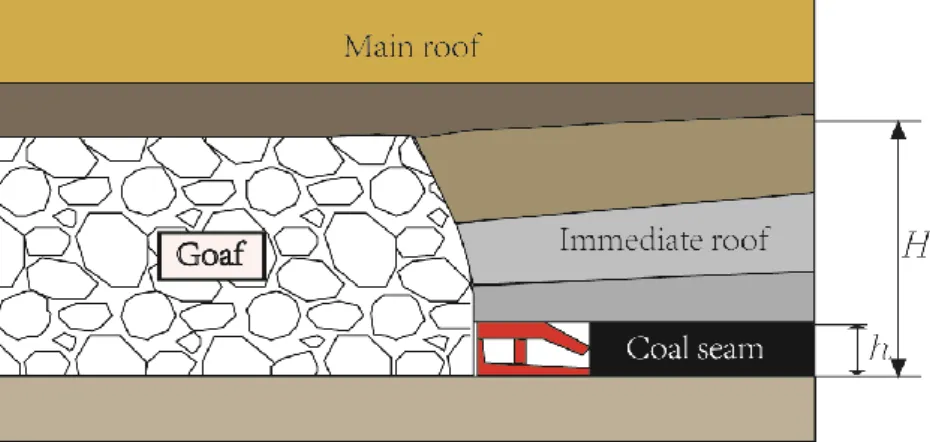
Figure 1-4. Schematic figure of underground goaf.
As is mentioned, a goaf consists of fragmented rock that collapsed from the roof rock above the coal seam (Figure1-4). Because significant rock-mass failures and subsequent stress redistribution are induced after coal extraction, several issues of a goaf must be considered, including collapsed areas and goaf reconsolidation. Based on the different mining methods and management, goafs are divided into different types.
The classification of general goafs is listed in Table 1-1.
Table 1-1. Coal mine goaf classification (Lunarzewski, 2010) Classification Mine entries and
surface boreholes Ventilation Coal production
Water
pumping Responsibility
Temporary closed
Opened, not permanently or partially sealed
Operating on reduced
capacity
Ceased Possible
future production
Optional Mine operator (maintenance)
Closed Partially or fully sealed
Terminated
Ceased No future production
Terminated Goaves gradually flooding
Mine operator
Decommissioned
Permanently sealed
Transferred from mine operator to the
relevant Authority Abandoned
Sealed longwall
or district Optional Mine operator
5
1.3.2 The issues induced by underground goaf
The coal produced by underground mining takes account a large proportion of the total coal production. It was reported that by the end of 2017 (China National Energy Administration, 2017), in China, around 4980 coal mines are in the running with the production capability of 4.36 billion tons per year. Around 95% of these mines are underground coal mine that distributed in the major six coal formations (Figure 1-5).
Figure 1-5. Distribution of coal field in China (China National Energy Administration, 2015).
Because of the large-scale of underground exploitation, the abandoned goaf areas distributed in various parts of China are approximately 432 million m3 (China National Energy Administration, 2015). For an example, one of largest coal production province, Shanxi, there are 3000 km2 goaf areas have been found in the running and abandoned underground coal mines (China National Energy Administration, 2017).
In addition, in China, about 95% of the coal production is conducted by underground mining with long-wall working faces and managed by roof collapse method. This kind of mining method has induced unrecoverable structural damage to the overlying strata and caused severe surface subsidence. Such a large area of underground goaf plays a big potential threaten to the people and environment. For instance, the mining activity causes permanent and unrecoverable damages to the strata and further surface
6
destruction, including land resource subsidence and occupation, water resource loss and pollution, air pollution, as well as ecological damage and degradation. Additionally, the goaf areas containing highly void ratio could induce a leakage of ventilation airflow from the working face into the goaf areas (Karacan et al., 2011). The leakage air could induce coal spontaneous combustion(Wang et al., 2017) and then produce air pollution and greenhouse gas emission. Meanwhile, the methane from the adjacent coal seam is possible to flow into a goaf area through the fractured zone and then into the working face. Overall, the underground coal mining process has caused various serious and permanent destruction to the environment and human properties.
Facing such a big area in underground goaf, the most important is to accurately estimate the valuable properties of the active and abandoned goafs, including the mechanical and hydraulic properties. Only in this way, the goaf areas can be further utilized controlled and managed
1.4. The characters of the underground goaf areas
1.4.1 Porosity of goaf
Esterhuizen and Karacan (2007) proposed that the swelling ratio of goaf can be estimated based on the ratio of fall height to fragments width in terms of the rotation of the fragments. The porosity range 22-42% showed a good agreement with a realistic goaf gas venthole production that was employed as the parameter in the reservoir modeling. Karacan (2010) developed an approach that combines fractal scaling in porous medium with principles of fluid flow to estimate the porosity of goaf materials.
Zhou (2006) obtained the porosity (void ratio) in the goaf by taking the pictures of some piles of fragments inside the goaf.
Meanwhile, Szlązak (2001) presented that the formation pressure on the goaf area is increased with the distance from the working face because of the compaction, but the increasing degree was reduced gradually. The parabolic variation of the overburden
7
pressure results in a porosity range from 20 to 30% in the goaf, expressed as
(1-1)
where φ [-] is the porosity and x [m] is the distance from a position in goaf to the working face.
Figure 1-6. Estimate of the height of goaf in a longwall working face.
As porosity is related to the swelling ratio and height of the goaf, it could be estimated by an empirical equation (Liang et al., 2017). Bai et al. (1995) conducted an extensive survey of a large number of mines in China and USA considering the different geological conditions and derived a statistical regression formula which evaluates the height of the goaf (Figure 1-6),
(1-2)
where H [m] is the height of goaf; h [m] is the extraction thickness; and c1, c2 and c3 are coefficients that reflect the lithology of the surrounding rock. For average conditions in the goaf area in a coal mine, c1 = 4.7 m−1, c2 = 19 and c3 = 2.2 m were adopted by (Yavuz, 2004).
The swelling ratio of the goaf, KP, is estimated by
8
(1-3)
According to the definition of the swelling ratio, porosity is given as
(1-4)
The swelling ratio of the goaf usually ranges 1.3–1.7 (Palchik, 2002); thus, the porosity of the goaf is estimated as 23-41%.
1.4.2 Mechanical modulus of goaf area
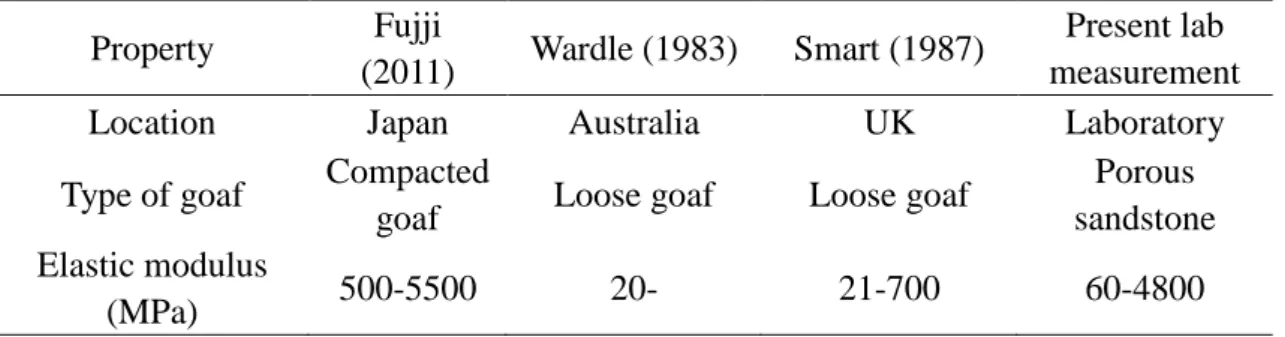
Deformation modulus of goaf have been measured by large scale in-situ tests and from detailed laboratory studies. Wardle (1983) conducted an in-situ test of caved waste piles from the roof failure in an Australian coal mine. The result showed a linear stress-strain curve and the elastic modulus was estimated as around 21.4 MPa at a maximum stress of 1.37 MPa. Meanwhile, Smart and Haley (1987) used a hydraulic jacking apply on a stone-built pillar in the United Kingdom, got a result of 20.7MPa for the elastic modulus under a vertical pressure of 5.5MPa. Kose and Cebi (1988) suggested a wide interval such as 15–3500 MPa for the modulus of elasticity value for goaf material. Xie et al. (1999) suggested the formula for determination of the modulus of elasticity of goaf material with respect to time. Su (1991) presented the elastic modulus 72 to 2900MPa to reflect the bilinear behavior of the goaf. Xie (1993) showed that the modulus of elasticity, Poisson’s ratio and the density of the goaf material change with time. Yavuz and Fowell (2004) proposed a value of 0.495 for the Poisson’s ratio of the goaf material in the Tuncbilek region. Fujji (2011) measured the Young's modulus of clastic-rock in the old closed roadway in the 300m deep at the Kushiro coal mine, Japan.
The test measured with a Goodman jack and provided a value of 500MPa around the borehole in the clastic-rock.
Meanwhile, Pappas and Mark (1993) conducted a series of laboratory experiments to
9
measure the deformation modulus of the goaf material. They used the size-scale-down method to simulate the goaf fragments size distribution in lab-scale, and the secant modulus was 0.7-63 MPa over the porosity (void ratio) from 0.1 to 0.8. The elastic modulus used in numerical simulation showed a relatively higher and wider values from 6.9 to 2400 MPa for the goaf modulus. Following the rule for estimating the modulus presented by Peng (2017) , Hsiung (1985) proposed the elastic modulus should be based on rock type and porosity in the goaf.
1.4.3 Permeability in the goaf area
Permeability is a key factor to estimate the capacity of a material allowing fluids to pass through it without changing or displacing the medium structure. Underground longwall coal mining causes large scale disturbances of the surrounding rock mass leading to the variation of stress and fragments of the rock mass. Goaf area is an abandoned space suffered from an irrecoverable damage during the mining operation. The clastic condition results in a much higher permeability compared with intact or fractured rock.
Accurate knowledge of permeability in goaf is essential for methane production, ventilation, methane control and operation safety during and after the mining operation.
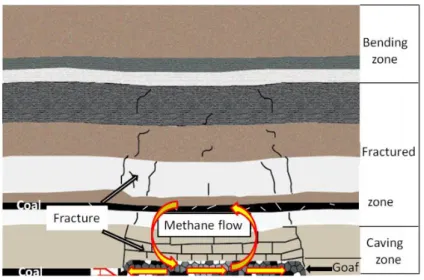
For example, during the mining operation, goaf behind a working face contains high porosity (void ratio) due to fragmented rock pieces and may result in air leakage into the goaf zone or flow from surrounding formations into the working face; The air leakage into the goaf may probably cause coal spontaneous combustion resulting from the oxygen concentration increase (Figure 1-7).
Beside, when an underground mine ceases coal production, methane gas continues to flow into the underground workings through the process of desorption from residual coal left in the goaf. For gassy mines this desorption process will last for many years.
This desorption process has a long-term potential in risks, such as explosion on the surface and surrounding public as well as the greenhouse gas emissions.
10
Figure 1-7. Methane flow in the goaf and the interaction with adjacent areas.
Mostly, the permeability measurement techniques are used by the industry, such as wireline-log measurement, laboratory measurement on core samples and well testing.
Some studies have conducted the permeability using crushed materials in the laboratory (Li et al., 2018). Ma et al. (2016) measured the seepage properties of different rocks including crushed sandstone, limestone, mudstone, and coal by a self-designed water-flow apparatus. Peng and Loucks (2016) conducted permeability measurements on the crushed rock by gas-expansion method. However, in the field, direct measurement of permeability through the goaf areas are extremely difficult because of the inaccessibility to the internal space of goaf (Adhikary and Guo, 2015). The in-situ investigation on the goaf has been very limited. Fujji et al. (2011) conducted an in-situ measurement using a long-drilled hole and provided the permeability data ranging from 1 to 100 d (darcy). However, the region they investigated was the 50-year goaf in which fracture and cleat were completely closed.
Some studies presented permeability values based on volumetric strains and geomechanical calculations. Brunner (1985) used permeability values of goaf ranging from 105 to 107 d in his ventilation simulation. Ren et al. (1997) proposed a permeability of 102 d in a compacted goaf. Whittles et al. (2006) reported a range of 104
11
to 5 × 10⁵ d. Szlazak (2009) estimated the permeability ranging from 5.07 × 10³ to 1.01 × 10⁶ dbased on the resistance of the rock roof stratification from the caving.
Karacan et al. (2007) presented a permeability range of 1 × 10⁵-4 × 10⁵ d according to the K-C equation combined with a base permeability coefficient. Karacan (2011) proposed a predictive approach to calculate the porosity and permeability from the size distribution of broken rock material in a goaf by combining fractal scaling in porous medium with the principles of fluid flow.
1.4.4 Seismic properties propagating through the goaf area
A number of studies were conducted to investigate the goafs and obtain the goaf parameters. At present, geophysical methods to detect the characteristics of goafs can be classified into surface and subsurface techniques (Wang et al., 2008). Because of its reliability and low operating costs, the seismic detection method is widely applied in the field.
For example, the “Mine Void Detection Demonstration Projects” carried out by the USA Mine Safety and Health Administration (MSHA) consisted of 11 sub-projects within a total of 14 projects that were based on seismic methods (Ge et al., 2008).
However, most investigations were conducted using indirect seismic methods, such as surface (Gochioco, 2000; Li et al., 2011), borehole (Cao et al., 2015; Chen et al., 2015;
Luxbacher et al., 2008) and in-seam (Cai et al., 2014; Dresen and Rüter, 1994; Friedel et al., 1997) seismic surveys because of the inaccessibility of the goaf and the safety risk inside it. Some field investigations inside goafs (Fujii et al., 2011) have been mentioned in the literature. Furthermore, it has been suggested that the general seismic method provides inaccurate results because of its lower resolution (Barton, 2007). To address this issue, some researchers used high-resolution seismic methods to detect the voids and the stress distribution in the goaf (Poursartip et al., 2017; Tselentis and Paraskevopoulos, 2002). Seismic tomographic imaging, which is analogous to the medical Computer Aided-Tomography Scans, is capable of identifying the location
12
and condition of the geologic and stress patterns of the inaccessibility such as goaf areas. Many tomography applications in the mining industry use seismic velocity and/or attenuation tomography within a volume enclosed by the seismic source and receiver arrays. The principle of tomography method is based on the energy variation of the seismic reflection or transmission waves reflected or through the anomalies in the strata. At an Australian longwall coal mine, the tomography system was installed to aid in predicting periodic shield loading (Hanna and Haramy, 1998).
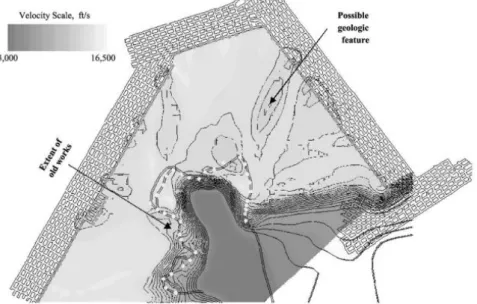
Figure 1-8. Velocity tomogram of the area surveyed to detect old mine works. (The lower velocity areas are indicative of fractured material or old works. Higher velocities are obtained in areas of intact coal) (Hanson et al., 2002)
Attenuation tomography on the shearer was employed as a source in a relative shallow Australian longwall coal mine to determine if roof structural anomalies or fracture zones, along with stress conditions. MSHA (Hanson et al., 2002) has conducted a seismic tomography system to detect the old working near the on-going mining panel (Figure 1-8). The seismic velocity was around 1000m/s in the old working which is obviously less than that of the intact region. Meanwhile, Si et al.
(2015) employed arrays of seismic sources and geophones in the roadway at Velenje
13
coal mine in Slovenia. They showed the velocity transmitted through the goaf areas is 1300m/s by using tomography imaging.
The previous seismic detection method has proved that the seismic method is capable of providing a relatively accurate estimate of the anomalies such as goaf and other fractured or damaged strata. However, selecting the optimum frequency still involves an uncertainty, because the porosity and fragmented coal and rock size distribution in the goaf are not precisely known.
1.5 Effective medium theory for the unconsolidated porous sediment
Goaf area is a space consisting of large void and random-shaped rock masses in different sizes. This kind of formation results in a large number of discontinuities such as voids, joints, fractures and microcracks at all scales. These discontinuities might be aligned in one particular direction or randomly oriented. Generally, effective medium theory is used to assumes that the rock consisting of voids or fractures can be seen as a whole. The compliance of the discontinuities is taken into the average strain of the rock (Lubbe and Worthington, 2006). It means that the reduced modulus leads to the decrease in seismic velocity and the increase in attenuation. Effective medium theories can be used to treat the effect of a porous rock on fluid flow (Kachanov, 1980; Oda, 1985) and seismic propagation (Sayers and Kachanov, 1991; Schoenberg and Sayers, 1995). Eshelby (1957) firstly attempted to explain the reduced modulus resulting from the discontinuity and successfully obtained the elastic modulus of an infinite solid containing ellipsoidal inclusions. Hudson (1981) presented a commonly used model for estimating the effective elastic properties of a transversely anisotropic crack rock This model is based on a simplified analysis of a thin circular crack, considering displacement and stress conditions on the boundaries of the cracks. The model focused not only on the number of the discontinuities, but also the interactions between the discontinuities.
14
For the porous media, it is commonly to estimate the effective modulus by using Mindlin-Hertz theory.
(1-5)
(1-6)
where KHM [MPa] and GHM [MPa] are the bulk and shear modulus at critical porosity φc, P [MPa] is the compressive pressure; K [MPa] and G [MPa], are the bulk and shear moduli of the solid phase, ν [-] is Poission’s ratio, and C [-] is the coordination number.
However, this theory is most efficient for the case at the critical porosity of the porous media. Therefore, Dvorkin et al. (1995) developed the Hashin-Shtrikman model to estimate the modulus at a certain porosity that is larger or smaller than the critical one.
(a) Hashin-Shtrikman lower model
This model connects two end-points in the elastic-modulus porosity plane. One end point is at the critical porosity which can be obtained by Hertz-Mindlin. The other point is the elastic modulus of the pure solid phase.
Figure 1-9. Hashin-Shtrikman arrangements of sphere pack, solid, and void (Dvorkin and Nur, 2002).
These two points in the porosity-modulus plane are connected with the curves that have the algebraic expressions of the Hashin-Shtrikman lower model bound for the mixture
15
of two components: the pure solid phase and the phase that is the sphere pack (Figure 1-9). While this model is only useful for the porosity which is smaller than critical porosity, the higher porosity above critical porosity has to be estimated by the another model by the name of Hashin-Shtrikman upper bounds
(b) Hashin-Shtrikman upper bounds (Helgerud et al., 1999)
This model is analogous to the friable sand model but covers the porosity range above critical porosity. One end point is the critical porosity estimated by Hertz-Mindlin theory (Johnson, 1987). For the higher porosity, empty voids are added to the sphere pack (Figure 1-9). In this case the voids are placed inside the pack in the Hashin-Shtrikman fashion. At porosity φ>φc, the concentration of the void phase is (φ-φc )/ (1-φc ) and that of the sphere-pack phase is (1-φ)/ (1-φc ). Then the effective dry-rock frame bulk and shear modulus are:
(1-7)
(1-8)
Based on the models mentioned above, seismic velocity can be derived from the elastic modulus.
1.6 Seismic attenuation
In order to improve the resolution of seismic detection, the bandwidth frequency of the incident wave should be wider and higher. However, the higher frequency wave is susceptible to the rock strata and to be easily attenuated. Therefore, the extent of the attenuation should be figured out in order to take measures to improve the accuracy of
16
the seismic detection. We herein discussed the definition of the seismic attenuation and attempted to show the relationship between them.
(a) For the homogeneous media, the amplitude of plane wave is
(1-9)
where A0 [-] is the initial amplitude of the incident wave; x [m] is the travel distance;
ω(t) is the wave function. If the sphere spreading is considered, a factor of sphere spreading (1/x) can be multiplied to the expression.
(b) Quality factor (Q) is another factor to describe the attenuation in terms of the energy loss in one cycle
(1-10)
where (-∆E ) is the energy loss per cycle in a material with peak strain energy E. It can be generalized to include the rate of loss of energy expressed by differential form (Lubbe and Worthington, 2006):
(1-11)
where T [s] is the period of the propagating wave.
Integrating 1/Q on time, the Equation 1-11 can be converted into
(1-12)
where E0 [-] is the initial energy at time; t [s] is the travel time of the propagating wave;
V [m/s] is the velocity of the material.
Because energy is proportional to the square of amplitude, therefore,
17
(1-13)
Equation 1-9 is equal to Equation 1-13, therefore,
(1-14)
(c) Logarithmic reduction (δ) is the logarithmic value of the ratio between the neighbor peak amplitude after traveling one wavelength
(1-15)
where β is the attenuation in the unit length. So the attenuation in one wavelength is equal to δ. A1 and A2 are the amplitudes of the neighbor peaks
(1-16)
where λ [m] is wavelength.
(d) Another property is decibel attenuation factor (db/m) which is defined as the decibel attenuation of the amplitude after traveling one wavelength.
(1-17)
Compare 1-16 and 1-17:
(1-18)
Consequently, the relationship between the different attenuation factor can be express as
(1-19)
18
1.7 Objectives of present research
As mentioned above, goaf is an area filled with different sizes of irregular-shaped rock fragments. A large number of discontinuities such as voids, joints, fractures and microcracks at all scales are observed in the goaf. The mass-distributed voids and complicated geometric skeleton results in the reduction of seismic velocity and increase of the attenuation. For the single fracture or aligned fractures, Pyrak-Nolte et al. (1987) has posed time delay at the discontinuity to predict the P and S-wave velocities in rock containing fractures. Gibson and Ben-Menahem (1991) and Boadu and Long (1996) presented elastic wave transmission model for the seismic attenuation passing through a system of aligned fractures. However, for the compressed porous rock, the theoretical model for the seismic attenuation needs to be further studied.
Meanwhile, because both of the seismic properties (velocity or attenuation) and hydraulic property such as permeability are related to volumetric and geometric features of the rock formation. A number of researches have attempted to relate the seismic characters to the permeability. For an example, Prasad (2003) used hydraulic units to predict the permeability by seismic velocity. Pyrak-Nolte and Morris (2000) tried to investigate the relation between the fracture permeability and seismic anisotropy to extract permeability information from seismic data.
Since goaf area performed is void space and more tortuous geometric skeleton, the correlation between permeability and seismic characters is different from that of the fractured rock.
In the meantime, the existence of goaf in the underground has a potential risk on the constructions on the ground surface above goaf. Especially, when earthquake happens, the propagation of earthquake wave may be affected by the presence of goaf. The previous research used a shaking table to observe the seismic response above goaf (Aydan Ö., 2003) in laboratory measurement. Some researchers also employed
19
simulation method to study the effect of large-scale goaf on the ground seismic response in the mining area. However, the non-linear elastic characteristic of goaf and the damping effect of goaf on seismic propagation have not yet been clearly studied.
Therefore, in this study, we attempted to establish the models to predict the seismic attenuation in the compressed porous rock. And corrected factor is propose by experiment to improve the precision of the estimated results from the empirical model.
Meanwhile, we established an empirical equation including effects of the tortuosity factor and porosity with the seismic velocity and attenuation to predict the permeability in the compressed porous rock. Additionally, the damping coefficient of goaf under different conditions such as depth or compaction time can be estimated based on the laboratory measurement, and try to study the seismic response on the ground surface above goaf in the coal mine areas.
The innovation of this research can be summarized as four points;
1. The previous seismic investigations modeled the goaf as an intact rock or fully void space. The wavelength of seismic wave in the discussion is much larger than the size of void or rock mass. As a result, the porosity or void space can not be clearly detected. In this research, it was figured out that the optimal ratio of wavelength and the size of rock mass can be used to estimate the porosity of porous layers.
2. The seismic attenuation in the unconsolidated porous rock like goaf area has not been studied previously. Most of the current theories focus on the intact or fractured rock rather than the porous rock. Therefore, this research attempted to establish a new model to estimate the seismic attenuation in the unconsolidated porous rock based on the laboratory measurement and theoretical approaches. The prediction shows a good agreement with the measured data.
3. The correlation between permeability and seismic properties have been studied by numerous researchers. However it is still difficult to estimate gas permeability in the
20
goaf area. This research has presented the model for the relationship between gas permeability and seismic velocity and attenuation of the porous rock specimen. The predicted permeability by the model showed a good consistency with the measured values. This correlation can be used to estimate the permeability in the actual goaf based on the seismic measurement data.
4. The seismic damage above the goaf areas have been studied by some researchers based on simulation analysis. But most of them treated the goaf area as intact according to the effective medium theory. Those results in the adsorption of seismic energy through the goaf only base on the variation of mechanical modulus. In this research, the damping coefficient has been presented based on the laboratory seismic measurements to describe the adsorption effect of goaf on the seismic energy. The simulation results of seismic response on the ground surface above goaf for different depths and porosities can be estimated more reasonable and accurate.
1.8 Summary of chapters
Chapter 2 firstly elaborates the experimental apparatus and sample preparation, and introduces the experimental procedures, and shows experimental procedures of the seismic and permeability measurements. Experimental apparatus is comprised of transient ultrasonic measurement and steady-state gas permeability measurement. Coal and rock particles in diameter of 0.12-1.0 mm were used to form the cylindrical porous samples by high-pressure compression machine. The P-wave seismic velocity and attenuation as well as the gas permeability were measured on the samples in different porosities, rock particle sizes and types of rock.
Chapter 3 presents a new seismic attenuation model (the B-R model) based on the multi-fractured rock attenuation model by Boadu and Long (1996). The B-R model accounts for (i) greater attenuation through fragmented rock due to increased contact points between the particles, and (ii) decreased attenuation caused by network
21
propagating through the porous media. And this model is applied to the laboratory measurement results of ultrasonic wave attenuation using compressed porous rock and coal samples and good agreement has been found for various porosities, particle sizes and wavelength.
Chapter 4 focuses on the tortuosity (τ) factor and effect of porosity (φ) on gas permeability in the cylindrical compressed porous rock samples, they are found to be related to the functions of seismic velocity variation and attenuation change (ξ and η), respectively. The function, η showed a linear relationship with the square root of the τ over the range of τ = 5–10. The function, ξ showed an approximately linear relationship with the porosity part of the K-C equation. A new empirical equation to estimate the permeability of the compressed porous samples has been presented by modifying the Kozney-Carman (K-C) equation with seismic velocity and attenuation. The permeability estimated by the empirical equation showed good agreements with the measured permeability of the compressed porous samples.
Chapter 5 describes numerical simulation study to analyze the earthquake damage on the ground surface above goaf areas in coal mine area. The elastic modulus of goaf region is based on compressive strength of the intact rock and porosity as well as the compaction time. The damping coefficient of the goaf is obtained by B-R model presented in Chapter 3. Numerical simulations are carried out for different conditions to study the acceleration, characteristic period, displacement on the ground surface above goaf in different geologic and geometric condition.
Chapter 6 concludes the results of the experiments and established models on seismic characteristics and permeability as well as the numerical study and field estimation.
Finally, the limitations of the present study are discussed, and the suggestions for the future research are proposed.
22
Chapter 2: Laboratory measurements of ultrasonic and permeability of the compressed porous samples
2.1 Introduction
The measurement of goaf area is a significant and imperative work for evaluating the safety of the underground and surface environment. However, it is difficult to conducted measurement directly in a closed goaf. This chapter introducs a method to measure the properties of the goaf area by simulating the condition of the goaf in laboratory measurement. Since Ebrom and McDonald (1994) reported that certain features may be reproduced on a small-scale in the laboratory measurement for seismic modeling. For reservoir modeling, the size of the object is usually set so that the ratio between the wavelength and size of the object is the same as in the laboratory setting.
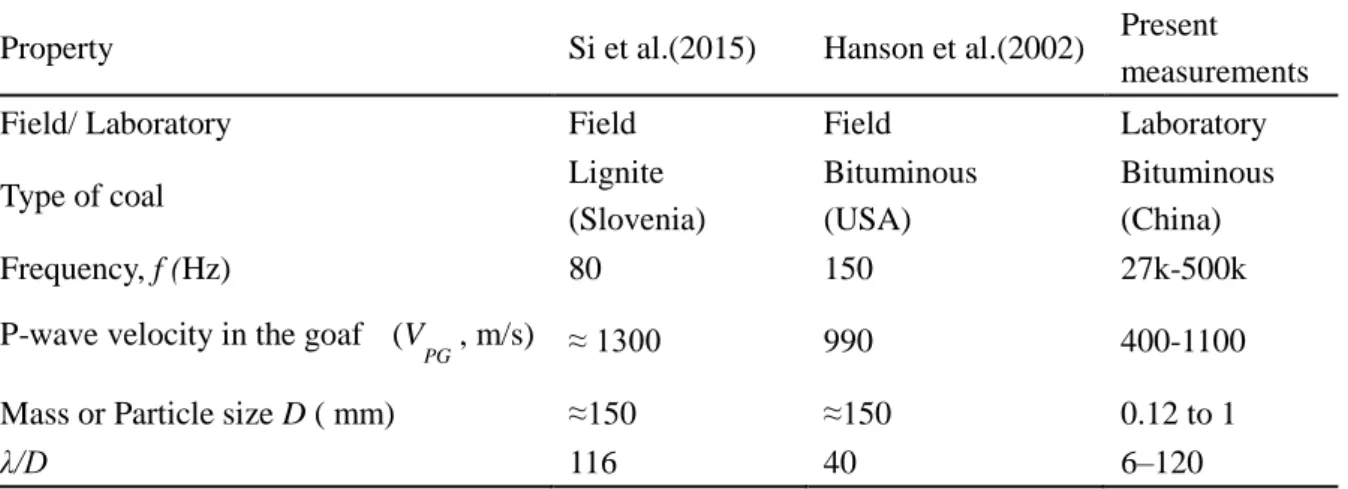
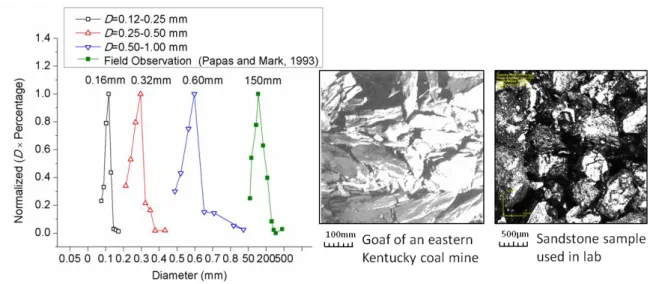
We therefore attempted to use the similar ratio of wavelength to rock or coal particle size for the measurement with ultrasonic wave. Meanwhile, according to the observation by Pappas and Mark (1993) in a goaf using a high-resolution camera, size distribution of the fragments in the goaf was approximately 60–450 mm. The majority of the fragments were 120-250 mm. Meanwhile, the P-wave seismic velocity and wavelength used in the usual field measurement is in the range of 1000-1500 m/s and 10-200 Hz. The ratio of wavelength and fragment size is from 11-120. In present experiments, coal and rock particles in diameter of 0.12-1mm were compressed into cylindrical porous samples under a high pressure by a molding machine. The size distribution of the particles have the analogous size distribution as the fragments in the actual goaf to keep the similar mechanical modulus. Ultrasonic wave frequency in the range of 37-250 kHz was applied for these samples consisting of 0.12-1mm in diameter.
The ratio of wavelength and particle size was set in the range 6-140 which covers the range of the field measurement (Table 2-1).
23
Table 2-1. Comparison of parameters used in previous field studies and present laboratory measurements
Property Si et al.(2015) Hanson et al.(2002) Present
measurements
Field/ Laboratory Field Field Laboratory
Type of coal Lignite
(Slovenia)
Bituminous (USA)
Bituminous (China)
Frequency, f (Hz) 80 150 27k-500k
P-wave velocity in the goaf (V
PG , m/s) ≈ 1300 990 400-1100
Mass or Particle size D ( mm) ≈150 ≈150 0.12 to 1
λ/D 116 40 6–120
2.2 Preparation of compressed porous samples
Three rock types of core samples were used in this study (sandstone, limestone and bituminous coal) to measure the mechanical parameters, wave velocities and attenuation as well as gas permeabilities. Sandstone core was Berea sandstone from West Virginia, USA. Limestone was from Kagumeyoshi formation located in northern Kyushu, Japan. Bituminous coal sample was from No.3319 panel (-300 m) of Daliuta coal mine in Inner Mongolia, China (Figure 2-1).
Figure 2-1. Source of the rock samples (a) bituminous coal, (b) limestone and (c) sandstone (Fukuyama et al., 2004; Luan et al., 2018; Pepper et al., 1954).
24
2.2.1 Intact samples
All of the samples were preserved in excellent condition after extraction to keep the original properties. Before the mechanical and wave measurement, the samples were put into the drying oven at 80oC for 7 days to remove the effect of the moisture. The cylindrical intact rock was cut from the sandstone and limestone rock mass by coring bit (Figure 2-2 Left) with 40mm in diameter. The coal intact samples were cut into a cuboid with the size of 6×6×8 mm rather than a cylinder to preserve its integrity. The end faces of the samples were cut roughly parallel with an edge saw and then polished with the surface grinder (Figure 2-2 Right).
Figure 2-2. Coring bit (Left) and surface grinder (Right).
In this way, intact rock samples (Figure 2-3) were made for measuring the mechanical properties. Mechanical parameters of the intact rocks are listed in Table 2-2.
(a) (b) (c) (d)
Figure 2-3. Intact samples of (a) limestone, (b) sandstone (c) bituminous coal and (d) sandstone with PVC pipe.
25
Figure 2-4. X-ray fluorescence equipment for rock composition measurement.
Mineral compositional of sandstone and limestone samples were measured by small rock particle in 0.01mm using X-ray fluorescence (Figure 2-4). The composition of coal were measured by thermal method (Figure 2-5) to obtain the primary content in coal samples. The mineral composition of the samples are shown in Table 2-3.
Figure 2-5. Electric high-temperature furnace for coal composition measurement.
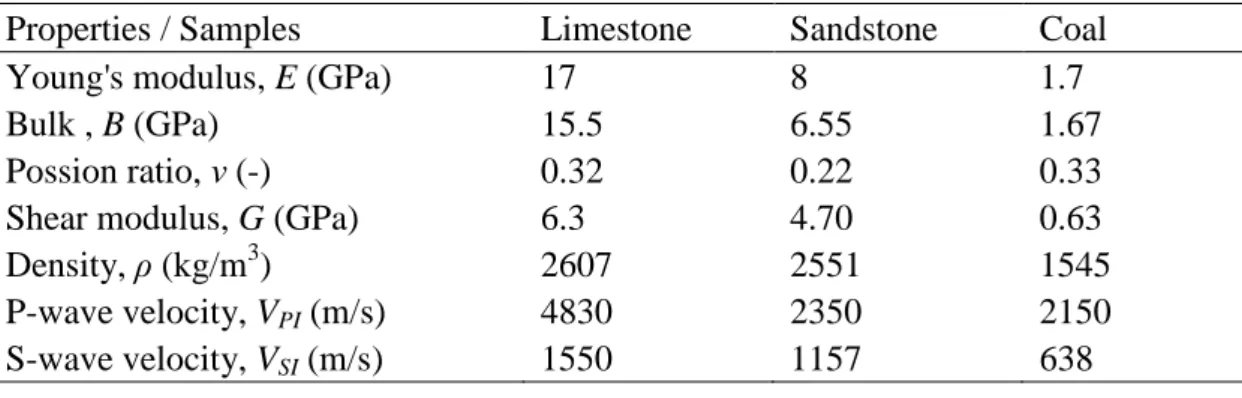
Table 2-2. Physical parameters of intact samples used for present measurements
Properties / Samples Limestone Sandstone Coal
Young's modulus, E (GPa) 17 8 1.7
Bulk , B (GPa) 15.5 6.55 1.67
Possion ratio, ν (-) 0.32 0.22 0.33
Shear modulus, G (GPa) 6.3 4.70 0.63
Density, ρ (kg/m3) 2607 2551 1545
P-wave velocity, VPI (m/s) 4830 2350 2150
S-wave velocity, VSI (m/s) 1550 1157 638
26
Table 2-3. Mineral composition of the intact samples
Coal Sandstone Limestone
Moisture (%) 3 SiO2 (%) 93.13 CaO (%) 54.24
Fix carbon (%) 69.8 AlO3 (%) 3.86 MgO (%) 0.28 Ash (%) 3 Fe2O3 (%) 0.11 P2O5 (%) 0.033 Volatile matter (%) 16.2 FeO (%) 0.54 I.R. (%) 2.6
Sulfur (%) 2 MgO (%) 0.25 Sr (%) 0.14
2.2.2 Compressed porous samples
The rock and coal particles were prepared by crushing the dried core samples. The particles were sieved into three groups according to particle size, with diameter ranges of D = 0.12–0.25 mm, 0.25–0.50 mm and 0.50–1.00 mm. The particles were compressed in cylindrical PVC pipes that were surrounded by a stainless-steel socket (Figure 2-6 upper panel).
Limestone Sandstone Coal
Figure 2-6. Press molding machine (upper panel) used to form the porous rocks and coal samples (lower panel).