Kyushu University Institutional Repository
中国における農業発展及び生産効率要因に関する研 究 : 河北省およびその他五省市を主な対象地域に して
李, 東坡
九州大学大学院生物資源環境科学府
https://doi.org/10.15017/21694
出版情報:Kyushu University, 2011, 博士(農学), 課程博士 バージョン:
権利関係:
RESEARCH ON FACTORS OF AGRICULTURAL DEVELOPMENT AND PRODUCTION EFFICIENCY IN CHINA: FOCUSING ON HEBEI PROVINCE AND OTHER
FIVE EASTERN PROVINCIAL-LEVEL REGIONS
LI DONGPO 2012
Doctoral Dissertation
RESEARCH ON FACTORS OF AGRICULTURAL DEVELOPMENT AND PRODUCTION EFFICIENCY IN CHINA: FOCUSING ON HEBEI PROVINCE AND OTHER
FIVE EASTERN PROVINCIAL-LEVEL REGIONS
LI DONGPO
Supervised by: Professor Dr. Nanseki Teruaki Laboratory of Agricultural and Farm Management
Dissertation Committee:
Professor Dr. Nanseki Teruaki Professor Dr. Yoshida Taiji Professor Dr. Fukuda Susumu
Department of Agricultural and Resource Economics
Kyushu University
ABSTRACT
This study aims to analyze the impacts of component factors to gross agricultural growth and production efficiency of staple crops and individual farms in China; identify countermeasures to improve agricultural productivity, with sufficient, safe supply of agro-products; rational, efficient and proper application of production factors, and sustainable, friendly effects to the environment.
In Section 1, Chapter 1 introduces the background and objectives. The main points include the importance of identifying major factors contributing to China’s agricultural growth in latest decades; significance of improving efficiency of agricultural production, in terms of sufficient and safe supply of agricultural products, due to the largest population and limited farmland, water, etc; the urgency of studying farmers’ application of fertilizer and pesticides, in the dual impacts of agricultural chemicals on both supported agro-growth and menacing environmental and food safety simultaneously.
Being the principal part of this thesis, Section 2 is composed by series empirical analyses.
Chapter 2 conducts a factor analysis of Chinese agriculture development in 1983-2006, from the perspectives of inputs change, institutional transition and technological progress. The result of C-D production function shows that increasing inputs of chemical fertilizer is the most important factor, following by technical progress, increased fixed assets, fiscal supports and transfer of agro-labors. In Chapter 3 and 4, production efficiency of wheat and corn in Hebei Province are measured, through an input-oriented DEA model with the assumption of Variable Return to Scale (VRS). Within the sampled counties, most of the farms are measured as in the status of increasing returns to scale. Outputs slacks show that comparing with technological adjustment, much margins lie in the socio-economic optimization. Meanwhile, different form liquid inputs, larger slacks exist amongst inputs connecting with agricultural infrastructure. Furthermore, Crosstabs Analysis confirms the significantly relating returns to scale of wheat and corn; as well as technical efficiencies and relating returns to scale within both wheat and corn; corn is more efficient than wheat production, while enlarging the farming scales is more important to the wheat. Using the similar DEA models, Chapter 5 develops a framework on agricultural production efficiency of individual farms. The data source is a survey to 99 household farms of Hebei province, conducted by the authors.
Similarly, most of the inefficient farms can improve efficiency through enlarging their farming scales; ratios of net profit has a larger average slack to be increased than the absolute value;
irrigation costs can be saved with the largest margin; large slacks exist in fertilizer and pesticides. The empirical analyses in the second stage indicate that reducing the numbers of agro-labor improve production efficiency; the public services do not improve the efficiencies,
unless conducted together with farms’ efficient access to the credit. In succession, Chapter 6 and 7 study farmers’ behaviors and perceptions on applying agro-chemicals, including the total amounts, main components, possible consequences of over application, based on another survey of 560 household farms in six provincial regions of eastern China. Through the adoption of multivariate and binary logistic regression models, these two chapters identify the significance of enlarging farming scales, increasing farmer’s migrant employment and incomes, in terms of their appropriate behaviors and perceptions on using agro-chemicals.
As the last section, in light of the proceeding findings and reviews of current status and prior literature, Chapter 8 raises comprehensive policy recommendations, concerning enlarging the farming scales, improving the contribution of agro-technology, promoting migrant employment of rural labors, channeling more funds to agriculture, increasing the value-added of agro-products, and strengthening public education and management on safe agro-production.
Keywords: C-D Production Function, Chinese Agriculture, DEA, Factor analysis, Production Efficiency
i
CONTENTS
Chapter 1 Introduction ... 1
1.1 Study background... 1
1.2 Study objectives ... 3
1.3 Organization of this thesis ... 3
Chapter 2 Factor Analysis of Gross Agricultural Development ... 7
2.1 Introduction ... 7
2.2 Development of Chinese agriculture and previous studies ... 8
2.3 Methods and data ... 12
2.3.1 Theoretical model of production function ... 12
2.3.2 Indicators and data ... 13
2.4 Results and discussion of the model ... 15
2.4.1 Results of the estimation ... 15
2.4.2 Contribution of each factor ... 16
2.5 Conclusions and recommendations ... 18
2.5.1 Major conclusions ... 18
2.5.2 Major recommendations ... 19
2.5.3 Open research topics ... 20
Chapter 3 Wheat Production Efficiency in 36 Counties of Hebei Province ... 21
3.1 Introduction ... 21
3.2 Theoretical framework of DEA ... 23
3.2.1 Basic model ... 23
3.2.2 Nature of returns to scale ... 24
3.2.3 Radial and slacks adjustment ... 24
ii
3.3 Model and data ... 26
3.3.1 Literature review ... 26
3.3.2 Defining the variables ... 27
3.3.3 Sample and data ... 29
3.4 Efficiency analysis with DEA ... 29
3.4.1 Total, technical and scale efficiencies ... 29
3.4.2 Slack analysis of the outputs ... 30
3.4.3 Radial and slack analysis of the inputs ... 31
3.5 Concluding remarks ... 32
Chapter 4 Corn Production Efficiency in 44 Counties of Hebei Province ... 33
4.1 Introduction ... 33
4.2 Variables and data specification ... 33
4.2.1 Defining the variables ... 33
4.2.2 Sample and data ... 35
4.3 Efficiency analysis with DEA ... 35
4.3.1 Total, technical and scale efficiency ... 35
4.3.2 Slack and radial analysis ... 36
4.3.3 Comparison of efficient and inefficient counties ... 39
4.4 Comparison of production efficiency between corn and wheat ... 40
4.5 Conclusions and recommendations ... 42
4.5.1 Main conclusions ... 42
4.5.2 Policy recommendations ... 42
Chapter 5 Agricultural Production Efficiency of 99 Household Farms from Hebei Province ... 44
5.1 Introduction ... 44
5.2 Variables and data specification ... 45
iii
5.2.1 Data and software ... 45
5.2.2 Defining the variables ... 46
5.3 Efficiency analysis with DEA ... 48
5.3.1 Total, technical and scale efficiencies ... 48
5.3.2 Slack analysis of the outputs ... 49
5.3.3 Radial and slack analysis of the inputs ... 49
5.4 Effects of the determinants on technical efficiencies ... 50
5.4.1 Ordinal logistic regression ... 50
5.4.2 Model selection ... 50
5.4.3 Results and discussion ... 53
5.4.4 Discussion on the other determinants ... 55
5.5 Conclusions and recommendations ... 56
5.5.1 Main conclusions ... 56
5.5.2 Policy recommendations ... 57
5.5.3 Open research topics ... 58
Chapter 6 Farmers’ Application of Fertilizers from Six Eastern Provincial-level Regions ... 59
6.1 Introduction ... 59
6.2 The field survey ... 61
6.2.1 Sample and method ... 61
6.2.2 Theoretical model ... 62
6.2.3 Demographic characteristics ... 63
6.2.4 Behaviors on fertilizer application ... 66
6.2.5 Perceptions on fertilizer application ... 68
6.3 Analysis on the behavior determinants ... 70
6.3.1 Calculating the Fertilization Coefficient ... 70
iv
6.3.2 On the total amounts of fertilizer ... 71
6.3.3 On the application of organic fertilizer ... 73
6.4 Conclusions and Recommendations ... 74
6.4.1 Major conclusions ... 74
6.4.2 Policy recommendations ... 75
6.4.3 Open research topics ... 76
Chapter 7 Farmers’ Application of Pesticides from Six Eastern Provincial-level Regions ... 77
7.1 Introduction ... 77
7.2 The field survey ... 78
7.2.1 Theoretical model ... 78
7.2.2 Demographic characteristics ... 79
7.2.3 Behaviors on pesticide application ... 82
7.2.4 Perceptions on pesticide application ... 83
7.3 Analysis on the behavior determinants ... 84
7.3.1 On the total amount of pesticides ... 84
7.3.2 On the toxic pesticide application ... 86
7.3.3 On the adoption of biological pest-controls ... 88
7.4 Conclusions and Recommendations ... 89
7.4.1 Major conclusions ... 89
7.4.2 Policy recommendations ... 90
7.4.3 Open research topics ... 90
Chapter 8 Conclusions and Recommendations ... 91
8.1 Review of the contents ... 91
8.2 Major conclusions ... 92
8.3 Policy recommendations ... 93
v
8.3.1 Enlarging the managerial scales of agriculture ... 93
8.3.2 Improving the contribution of agro-technologies ... 94
8.3.3 Promoting migrant employment of rural labors ... 95
8.3.4 Channeling more fiscal and social funds to agriculture ... 96
8.3.5 Increasing the value-added of agricultural products ... 98
8.3.6 Strengthening social management and education on safe agro-production ... 99
References ... 100
List of Related Publications ... 108
List of Related Presentations... 109
Acknowledgments ... 110
Appendix ... 112
I. Questionnaire on the agricultural production efficiency of farms ... 112
II. Questionnaire on farmers’ behaviors and perceptions on agricultural pollution ... 118
vi
LIST OF FIGURES
Fig.1-1 Share of agriculture in 1980-2009 ... 2
Fig.1-2 Background and objectives ... 3
Fig.1-3 Flow chart of the whole dissertation ... 6
Fig.2-1 Annual growth rate of annual agricultural output in 1983-2006 ... 8
Fig. 3-1 Location of Hebei Province ... 22
Fig. 3-2 Efficiency measurement and input slacks ... 25
Fig. 3-3 Efficiency measurement and output slacks ... 26
Fig. 4-1 Percentage of input slack ... 37
Fig. 4-2 Percentage of input radial ... 39
Fig. 6-1 Location of the sampled areas ... 62
Fig. 6-2 Mechanism of modeling farmers’ use of fertilizer ... 63
Fig. 7-1 Mechanism of modeling farmers’ use of pesticides ... 79
vii
LIST OF TABLES
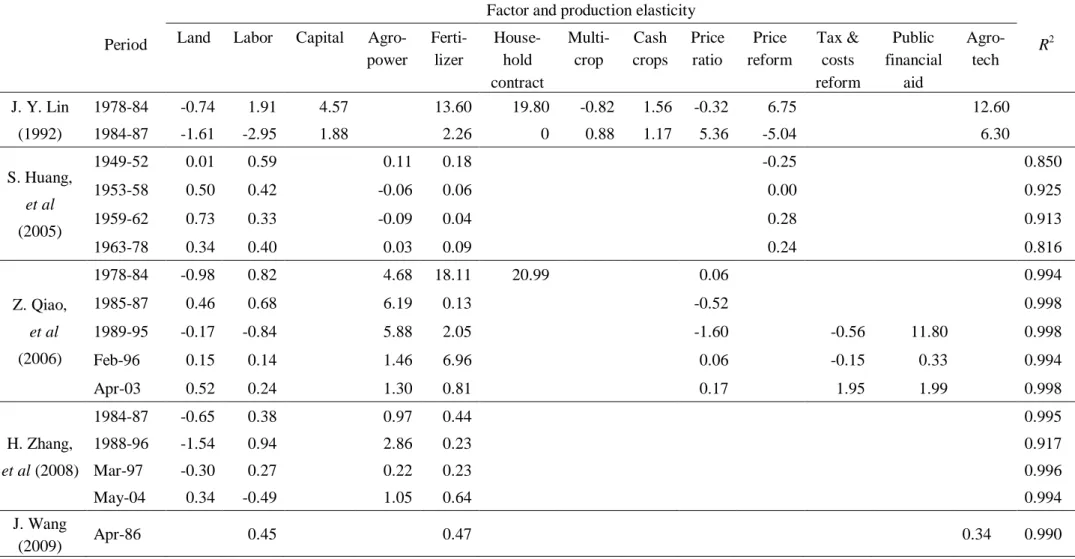
Table 2-1 Estimation on the factors of China's agricultural development in previous studies ... 11
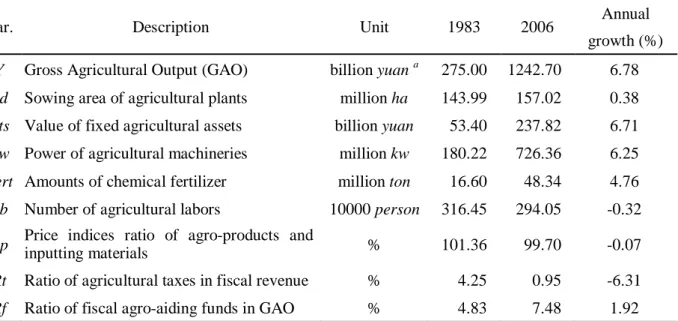
Table 2-2 Summary statistics of Chinese agricultural development in 1983-2006 ... 13
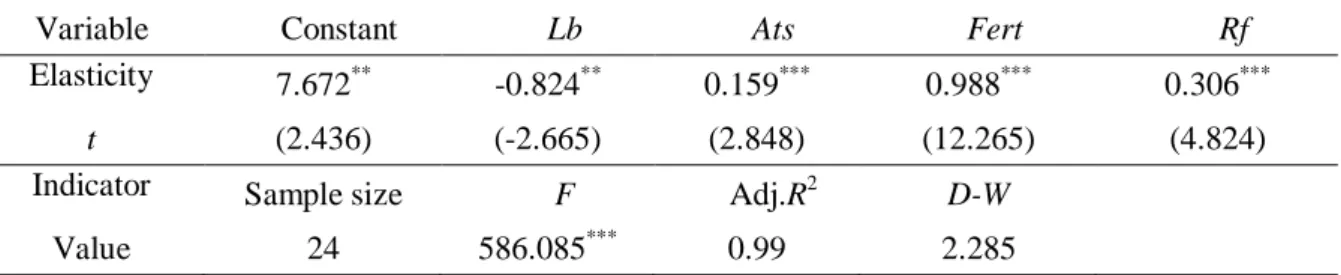
Table 2-3 Estimation of the production elasticity ... 16
Table 2-4 Contribution of each factor (1983-2006) ... 17
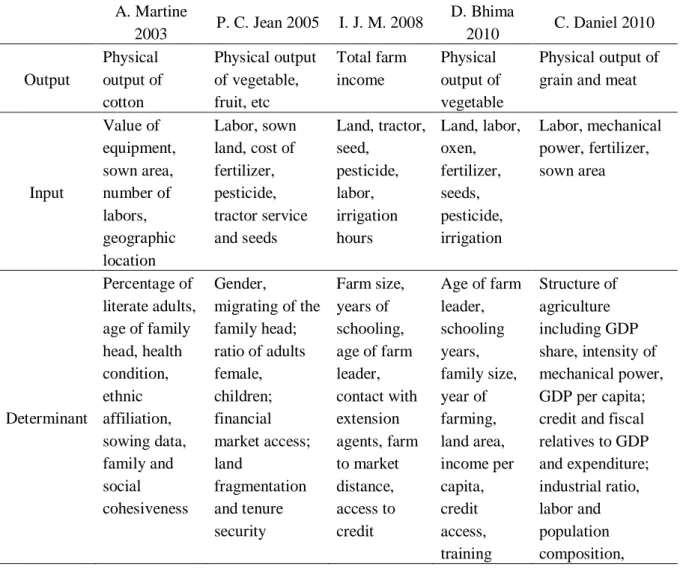
Table 3-1 Models of agricultural efficiency in several former researches ... 27
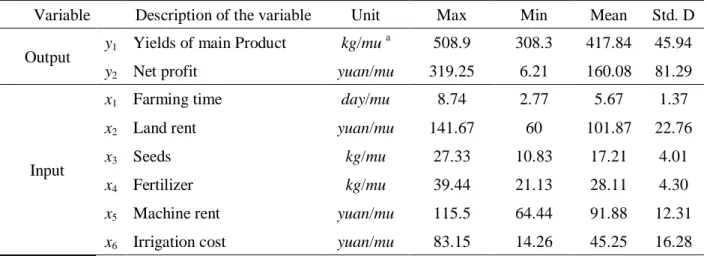
Table 3-2 Variables and the summary statistics of wheat production efficiency ... 28
Table 3-3 Summary of wheat production efficiency ... 30
Table 3-4 Slack analysis of outputs ... 31
Table 3-5 Radial and slack analysis on inputs per mu ... 31
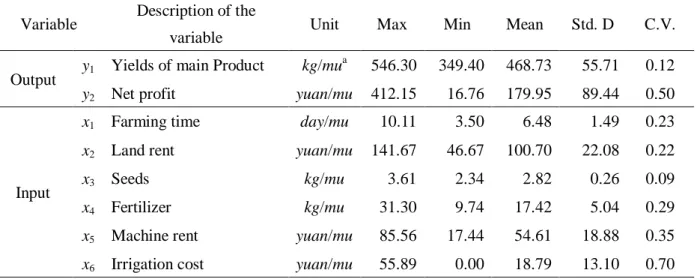
Table 4-1 Variables and the summary statistics of corn production efficiency ... 34
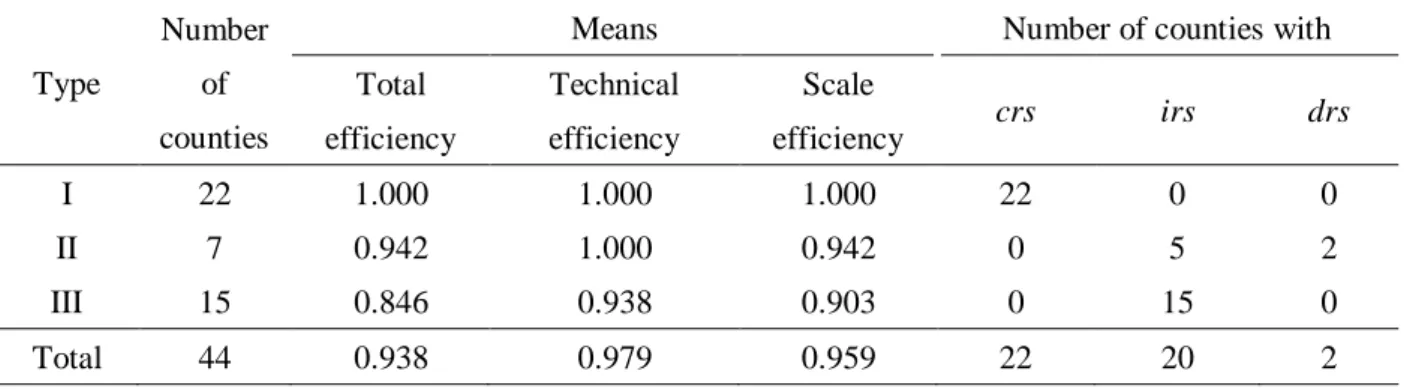
Table 4-2 Summary of corn production efficiency ... 36
Table 4-3 Slack and radial movements per mu in counties of Type III ... 38
Table 4-4 Comparison of efficient and inefficient counties... 39
Table 4-5 Crosstabs Analysis between corn and wheat production ... 40
Table 5-1 Variables and the summary statistics of agricultural production efficiency ... 47
Table 5-2 Efficiency summary by DEA ... 48
Table 5-3 Slack analysis of outputs in farms of Type III ... 49
Table 5-4 Radial and slack analysis in farms of Type III ... 49
Table 5-5 Case processing summary statistics ... 51
viii
Table 5-6 Pearson correlations of the determinant variables ... 52
Table 5-7 Parameter estimates of ordinal logistic regression ... 53
Table 5-8 Descriptive comparison of farms in different groups ... 54
Table 6-1 Demographic characteristics of the sampled farms applied fertilizer ... 65
Table 6-2 Application of fertilizer in the sampled farms ... 67
Table 6-3 Application of fertilizer in each agricultural plant ... 67
Table 6-4 Perceptions concerning fertilizer application ... 69
Table 6-5 Average amounts of fertilizer applied to each ago-product in different regions... 70
Table 6-6 Summary statistics of FC in different groups ... 71
Table 6-7 Binary logistic regression on FC of different groups ... 72
Table 6-8 Binary logistic regression on application of organic fertilizer ... 73
Table 7-1 Demographic characteristics of the sampled farms applied pesticides ... 81
Table 7-2 Application of pesticides in the sampled farms ... 82
Table 7-3 Application of pesticides in each agricultural product ... 83
Table 7-4 Perceptions concerning pesticide application ... 85
Table 7-5 Statistics of the significant determinants on total pesticides used per mu ... 84
Table 7-6 Binary logistic regression on whether toxic pesticides used ... 88
Table 7-7 Binary logistic regression on implementation of biological pest-control ... 89
1
Chapter 1 Introduction
1.1 Study background
On April 28, 2011, China National Bureau of Statistics released the Billiton of 6th National Census, according to which the total population of China has exceeded 1.37 billion in 2010. Being a country embracing the largest population, China highly needs the sufficient and safe supply of agricultural products, especially the grains. In recent years, Chinese government has adopted drastic innovations on agricultural institutions, including waved off the agro-taxation, increased the subsidies directly to grain-growing farmers, etc. Until 2009, the fiscal expenditure for agriculture, forestry and water conservancy amounts to 672.04 billion yuan, accounting for 8.81 percent in national public expenditure (CSY, 2010).
Meanwhile, the total area of arable land has dropped from 130.04 million ha in 1999 to 121.72 million ha in end of 2008 (CSY, 2010). In 2010, arable land per capita in China was 0.092 ha, only 40 percent of global mean (SCC, 2011). Since early 1980s, with the process of Reforms and Opening-up, the number of agro-labors has been decreasing, thanks to the continuous shift of surplus labors to the urban areas and the other sectors.
As the result, percentage of agro-labor in total labors dropped from 68.70 percent in 1980 to 38.10 percent in 2009. Nevertheless, comparing with the 10.35 percentage of agriculture in national GDP, surplus labors still exist in agriculture (CSY, 2010).
Observing from the GDP per capita of the three strata of industries, value of primary industry (agriculture) was 11860 yuan, merely 16.31, 21.37 and 27.16 percent of the counterpart in secondary, tertiary industry and the total economy, respectively (Fig.1-1).
Considering the large population, especially the surplus labors hence relative low GDP per capita in agriculture and the limited or even diminishing arable land, it is of great importance to identify the significant determinants of agricultural development in latest decades. Furthermore, the measurement and hence improvement of agricultural production efficiency is essential to the whole economy, in terms of supplying enough food stuff and production materials. In addition to the macro-analysis of national and regional areas, micro-analyses are necessary from the perspective of individual household farms, which are the overwhelming production units in Chinese agriculture.
2
Fig.1-1 Share of agriculture in 1980-2009 (% and thousand yuan) Source: China Statistical Yearbook, 2010
At the same time, the application of chemical fertilizers supported agro-growth in the first place (J. Y. Lin, 1992; D. Li, et al 2011b), and agro-pollution has become the first source of water pollution, due to over use of fertilizer and pesticides (CMEP, 2010).
Simultaneously, the improper application of fertilizers and pesticides constitute major menaces to food safety (EB, 2010). Safe food apply originated from proper behaviors of agricultural production are the public appeals of both at home and abroad. In latest decades, especially after the entry of WTO in 2001, agricultural products are becoming the important goods for exportation. In 2000-2009, the value of exported agro-products has increased from 15.70 billion USD to 39.63 billion USD, maintained an annual growth rate of 10.84 percent (CMA, 2010). The high-quality exported agro-products are beneficial for improving the competitiveness of China in international market and thus farmers’ incomes.
Therefore, it is necessary to study the application of agricultural chemicals of fertilizer and pesticides, in terms of their behaviors and perceptions. At present, as household farms are the overwhelming managing units of agricultural production, concerning studies should be conducted from the micro perspectives of the individual farms. Meanwhile, the impacts of significant factors to farms’ behaviors should be measured through the construction of a variety of variables on the possible social and natural determinants.
0 10 20 30 40 50 60 70 80
1980 1981 1982 1983 1984 1985 1986 1987 1988 1989 1990 1991 1992 1993 1994 1995 1996 1997 1998 1999 2000 2001 2002 2003 2004 2005 2006 2007 2008 2009
GDP % of primary industrty
Employment % of primary industrty Total GDP per capita
GDP per capita of primary industry GDP per capita of secondary industry GDP per capita of tertiary industry
Chapter 1 Introduction
3
Fig.1-2 Background and objectives 1.2 Study objectives
According to the background analyzed above, the study aims to analyze the impacts of component factors in gross agricultural development, efficient production of major agro-products and individual farms, and identify countermeasures to improve agricultural productivity, with sufficient, safe supply of agro-products; rational, efficient and proper application of production factors, and sustainable, friendly effects to the environment.
Specifically, as shown in Fig.1-2, the main objectives include: (1) identifying the significant factors of agro-development in latest decades; (2) measuring the traits of production efficiency of both staple grain crops and individual farms; (3) specifying the significant determinants affecting farms’ production efficiency; (4) capturing farmers’
behaviors and perceptions of using fertilizer and pesticides, and the significant determinants. Based on the findings of these analyses, conclusions will be drawn, following by policy recommendations.
1.3 Organization of this thesis
Based on the study background and objectives outlined in Chapter 1, the remaining chapters are to be organized as follows (Fig.1-3).
4
Chapter 2 conducts a factor analysis of Chinese agricultural development after 1983, based on the time-series data issued by the government, and the main model is Cobb-Douglas production function. The application of chemical fertilizer is measured as the most important factor. As the second factor, technical progress promotes agricultural development in considerable degree, while the contribution rate from institutional transition is comparatively low. Finally, a variety of suggestions are made on the topics such as safe application of chemical fertilizer, popularization of agro-tech, the increase of agro-capital, reduction of agro-labor (D. Li, et al 2011b).
In Chapter 3, a framework on wheat production efficiency including 2 outputs and 7 inputs is developed, adopting an input-oriented DEA model with the assumption of VRS. The data source is the agricultural product survey, conducted by Price and Cost Inspection Bureau of Hebei in 2008, with 36 counties sampled as the Decision Making Units. From the outputs of DEAP 2.1, for most of these counties, production efficiency can still be improved through reducing some of the inputs, in addition to enlarging farm scales. Slack analysis of the outputs shows that comparing with technical improvement, much more margin lies in the socio-economic optimization. Meanwhile, slack analysis of inputs indicates that the inputs can be saved with 19 percent; fertilizer amount is the first constraint input, while machine rent is the least. Based on these findings, policy implications are put forward, concerning the circulation of land, strengthening the construction of public agricultural facilities, and deepening the institutional reforms to promote extension of agricultural technologies (D. Li, et al 2011a).
With the same database and DEA model, production efficiency of corn is measured in 44 counties of Hebei Province Chapter 4. Furthermore, production efficiency in corn and wheat are compared with Crosstabs Analysis. Finally, policy implications are put forward, concerning the adjustment of farming scales, marketing facilitation thus improve the added value, constructing the infrastructure and mechanization (D. Li, et al 2011c).
In Chapter 5, agricultural production efficiency from the perspective of individual farms, using another input-oriented DEA framework with 2 outputs and 6 inputs. The data source is a survey to 99 household farms of Hebei province, China, conducted by the authors in 2010. In the second stage, effects of a variety of social and natural determinants are assessed, with the adoption of an Ordinal Logistic Regression model.
Based on the empirical findings, policy recommendations are put forward (D. Li, et al 2012a).
Chapter 6 studies farmers’ application of fertilizers, based on a survey to 560 household farms in six provincial regions of eastern China. The main contends include total amounts, main components of chemical fertilizers and the use of organic fertilizers.
Chapter 1 Introduction
5
Then, it summarizes the farmers’ perceptions, ranging from fertilizer choosing, field application, disposal of the used packages and awareness on the possible consequences of over fertilization. Nine indicators are adopted as the predictors, including information on the householders, land-using and planting structure, household income and geographical location. Fertilization Coefficient is formulated to isolate effects of farms’ geographical location and planting structure, hence capture farmers’ propensities on fertilizing. Through the adoption of binary logistic regression models, significant determinants are identified behind farmers’ behaviors. Finally, policy recommendations are put forward, from increasing fertilization efficiency of both chemical and organic fertilizer, to improving farmers’ capability and awareness of scientific fertilization (D. Li, et al 2012b).
Furthermore, based on the same survey, farmers’ application of pesticides is studied in of Chapter 7. The contents include amounts of chemical pesticides, use of toxic pesticides and biological pest-control methods. Meanwhile, it summarizes the farmers’
perceptions, ranging from pesticides choosing and field application to the awareness on the withdrawal period, possible consequences of overdosing and disposal of the containers. Through the adoption of multivariate OLS and logistic regression models, significant determinants affected farmers’ behaviors are identified. Finally, several policy recommendations are put forward (D. Li, et al 2012c).
Finally, after summarizing the major conclusions of the foregoing chapters, Chapter 8 puts forward a variety of policy recommendations, in respect to improve the agricultural growth and production efficiency, while maintaining the proper behaviors and perceptions on the application of fertilizers and pesticides.
6
Fig.1-3 Flow chart of the whole dissertation
7
Chapter 2 Factor Analysis of Gross Agricultural Development
2.1 Introduction
In the end of 1978, China launched Reforms and Opening-up, thus broke up the highly-planned economic institutions, and revitalized the whole economy from rural areas. Until the mid-1980s, as a prelude of the Reform and Opening-up, the Household Contract Responsibility System has been expanded in nationwide rural areas, where production teams were dissolved within 99 percent of villages and major production materials, symbolized by farmland, were divided into household farms. After the reform, farmers can keep the rest as private properties, once paid a certain amount of food or agricultural tax to the state as contracted. It released the long-term bounded farming organizations, and increased farmers motivation on agricultural productivity, hence agricultural development reached a high level within a few years. As a fundamental measurement, total grain yields amounted to 379 million tons in 1985, from 305 million tons in 1978. With this growth rate of some 25%, the problem of food security, which puzzled China for a long time, was resolved by large. In addition to benefiting national life and industrial development, it brought new opportunities to the overall economic reforms. At the same time, thanks to the effects of non-agricultural reforms, agriculture gradually developed as an industry capable of self-reliance.
By the mid-1980s, the rapid development of agriculture is realized primarily due to the powerful potential released by institutional reforms. By contrast, in subsequent periods, agriculture maintained the high-speed growth, under the progress of overall economic reforms. From 1983 to 2006, China's Gross Agricultural Output (GAO) raised from 275 billion yuan to 4242.44 billion yuan (current prices). Accounting the influences of inflation, the GAO was 1242.70 billion yuan with constant prices of 1983, an average annual growth rate of some 6.88% was maintained in this period.
As shown below, factor analysis of China's agricultural development has been conducted by J. Y. Lin (1992), J. Wang (2009) and H. Zhang (2008), and other studies.
However, these studies embrace problems as orienting on obsolete periods, focusing on specific factors of institutional factors, technological changes or changes in factor inputs.
That is, it remains a challenge to the scholars of conducting comprehensive analyze and policy recommending on the reasons of agricultural development in recent periods, with the consideration of all the factors proposed above. Therefore, this chapter aims to clarify these issues, through factor analysis of China's agricultural development from the
8
perspectives of inputs change, institutional transition and technological progress since 1983, when it began to develop as an independent industry by large. Within this macro analysis on the national time-series data, the approaches adopted are mainly production functions.
2.2 Development of Chinese agriculture and previous studies
In the study period, Chinese government esteemed rural areas as regions with great potentials to expand domestic demands, in addition to the conviction of fundamental position of agriculture in the rapid and stable economic growth. Therefore, in order to stabilize the Household Contract Responsibility System, further reforms are conducted on institutions of pricing the agricultural products, agricultural taxation, etc. In addition, to increase agricultural productivity and farmers’ incomes, more funds are inputted to the development of agricultural sciences and technology, especially the innovation and extension of advanced agricultural production materials, new breeds. Thus, modernization of agriculture has been promoted, thanks to these agriculture-beneficial policies and technological advances. However, agriculture did not develop with continuous and fast speed, and significant differences existed between the annual growth rates. In particular, after a minus growth rate of 4.78 percent in 1989, an upheaval of 21.83 percent showed up in 1990 (Fig. 2-1).
Fig.2-1 Annual growth rate of annual agricultural output in 1983-2006 (unit: %)
Source: Summary of Chinese Agricultural Statistics
On the lubricating growth of GAO mixed with untrimmed increases and even decreases, many scholars have explored the causes from different perspectives. J. Y. Lin (1992) analyzed the output elasticity of each factor in agricultural development from 1978 to 1984, used province-level panel data. According to the conclusion, as the most important factors in the first half period, rural economic institutional reforms from production teams to the Household Contract Responsibility System supported the increase
-10 -5 0 5 10 15 20 25
1983 1984 1985 1986 1987 1988 1989 1990 1991 1992 1993 1994 1995 1996 1997 1998 1999 2000 2001 2002 2003 2004 2005 2006
Chapter 2 Factor Analysis of Gross Agricultural Development
9
of agricultural production with an important role of 19.80 percent. Meanwhile, significance of institutional reforms diminished sharply in the latter half of period. In succession, fertilizer application and technological progress (through the proxy variable of T) are measured as contributed greatly as well. To analyze significant factors behind development of Chinese agriculture, this study includes three factors of factor inputs, institutional changes and technological progress factor. However, as the study period is up to 1987, it necessary to conduct factor analyze of China's agricultural development within the following 20 years.
S. Huang et al (2005) conducted empirical analysis on the impact of Changes in land ownership system1
Based on the panel data of provincial-level regions, H. Zhang et al (2008) analyzed the development of Chinese agriculture in 1949-2005. The result indicated that the physical inputs, particularly fertilizers and machinery, had a high contribution to the total agricultural output, farmland and labor contributed with lower or even negative ratios and large fluctuates. In this comprehensive empirical study, only the input elements were incorporated as determinants to agricultural development, while variables of technological progress and institutional change were excluded. In addition, Wang (2009) studied the relationship between technological progress and economic development in agriculture, with an extended Cobb-Douglas production function. It
to agricultural growth in 1949-1978, from the founding of People’s Republic of China's to the Reforms and Opening-up. Conclusions of this study show the different effects of each factor to gross outputs of agriculture, in different stages of land ownership. This research has a long but demoded study period, and did not include the variable of technological progress. Aiming at understanding impacts of agricultural innovation system, Z. Qiao, et al (2006) analyzed the significant factors of Chinese agricultural development, in the five-divided period of 1978-2004, based on the model specified by Z. Griliches (1963). However, insignificant variables were included in some models for different periods such as labor and power in 1978-1984 and 1996-2002.
Meanwhile, the study periods was divided into so many stages, especially included a two-year stage of 2003-2004, which reduced the accuracy of statistical analyses with models of multivariate regression, etc, thus blocked the accurate measurement of the whole study period from 1983 to 2006. In addition, this study did not include the contribution of technological progress.
1 In the study period of this paper, land ownership in rural China passed through the stages of private ownership (1949-52), transition from private to collective ownership (1953-58), collective ownership through the people's commune (1959-62), and collective ownership of three subjects (people's commune, production brigade, production team), with the basis of production team (1963-78).
10
concluded that agricultural development increased the funds inputted on agricultural technical progress, while the latter needs to feed back the former mainly through the scientific conversion of concerning production elements and their organizations.
Although this study oriented to a long period of 1986-2004, impacts of institutional change were not incorporated into the model (Table 2-1).
In previous studies, the development of Chinese agriculture was primarily attributed to three kinds of factors. The elemental inputs are the quantity of farmland, labor and agricultural assets, in addition to the liquid capitals of chemical fertilizers, etc.
Institutional transitions refer to the changes of land ownership, agricultural price system, rural finance taxing forms, etc. Technology progresses include advances in farming methods related to increase production capacity of agricultural machinery and chemical fertilizers, and improved varieties of agricultural products. However, as noted above, there is still a blank topic of studying the period since 1983, when agriculture began to develop as an independent industry, with the adoption of the aforementioned factors to an integrated model, thus measure the respective impacts the development of Chinese agriculture. Meanwhile, further explorations are necessary in terms of the most appropriate indicators models to reflect impacts from the capitals, land or the other factors.
Therefore, with such awareness, based on data in 1983-2006 and production functions, after thoroughly examine the significance of each factor, this chapter selects a variety of indices with availability of credible data, to demonstrate the impact of agricultural development. In detail, taking the 24-year period as a whole1, the introduced time series data covers all the three types of variables as summarized above, i.e., inputs changes, technological progress and institutional transitions.
1 To illustrate the impact of institutional changes, the author introduced several dummy variables, and estimated the study period in different phases. However, the results did not show significant trend in terms of institutional changes, due to the short periods, thus statistical insignificance of each model.
11
Table 2-1 Estimation on the factors of China's agricultural development in previous studies
Period
Factor and production elasticity
R2 Land Labor Capital Agro-
power
Ferti- lizer
House- hold contract
Multi- crop
Cash crops
Price ratio
Price reform
Tax &
costs reform
Public financial
aid
Agro- tech J. Y. Lin
(1992)
1978-84 -0.74 1.91 4.57 13.60 19.80 -0.82 1.56 -0.32 6.75 12.60
1984-87 -1.61 -2.95 1.88 2.26 0 0.88 1.17 5.36 -5.04 6.30
S. Huang, et al (2005)
1949-52 0.01 0.59 0.11 0.18 -0.25 0.850
1953-58 0.50 0.42 -0.06 0.06 0.00 0.925
1959-62 0.73 0.33 -0.09 0.04 0.28 0.913
1963-78 0.34 0.40 0.03 0.09 0.24 0.816
Z. Qiao, et al (2006)
1978-84 -0.98 0.82 4.68 18.11 20.99 0.06 0.994
1985-87 0.46 0.68 6.19 0.13 -0.52 0.998
1989-95 -0.17 -0.84 5.88 2.05 -1.60 -0.56 11.80 0.998
Feb-96 0.15 0.14 1.46 6.96 0.06 -0.15 0.33 0.994
Apr-03 0.52 0.24 1.30 0.81 0.17 1.95 1.99 0.998
H. Zhang, et al (2008)
1984-87 -0.65 0.38 0.97 0.44 0.995
1988-96 -1.54 0.94 2.86 0.23 0.917
Mar-97 -0.30 0.27 0.22 0.23 0.996
May-04 0.34 -0.49 1.05 0.64 0.994
J. Wang
(2009) Apr-86 0.45 0.47 0.34 0.990
Note: The Agro-power is the sum of the energy used in agriculture; price ratio is the ratio of price index of agricultural products and production materials; price reform is represented by ratio of product prices determined by the government; tax & cost reform is represented by the proportion of agricultural tax in total agricultural production; financial support refers to the proportion of fiscal inputs to agriculture in total public budgets
12
2.3 Methods and data
2.3.1 Theoretical model of production function
In studies about sources of economic development, Cobb-Douglas production functions1
∏
== N
n n
t n
x e
Y
1 0
θ β
β
are widely used to demonstrate the relationships between economic growth and inputting factors. As the original theoretical model, Cobb-Douglas production function is represented by the following formula:
(2-1)
Here, xn represents the inputting factors of capital, labor, etc, and βn is the elasticity of each factor; β0 includes all the other factors thus be called as Total Factor Productivity (TFP); t is a proxy variable for the time trend variable of technological progress; β0, βn and θ are unknown parameters to be estimated.
Taking the natural logarithm on both sides of Eq.2-1, and calculating the partial differential of lnY with t:
θ
∂ =
∂ t
Y
ln (2-2) where θ represents the rate of technological progress (S. Sakano, et al 2004). Hence, the Cobb-Douglas specification of production function implicitly assumes the technological change effect is constant to the output Y (T. J. Coelli, et al 2005). Meanwhile, as the Cobb-Douglas specification of production function is homothetic, thus assuming that the substitute elasticity between different factors constant to be 12
In theory, using the model described above, we can compute the contribution of technological progress over time. However, as the rate of technological change is not
(Y. Kuroda, 2005).
1 In the studies of relationships between economic growth and inputting factors, in addition to production function, cost function and profit function are often used as well. Nevertheless, independent price variables are needed in both of the latter two functions. In addition, cross-sectional data were used in many prior studies on cost and profit functions (Y. Kuroda 2005). In China, only part of price data of production factors has been published. Therefore, this paper conducts factor analyze of Chinese agricultural development with the adoption of production function.
2 Despite the single homogeneous assumption of substitutability between the elements, similar homogeneity (i.e., constant returns to scale) is not assumed for the returns to scale, which is determined by the parameters to be estimated. For example, if Σβn= 1 means constant returns to scale; Σβn<1 indicates the diminishing returns to scale; Σβn>1 denotes increasing returns to scale.
Chapter 2 Factor Analysis of Gross Agricultural Development
13
constant every year, there highly possible difficulties to observe the contribution over time. Therefore, another specification of production function is needed as:
∏
== N
n n
x n
Y
1 0
β β (2-3) Here, contribution of technological progress can be calculated with:
∑
=−
= N
n n
Tech M
M
1
1 (2-4) That is, contribution of technological progress (MTech) is obtained as the residual of subtracting the contribution of other factors (Mn) from the growth rate of Y (K. Ogawa, et al 2002; S. Sakano, et al 2004). This thus provides another basic method to estimate the contribution of technological progress, based on the Cobb-Douglas production function (S. Inamoto, 1969). In this study, after compare results of the two models, the better performed Eq.2-4 is adopted.
2.3.2 Indicators and data
In this chapter, to describe the development of Chinese agriculture and the factors over the period, indicators shown in Table 2-2 are adopted. The data sources include Bulletin of Chinese Agricultural Development (2007), and China Statistical Yearbook (relevant years), published by China's Ministry of Agriculture and State Statistical Bureau.
Considering the impacts of time trend, all the monetary values are calculated in the constant prices of 1983.
Table 2-2 Summary statistics of Chinese agricultural development in 1983-2006
Var. Description Unit 1983 2006 Annual
growth (%) Y Gross Agricultural Output (GAO) billion yuan a 275.00 1242.70 6.78 Ld Sowing area of agricultural plants million ha 143.99 157.02 0.38 Ats Value of fixed agricultural assets billion yuan 53.40 237.82 6.71 Pw Power of agricultural machineries million kw 180.22 726.36 6.25 Fert Amounts of chemical fertilizer million ton 16.60 48.34 4.76 Lb Number of agricultural labors 10000 person 316.45 294.05 -0.32 Rp Price indices ratio of agro-products and
inputting materials % 101.36 99.70 -0.07
Rt Ratio of agricultural taxes in fiscal revenue % 4.25 0.95 -6.31 Rf Ratio of fiscal agro-aiding funds in GAO % 4.83 7.48 1.92
Note: a As the prime currency unit, 7.97 yuan = 1 US$ (middle exchange rate of 2006), and all the monetary values are calculated in the constant prices of 1983
Source: Bulletin of Chinese Agricultural Development (2007); China Statistical Yearbook (relevant years)
14
In the first place, as the dependent variable, Gross Agricultural Output (Y) is the total output value of the final products of agricultural activities, including farming, forestry, animal husbandry and fishery. The gross output of each agricultural product (Yt) is obtained by multiplying the price and physical volumes of production, and then converted to the constant prices of 1983.
Due to the existence of multiple cropping in agricultural production, Sowing area of agricultural (Ld), rather than the areas of arable land, is adopted (Z. Qiao, et al 2006). In origin, labor force (Lb) is should be represented with of total working days or hours in a year, etc. However, viewing from the real status of Chinese farmers, their laboring times are difficult to be accurately measured. Meanwhile, relevant data is not found from China Statistical Yearbook, China Agricultural Yearbook, and other sources. Therefore, referring to the earlier literature of J. Y. Lin (1992), Z. Qiao, et al (2006), etc, annual number of agricultural labors (10 thousand persons per year) is adopted in this study.
Agricultural capitals are divided into fixed and liquid capitals. The value of fixed assets (Ats) is the monetary expression of objects, tools and equipments directly used upon agricultural production, borrowed or owned by farms over a relatively long period of several years. Power Agricultural machineries (Pw) is the sum of energy with machineries used in ploughing, irrigation, harvesting and transportation, etc., within the agricultural activities of farming, forestry, animal husbandry and fishery. In order to identify appropriate variables to represent the fixed capitals, Pw and Ats are incorporated into the model simultaneously. At the same time, as the most important liquid capital, Amounts of chemical fertilizer (Fert) refers to the standardized quantity of Nitrogen, Phosphorus, Potash and compound fertilizers used in agricultural production.
Here, the standardization depends on the content of nitrogen, phosphorus pentoxide, potassium, etc, in different types of fertilizers.
Meanwhile, three indicators are included to reflect the impact and effectiveness of institutional reforms in the study period, concerning agricultural commodity prices, agricultural taxation, aids and assistance to agricultural production, etc. Price indices ratio of agro-products and inputting materials (price ratio, Rp) is the ratio of price index and producer price indices for agricultural materials in each year. Series of reforms carried out in the field of agriculture, which began from institutions of commodity prices in early 1980s. Thereafter, the price system once generally controlled by the state being gradually reformed over a long period. By 2004, the fixed purchase prices are completely abolished and grain prices are began to be fully determined by the market.
Meanwhile, Ratio of agricultural taxes (Rt) is the percentage of agricultural taxes in national fiscal revenues of each year. The agro-supporting funds are mainly used to finance agricultural production, irrigation, climate forecasting, infrastructure, R&D, etc.
Chapter 2 Factor Analysis of Gross Agricultural Development
15
Ratio of fiscal agro-supporting funds (Rf) refers to the percentage of public funds within Gross Agricultural Output (GAO). Using these two indicators, we intend to evaluate the impact from reforms of agricultural taxation and fiscal institutions. Since 2000, the rural tax reforms were included to the unified reforms managed by the central government.
Until 2006, agricultural taxes were fully abolished in a nationwide scope, and subsidies supporting agricultural production began to be directly distributed to the farmers. At the same time, reform of the budgetary expenditure on agriculture finance came into force. In 2004, to balance the socio-economic development of urban and rural areas, the No.1 document issued by the top authorities proposed the key guideline of the rural policies as Giving More, Taking Less and Loosening Control, stressing that the government would increase its input to rural areas and agriculture, reduce taxes and fees collected from farmers. Meanwhile, another policy agenda was committed to transform the lack of financial input to agriculture1
2.4 Results and discussion of the model
in the same document.
2.4.1 Results of the estimation
In this study, factors analysis of agricultural is conducted through the development of an econometric model without the inclusion of time variable, based on the log-linear Cobb-Douglas production function as:
lnY=Constant+αlnLd+β1lnAts+β2lnPw+β3lnFert+γlnLb+δ1lnRp+δ2lnRt+δ3lnRf+ε (2-5) where Constant is the intercept, α, βi, γ and δi are unknown parameters to be estimated, and ε is the random item.
Although we can include all the above variables into the final model and obtain higher fitness, it is better to develop models by omitting redundant variables which hardly contribute the total fitness. In econometric models, the change of determinant coefficient R2, the change of F (F), and the probability significance of pF are referential in selecting the variables (Murase, et al 2007). After removing the insignificant variables according to the probability significance of pF obtained by the software SPSS, the combination of the explanatory variables in the final model include four significant variables as shown in Table 2-3.
1 In terms of the financial inputs to agriculture, the total sum draws much more attentions than the proportion in annual government expenditure. In latest years, the fiscal inputs to support agriculture are increasing, while the proportion in annual government expenditure even decreased. In 1983-2006, the proportion decreased from 9.43% to 7.85% (China Statistical Yearbook).
16
Table 2-3 Estimation of the production elasticity
Variable Constant Lb Ats Fert Rf
Elasticity 7.672** -0.824** 0.159*** 0.988*** 0.306***
t (2.436) (-2.665) (2.848) (12.265) (4.824)
Indicator Sample size F Adj.R2 D-W
Value 24 586.085*** 0.99 2.285
Note: ***, **and *represent statistical significance in the level of 1%, 5% and 10% respectively Software: SPSS 13.0
All the significant F and t-test in the level of 5 percent, the Adj.R2 of 0.99, and Durbin-Watson value of 2.285 indicate good statistical fitness. In addition, fixed assets, chemical fertilizers, ratio of fiscal agro-supporting funds are all estimated as with positive elasticity. Although the negative elasticity of agricultural labor is adverse to the general economic assumption, it meets with existence of over surplus numbers of labors in Chinese agricultural production. In previous studies, both J. Y. Lin (1992) and Z. Qiao, et al (2006) have measured negative elasticity of labor productivity. Therefore, this model estimates well China's agricultural and economic growth in the study period.
To analyze the causes of significant ratio of fiscal agro-supporting funds, while insignificant pricing factors, it may due to lower prices of agricultural products compared with the prices of fertilizers and other inputting industrial products, thus farmers are difficult to be positive towards agricultural productivity. In terms of the sowing area of agricultural plants, insignificance may be resulted mainly from Multicollinearity, as high relation coefficients of 0.95 and 0.87 exist between this variable and value of fixed assets and fertilizer, respectively. Meanwhile, viewing from changes of inputs over the study period, when sowing area of agricultural plants increased 9.05 percent, value of fixed assets and amount of fertilizer increased 345.38 percent and 191.26 percent, respectively. In respect to the major crops, acreage of grains and cotton declined 7.50 percent and 11 percent respectively, thanks to the increased per unit yields of 38.88 percent and 63.45 percent, the total yields eventually increased by 28.45 percent and 45.48 percent, respectively. Similarly, total yields of oil crops increased by 189.99 percent, due to the increased per unit yields of 77.12 percent. To sum up, in the study period, comparing with the physical inputs of fertilizers and fixed assets, etc, hence the increased in yield per unit, sowing area exerted slightly smaller effects, thus of which the insignificant result in the quantitative model is plausible.
2.4.2 Contribution of each factor
In the study period, although the gross agricultural output increased by 351.89
Chapter 2 Factor Analysis of Gross Agricultural Development
17
percent, number of agricultural labors decreased by 7.08 percent, from 316 million to 294 million. In addition, the value of agricultural fixed assets increased from 53.4 billion yuan to 237.8 billion yuan, amounted more than four times; the three-fold increased of fertilizers were amounted from 16.60 million tons to 48.34 million tons. Ratio of fiscal agro-supporting funds in gross agricultural output rose from 4.83 percent to 7.48 percent as well. Based on the multiplication of these changes on each factor and the corresponding elasticity, the contribution rate of agricultural growth can be assessed for each factor using percentage within total agricultural output. Furthermore, as shown in Eq.2-4, contribution of agricultural technological progress can be estimated by subtracting the contributions of the other factors (Table 2-4). In addition, as investment on agricultural R&D is already included in financial support for agriculture, the technological progress in this context means the rest part by subtracting the investment on agricultural R & D from the government.
Table 2-4 Contribution of each factor (1983-2006)
Y Lb Ats Fert Rf Tech a
Total change (%) (1) 351.89
(2) -7.08 345.38 191.26 54.87 ―
Elasticity (3) -0.82 0.16 0.99 0.31 ―
Contribution (%)* (3)×(2)/(1) 1.66 15.57 53.70 4.77 24.30
a Contribution of technological progress (Tech) is calculated based on Eq.2-4 Software: Excel 2007
According to the results of Table 2-4, within the growth rate of 351.89 percent of Gross Agricultural Production in the study period, the increased amount of fertilizers, value of fixed assets, amount of financial supports and the reduction of agricultural labor force, contributed with the share of 53.70 percent, 15.57 percent, 4.77 percent and 1.66 percent, respectively. Meanwhile, being the residual of the four variables, technological progress contributed 24.30 percent to Chinese agriculture development.
Among the factors, increase in the amount of fertilizer inputs is the most major factor, following by technological progress. These two factors accounted for 78 percent of gross agricultural output growth, constituting major causes of Chinese agricultural development over the study period.
In succession, value of fixed assets processes great increases but small elasticity, thus the contribution remained to be 15.57 percent. As a proxy of institutional changes, Ratio of fiscal agro-supporting funds in GAO shares a small contribution of 4.77 percent in the study period. In terms of the minus and small elasticity of agro-labor, a share of
18
1.66 percent is contributed due to the decreased numbers over the study period.
These results are in lines with conclusions of the prior studies. Firstly, as the basic agricultural production materials, the detected significant effects of chemical fertilizers is similar with J. Y. Lin (1992), Z. Qiao, et al (2006), Zhang, et al (2008) and many other studies. As key factor in the second place, the importance of technological progress is measured in Wang (2009) and other prior literature. As to the negative elasticity of agro-labor number, which is in line with J. Y. Lin (1992) and Z. Qiao, et al (2006), it indicates that transferring of agro-labor numbers have contributed to Chinese agricultural development. The major reasons behind include engaging in other sectors enables the farmers to obtain more funds investing on fertilizers and fixed agricultural assets. Meanwhile, the non-agricultural experiences are beneficial in improving farm management and trade of agro-products.
2.5 Conclusions and recommendations 2.5.1 Major conclusions
In this chapter, a factor analysis of Chinese agriculture development in 1983-2006 is conducted, from the perspectives of inputs change, institutional transition and technological progress. As a result, new findings did not show up in similar studies were obtained, through comprehensive perspectives, overall and long-term modeling and comparison of different models in measuring the contribution of technological advances, etc.
From the statistical significance of each factor, with increment of chemical fertilizer in the first place, fixed agricultural assets, followed by financial supports and the reduction of agricultural labor force constitute the major factors supported China's agricultural development in the study period. In previous literature, different factors were detected as the first factor in different stages, such as agricultural technology in J. Y.
Lin (1992), agricultural machinery and financial assistance in Z. Qiao, et al (2006), agricultural machinery and labor force in Zhang (2008), etc (Table 2-1). In contrast, increased input of fertilizer is measured as the most important factor for China's agricultural development in 1983-2006, with an overwhelming contribution share. In addition, as the second factor, technological progress is concluded as supported agricultural development with a considerable share of contribution. Different from the models in Z. Qiao, et al (2006) and Zhang (2008), Wang (2009) considered the significance of agricultural technology, although measure as contributed with the lowest share among three types of factors. Inaccurate measurement of the contribution of agricultural technological progress will inevitably mislead the understanding of the significant factors and thus policies recommendations of agricultural development. Finally,
Chapter 2 Factor Analysis of Gross Agricultural Development
19
although J. Y. Lin (1992) and Z. Qiao, et al (2006) have suggested that institutional changes is a key factor for China's agricultural growth since the middle of 1980s, this study shows that compared with the other factors, institutional changes holds a relatively low contribution share. It suggests that since the mid-1980s, despite the series policies in favor of agriculture, few fundamental institutional changes like household contracting system is carried out, or that the institutions are not implemented effectively.
2.5.2 Major recommendations
Based on the above conclusions, the following policy recommendations can be raised to accelerate agricultural development. First, the increased input of chemical fertilizers has contributed significantly and the amount is expected to keep increasing in future. Nevertheless, the realization of sustainable and environmentally friendly agriculture has become an important issue. Therefore, for the safe application of chemical fertilizers, the government needs to extend soil surveying techniques, and promote the proper classification and appropriate amounts of fertilizers. Thereby, increase agricultural productivity while savings fertilizer costs and protecting the environment.
Meanwhile, as another important factor, advances in agricultural technology should be accelerated three perspectives of R&D, extension and funds. At present, although agricultural technology has developed rapidly in China, problems still remain in transferring and spreading the techniques to the fields. To analyze the causes, the overwhelming ratio of household management, thus the small sizes of farmland in agriculture can be attributed. The individual farms are limited in willingness and ability to introduce new agricultural technologies. In the governmental institutions specializing in extending agricultural technologies, irrespective connection of staffs’ incomes and their achievements in extending agricultural technology, thus lack of initiatives can be pointed out as another reason. Thus, in addition to enlarging the managerial scales though encouraging the transfer of farmland use rights, marketing reforms upon the extending institutions of agricultural technology, especially from the grassroots, constitutes an urgent measure simultaneously.
At the same time, there are countermeasures needed to serve agricultural labors, number of which is estimated with a significant but minus production elasticity above.
To reduce the number of agricultural labors, further endeavors are necessary to strengthen the non-agricultural vocational training of rural labors by the Sunshine Project1
1 Sunlight Project is a series of technical and vocational training programs to the rural labors, carried out by the Chinese government since 2004. The Project aims to improve quality and skills of rural labors, thus
, accelerating the reform of the family registration system, so as to shift surplus
20
labors to both the urban areas and local non-agricultural sectors.
In addition, as an important factor of institutional change, fiscal agro-supporting funds needs to be increased. Despite the relative low capital elasticity, the increase of fiscal agro-supporting funds is highly beneficial to increase the value of fixed assets and the promotion of agricultural technology advances. Thus, to deepen the reforms of the financial budget on agriculture and transform the lack of fiscal inputs on agricultural, it necessary to ensure sources of funds channeled to agriculture, from a series of sources including governmental departments and financial institutions. Specifically, the main roles of government include the investment on agricultural infrastructure construction, subsidies on the purchase of agricultural machinery and good seeds. Meanwhile, financial institutions are expected to create preferential prerequisites to provide more loans to farmers.
2.5.3 Open research topics
In recent years, with China's rapid economic development, agricultural inputs are being increased, and the extension of agricultural technology is being enhanced. In addition, the overall abolition of agricultural taxes, and direct aid to agricultural production, etc, a series of Agro-supporting policies was carried out by 2006. Therefore, although this study could not fully grasp impact of these policies, further studies are necessary to assess China's overall agricultural growth factors, using annual data since 2007.
promote their employment in rural non-agricultural sectors and urban areas.