DOI: http://doi.org/10.14947/psychono.38.3
Predicting sustained performance over a short time
Kenji Yamauchi
a,*, Ken Kihara
band Jun I. Kawahara
aaHokkaido University,
bNational Institute of Advanced Industrial Science and Technology
Effort is required to sustain attention for a long period of time. A continuous performance task is a method for measuring sustained attention that requires participants to respond to frequently presented non-targets but withhold their responses to rare targets. The failure to respond to a target is considered an attentional lapse, and this is corre-lated with attentional fluctuation, i.e., the variance in response times to non-targets. Although the duration of this task is traditionally about 10 min, a shorter task would reduce participants’ loads and enable more widespread use of the procedure. To this end, we used a briefer continuous performance task to examine whether individual perfor-mance in the first 2 min predicted perforperfor-mance on the entire 8-min task. The results demonstrated that attentional fluctuation and lapses in the first 2 min were highly positively correlated with those during the entire 8 min. These findings suggest that the temporal characteristics of individual sustained attention are predictable from a brief mea-surement requiring only a few minutes.
Keywords: sustained attention, continuous performance task, vigilance, performance consistency
Introduction
Attention plays a major role in a wide range of adaptive be-haviors, and the maintenance of highly focused attention for an extended period of time contributes to successful outcomes in daily life (Risko, Anderson, Sarwal, Engelhardt, & King-stone, 2012). Researchers have developed various procedures to measure sustained attention. One of the most commonly used is the Sustained Attention to Response Task (SART; Rob-ertson, Manly, Andrade, Baddeley, & Yiend, 1997), in which participants are required to respond to frequently presented non-targets by pressing a key, but to withhold their responses to rare targets.
Such behavioral paradigms for measuring sustained atten-tion have been updated and improved since the tradiatten-tional version of vigilance tasks, in which participants monitored the search display for an extended period to detect rare and inter-mittent targets (e.g., Davies & Parasuraman, 1982), was origi-nally developed. This type of task inherently contains a draw-back in that only a few responses are gained at the cost of long
duration testing, and moment-to-moment fluctuations in re-sponse times could not be obtained to overcome the difficulty. Robertson et al. (1997) developed the SART by requiring par-ticipants to sustain a higher level of continuous attention, to gain a large amount of continuous data as responses via key presses to frequent non-targets so that participants needed to withhold responses from the infrequent targets, with the result that task duration was shortened. A new type of SART has been proposed by Rosenberg, Noonan, DeGuits, and Ester-man (2013) as the gradual-onset continuous perforEster-mance task (gradCPT), in which items in the sequential stimulus presen-tation gradually change from one to another using linear pix-el-by-pixel interpolation to avoid an abrupt onset that may in-terfere with the observer’s attentional state (e.g., Yantis & Jonides, 1984). Although the gradCPT requires continuous and endogenous monitoring of subtle changes in stimuli with-out relying on transient abrupt onset cues that may exoge-nously capture attention, the gradCPT serves as a more sensi-tive measure of vigilance and lapse of attention relasensi-tive to those of the SART.
Inhibition errors to rare targets (commission errors) are tra-ditionally used as an index for a lapse in sustained attention (e.g., Christoff, Gordon, Smallwood, Smith, & Schooler, 2009; Robertson et al., 1997; Smallwood, McSpadden, & Schooler, Copyright 2019. The Japanese Psychonomic Society. All rights reserved. * Corresponding author. Hokkaido University, N10 W7,
Kita, Sapporo, Hokkaido 060–0809, Japan. E-mail: kjyamci [email protected]
2008). However, Rosenberg et al. (2013) showed that a higher response time variability could lead to attentional lapses (i.e., commission errors). They defined two bidirectional attention-al states, such as “in the zone” and “out of the zone,” to repre-sent temporal periods in which attention was focused or defo-cused, respectively, calculated from the deviance in the response time of an individual observer. They defined the state in which variability in the response time is lower than the median as “in the zone” and the state in which variability in the response time is higher than the median as “out of the zone.” According to these definitions, commission errors oc-cur infrequently during the in-the-zone state, whereas com-mission error occurs frequently during the out-of-the-zone state. Thus, it seems reasonable to use deviance in the re-sponse times to describe temporal profiles in the state of sus-tained attention.
The variability obtained from these behavioral tasks has been validated by examining consistency across different mea-sures. Specifically, given the variability represented by individ-ual markers of sustained attention, they should correlate with scores of self-report questionnaires that reflect individual characteristics of attention in daily life, such as the Attention-Related Cognitive Errors Scale (Cheyne, Carriere, & Smilek, 2006), the Mindful Attention Awareness Scale (Brown & Ryan, 2003), the Mindful Attention Awareness Scale-Lapses Only (Carriere, Cheyne, & Smilek, 2008), and the Cognitive Failures Questionnaire (Broadbent, Cooper, FitzGerald, & Parkes, 1982). In fact, this is the case. Researchers have reported a positive correlation between the vigilance measured by the SART and self-report scores of attention failures and atten-tion-related errors obtained from those questionnaires (Cheyne et al., 2006; Smilek, Carriere, & Cheyne, 2010). These results reflect that those who reported more attentional lapses on the questionnaires made more SART commission errors. Given these consistencies, it would be helpful to use behavior-al tasks to predict and monitor the personbehavior-al characteristics or states of sustained attention.
However, traditional behavioral tasks, such as the SART and gradCPT whose duration is approximately 10 min, are subop-timal for monitoring/screening use in terms of efficiency, be-cause shorter is better for application use. In fact, it has been reported that both response time variability and commission
errors increased as time passed, indicating that sustained at-tention declined (Esterman, Regan, Liu, Turner, & DeGutis, 2014; Rosenberg et al., 2013). However, it remains unclear whether the states of sustained attention persist or vary sub-stantially during this 10-min duration because researchers have reported only the pooled indices over the duration. Thus, in the present study, we examined the consistency of the pro-file of sustained attention by correlating the propro-files of the very first portion and the remaining portion or the entire test-ing duration. Specifically, we made an a priori choice to use the first 2 min as a shorter representative sample of continu-ous performance based on the notion that briefer tests would be better for specific populations (e.g., children and patients) and that the results of overly long tests could be contaminated by fatigue. If the results of the short and longer versions were positively correlated, we could shorten the measurement to re-duce the participants’ load. This is critical to disseminate the measurements of the profile of sustained attention because an-ecdotal reports obtained from our laboratory suggest that the task load for participants under the current 10-min testing are substantial; thus, subjects seem reluctant to participate in mul-tiple tests even when testing days are separated.
Method
Observers
A total of 110 students, recruited from the subject pool of Hokkaido University, participated in exchange for monetary remuneration. All observers had normal or corrected-to-nor-mal visual acuity and color vision. All participants provided written informed consent prior to the testing.
Stimuli
Stimuli were displayed on an LCD monitor (XL2411T, BenQ, 1920×1024 pixels) controlled by a computer operating Linux, Matlab, and the Psychophysics Toolbox extensions (Brainard, 1997; Pelli, 1997; Kleiner, Brainard, & Pelli, 2007). The refresh rate of the monitor was 100 Hz. Viewing distance was 57 cm.
Twenty grayscale images subtending 7.1° in width and height were used as stimuli. They consisted of 10 mountain scenes and 10 city scenes. These stimuli were presented randomly so that the mountain images (i.e., targets) and city
images (non-targets) appeared at a rate of 10% and 90%, respectively, with no repetition of the identical stimulus on consecutive items. The image gradually transitioned from one to the next using linear pixel-by pixel interpolation, with each transition occurring over 800 ms (Figure 1). The images were presented at the center of a gray background.
Procedure
Observers conducted 600 trials of the gradCPT over 8 min. The task was to press the space key for city scenes that oc-curred in 90% of the trials, while withholding the response to mountain scenes, which occurred in 10% of the trials. Under the former condition, participants were asked to press a key as quickly and accurately as possible. Before the test trials, ob-servers were given practice trials for 2 min and were informed about the duration of the task (i.e., 8 min).
Analyses
We recorded the response times in response to the city im-ages, analyzed by the same procedure used in Esterman, Noonan, Rosenberg, & DeGuits (2013). Response time was defined as the time elapsed from the beginning of the transi-tion of each image. Therefore, a response time of 800 ms means that the response key was pressed when image n was intact and not blended with images n−1 or n+1. Response times shorter (and longer) than 800 ms indicate that the cur-rent image was transformed from image n−1 (to n+1). Thus, a response time of 640 ms indicated that the response oc-curred when 80% coherence of image n and 20% coherence
of image n−1 was on the screen. To accommodate trials in which the response time deviated substantially (i.e., when the response occurred earlier than 70% coherence of the current image n and later than 40% coherence of image n+1), we ap-plied the following algorithm (obtained, generously, from Rosenberg as a Matlab script) to the data to maximize eligible responses. Specifically, the script labeled the responses into two classes; the clearly-correct responses in which the re-sponse time fell within the range mentioned above (i.e., during the period between coherence of 70% of image n and that of 40% of image n+1) and the “gray” responses in which re-sponse time was beyond this range. Next, the script assigned the “gray” responses to an adjacent trial if no response oc-curred in one of the two adjacent (n−1 and n+1) trials. If no response was recorded in the two adjacent trials, the response was regarded to occur at the closest trial, with the exception that the assignment to the closest trial was a no-go trial. Final-ly, multiple responses were recorded for a trial, the fastest re-sponse was chosen, and the rest were discarded. Given that the frequency of such multiple responses was low (<5%), it was highly unlikely that this assignment scheme of responses on no-go trials affected the pattern of the results.
Two types of errors were encountered in the present study. We defined the errors made in trials in which observers failed to inhibit responses to a nontarget, such as mountain scenes, which they should have had ignored as commission errors (i.e., false alarms). The proportion of commission errors is an index of attentional lapses, and is used to calculate the com-mission error rates. Similarly, we defined the errors when ob-Figure 1. Schematics of stimulus display for the gradual-onset continuous performance task (gradCPT). Scenes changed
gradually from one to the next after 800 ms. Participants were instructed to respond to the city scenes and inhibit their responses to the mountain scenes.
servers failed to respond to a target, such as a city scene, as omission errors (i.e., misses), and calculated the proportion of those as the omission error rates.
We calculated the standard deviation of the response times for each observer to examine trial-to-trial fluctuations during the sustained state of attention (Figure 2). Specifically, we computed a variance time course (Rosenberg et al., 2013). Each correct trial was assigned a value corresponding to the normalized (z-score) absolute deviance of its response time from the individual observer’s mean response time. Values for the error trials (commission errors and omission errors) and correct omissions were linearly interpolated by averaging the response times of the two neighboring baseline trials. The variance time course was smoothed using a Gaussian moving-window kernel of nine trials (7.2 s) at full width at half maxi-mum. This integrated information was obtained from the sur-rounding 20 trials. To characterize each observer’s profile of temporal variability of sustained attention, the trials were la-beled with low or high response time variability periods based on the smoothed variance time course values. We referred to the duration in which response times were faster than the me-dian reference point as the in-the-zone period. Similarly, we referred to the duration in which response times were slower than the reference of the median reference as the out-of-the-zone period.
To examine the relationship between response time vari-ability and commission errors, the correlation between these
two variables was calculated. Given that response time vari-ability might be determined by the response times themselves, we also examined whether response times were correlated with response time variability and/or commission errors. Moreover, to examine the unique relationship between re-sponse time variability and commission errors, we calculated the semi-partial correlation between response time variability after controlling for response times and commission errors. (e.g., Rosenberg et al., 2013).
The first 2-min segment of performance was compared with the entire 8-min performance. We also compared the first 2 min of performance with the final 6 min to support the cor-relation between performance in the first 2 min with that dur-ing the entire 8 min, as the final 6 min did not include the first 2 min. Furthermore, to examine performance consistency and exclude the possibility of an arbitrary choice of the first 2 min, we compared performance in the first 4 min with that in the final 4 min. We also examined whether performance varied across the entire 8 min by dividing the whole task into 2-min quartiles. Response times, standard deviations in response times, and commission error rates were calculated for each quartile and analyzed.
Results
Five observers who made more than four consecutive omis-sion errors were excluded from the analyses because they did not comply with the instructions or were unable to complete Figure 2. An example of variance time course (VTC) in one participant. “In the zone” is represented by the smoothed VTC
the gradCPT properly. The mean response time was 608.92 ms, and the mean standard deviation of the response time was 140.15 ms. The mean error rates were 20.57% for commission errors and 1.95% for omission errors (Table 1). The standard deviation of the response time was positively correlated with the commission error rate (r=.71, p<.01) (Figure 3(A)). Response times were positively correlated with
response time variability (r=.30, p<.01) but not with the commission error rate (r=.07, p=.49). The semi-partial cor-relation of the standard deviation of the response time after controlling for response times with the commission error rates was also positive (r=.72, p<.01). To focus on the relationship between response time variability and commission errors, we divided the individual observer’s attentional state into in-the-Figure 3. The correlation between the standard deviation of the response time and the commission error rates. (A) The
entire 8 min. (B) The first 2 min. (C) The final 6 min. (D) The first 4 min. (E) The final 4 min. Table 1.
The mean indices (response times, standard deviation of response times, commission error rates, and omission error rates) for each situation (the entire 8 min, the first 2 min, the final 6 min, the first 4 min, and the final 4 min).
Response times (ms) Standard deviation (ms) Commission errors (%) Omission errors (%)
Entire 8 min 608.92 140.15 20.57 1.95
First 2 min 595.50 125.31 17.65 1.76
Final 6 min 613.34 141.81 21.55 2.02
First 4 min 601.82 135.05 18.79 1.85
zone or out-of-the-zone periods according to their variance time course. The commission error rates were 14.03% in the zone and 26.70% out of the zone (Figure 4(A)). The rate was significantly higher for the out-of-the-zone period than for the in-the-zone period (t(104)=9.85, p<.01, d=.96).
We also calculated the performance during the first 2 min, the final 6 min, the first 4 min, and the final 4 min and recom-puted the variance in the time course for each duration for each observer. The mean response time, standard deviation of the response time, and error rates for commission and omis-sion errors for each duration are shown in Table 1. As Figure 3 shows, the correlations between the standard deviation of the response times and the commission error rates were positive for every duration (the first 2 min, r=.57, p<.01; the final 6 min, r=.69, p<.01; the first 4 min, r=.67, p<.01; the final 4 min, r=.64, p<.01). Response times were all positively cor-related with response time variability (the first 2 min, r=.24,
p<.01; the final 6 min, r=.29, p<.01; the first 4 min, r=.30, p<.01; the final 4 min, r=.27, p<.01), whereas none of the
correlations of response times with commission error rates was significant (the first 2 min, r=.10, p=.26; the final 6 min,
r=.01, p=.32; the first 4 min, r=.06, p=.53; the final 4 min,
r=.09, p=.36). The semi-partial correlations of the standard
deviations of response time after controlling for response times with the commission error rates were all positive (the first 2 min, r=.56, p<.01; the final 6 min, r=.69, p<.01; the first 4 min, r=.69, p<.01; the final 4 min, r=.64, p<.01). Also, as Figure 4 shows, the commission error rates were all significantly higher out of the zone than in the zone (the first 2 min, t(104)=7.21, p<.01, d=.80; the final 6 min, t(104)= 10.07, p<.01, d=.93; the first 4 min, t(104)=7.51, p<.01,
d=.82; the final 4 min, t(104)=9.23, p<.01, d=.94).
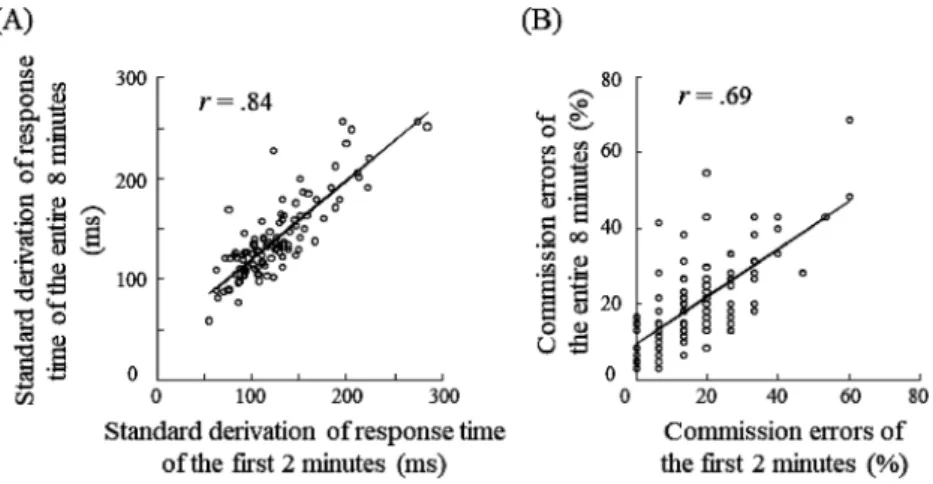
We compared the first 2 min of the performance and the entire 8 min of the performance based on the standard devia-tion of the response time and the commission error rate. The correlations of the performances between the first 2 min and for the entire 8 min were positive for both indices (standard deviation of the response time, r=.84, p<.01; commission er-ror rates, r=.69, p<.01) (Figure 5). Similarly, we compared the first 2 min of the performance and the final 6 min of the performance. The correlations of the performances between the first 2 min and the final 6 min were also positive (standard deviation of the response time, r=.77, p<.01; commission er-ror rates, r=.50, p<.01) (Figure 6). Furthermore, the correla-Figure 4. Commission error rates for each attentional state (“in the zone” or “out of the zone”). Error bars represent
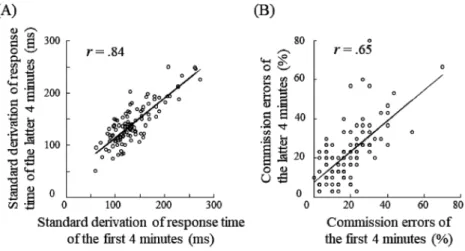
tion between performance during the first 4 min and that dur-ing the final 4 min was positive (standard deviation of response time, r=.83, p<.01; commission error rates, r=.65,
p<.01) (Figure 7).
We found significant main effects of time course on re-sponse time (F(3, 312)=6.87, p<.01, η2p=.06), standard
devi-ation of response time (F(3, 312)=8.92, p<.01, ηp2=.08), and
commission error rate (F(3, 312)=4.95, p<.01, η2p=.05)
(Fig-ure 8). In terms of response times, posteriori t-tests indicated that the response times during the first quartile were shorter than those during the third quartile (t(104)=3.57, p<.01, d =.35) and the fourth quartile (t(104)=3.38, p<.01, d=.36). No other significant difference was found. In terms of the
standard deviation of the response times, posteriori t-tests indicated that standard deviation of the response time during the first quartile was smaller than those during the second quartile (t(104)=4.38, p<.01, d=.28), the third quartile (t(104)=4.04, p<.01, d=.32), and the fourth quartile (t(104) =3.66, p<.01, d=.30). No other significant difference was found. With regard to commission error rates, posteriori t-tests indicated that the commission error rates during the first quartile were smaller than those during the third quartile (t(104)=2.94, p<.01, d=.28) and the fourth quartile (t(104) =3.05, p<.01, d=.36). No other significant difference was found.
Figure 5. The correlation between performances of the first 2 min and the entire 8 min (left; the standard deviation of response time, right; commission error rate).
Figure 6. The correlation between performances of the first 2 min and the final 6 min (left, standard deviation of response time; right, commission error rate).
Discussion
Under every situation (i.e., the entire 8 min, the first 2 min, the final 6 min, the first 4 min, and the final 4 min), observers made more commission errors out of the zone than in the zone, and those who were more variable tended to make more commission errors as there was a positive correlation between response time variability and the commission error rate. These results indicate that errors were liable to be induced when the timing of the responses was inconsistent, which is consistent with the findings of previous studies (Esterman et al., 2013; Rosenberg et al., 2013). Thus, the gradCPT used in this study was considered a valid procedure to measure sustained atten-tion.
We detected a positive correlation between the first 2 min of the performance and the entire 8 min performance. From this finding, we predicted the personal ability of sustained atten-tion from only a few min of the gradCPT. Given that the effect sizes in correlations as indexed by r exceed .5 can be taken as large effects (Cohen, 1988, p. 81), it should be reasonable to argue that the effect sizes found in the present findings from
r=.69 to r=.84 were sufficiently large and thus the 2 min
per-formance seem equivalent to the 8 min perper-formance. Howev-er, in the present study, “2 min” was one-fourth the entire du-ration. It is possible that the present 2 min of the performance would be different from the 2 min performance if the entire duration was 2 min, because participants could allocate effort Figure 7. The correlation between performance during the first 4 min and that during the final 4 min (left, standard
devia-tion of response time; right, commission error rate).
Figure 8. Performance transitions over time. Error bars represent standard errors. (A) Response times. (B) Standard devia-tion of response times. (C) Commission errors.
depending on the entire length of the trial. Thus, it was neces-sary to examine performance under this condition. The posi-tive correlation between the performance of one-fourth of the entire duration and the performance of the entire duration would be valuable for measuring sustained attention. The pos-itive correlation is reasonable because the entire 8 min in-cludes the first 2 min. Hence, we demonstrated a positive cor-relation between the performance during the first fourth and the remaining three-fourths, suggesting that observing only a few minutes of the performance should provide a clue about the ability to sustain attention. Furthermore, we showed a pos-itive correlation between performance during the first 4 min and that during the final 4 min. This suggests individual per-formance consistency throughout the task and supports our use of the data gathered during the first 2 min.
In the present study, the commission errors were defined as the index for attentional lapses (e.g., Christoff et al., 2009; Robertson et al., 1997; Smallwood, Beach, Schooler, & Handy, 2008). However, the cause of commission errors in a behavior-al task, such as the SART, has been a matter of debate (e.g., Seli, 2016). Some studies (e.g., Head & Helton, 2013, 2014) have proposed that commission errors are due to motor de-coupling, not attentional lapses. Those authors asserted that the errors were caused by control failure of the fast motor re-sponses even when observers paid adequate attention to the task. Seli (2016) demonstrated that the two possible factors of commission errors (i.e., attentional lapses and motor decou-pling) were not mutually exclusive and that both factors con-tributed to the errors. If those who responded more quickly made more commission errors, the response times would be negatively correlated with the commission error rates. Howev-er, the present results showed no correlation between these measures. Although response time was positively correlated with response time variability, indicating that those whose sponse times were slower also showed more variability, re-sponse time variability after controlling for rere-sponse time was highly positively correlated with commission errors. Thus, it seems unlikely that commission errors can be attributed to re-sponse times, including by motor decoupling. Another ap-proach to commission errors is the effect of reward (i.e., moti-vation) on grad-CPT performance (Esterman et al., 2014). That study demonstrated that some aspects of the errors of
sustaining attention were due to motivational lapses, while others were due to degradation of the cognitive resources nec-essary for the sustained attention. Therefore, in the present study, the commission errors on the gradCPT could be valid for measuring lapses in sustained attention (see Rosenberg et al., 2013).
Performance on the present task was impaired over time, consistent with previous studies (e.g., Esterman et al., 2014; Rosenberg et al., 2013). Response times were slower, response time variability was greater, and commission error rates were higher during the third and fourth quartiles compared with the first quartile. Thus, attentional lapses during the latter part of the task could have been partly caused by fatigue. However, one would expect individual differences in when and how fa-tigue affected performance, and we could not examine the fac-tors that affected fatigue based on the available data. However, the first quartile should have been least affected by fatigue. Therefore, the present results showing that performance dur-ing these initial 2 min could predict the ability to sustain at-tention remain potentially useful.
The present results suggest that the duration of a behavioral task, such as the SART, could be shortened, leading to in-creased versatility of tasks to measure sustained attention. This type of task has been used in clinical contexts to assess the sus-tained attentional states of patients with attention deficit hy-peractivity disorder (ADHD) (e.g., Bellgrove, Hawi, Gill, & Robertson, 2006; Johnson et al., 2007) and traumatic brain in-jury (e.g., Dockree et al., 2004; Robertson et al., 1997). This procedure has been combined with modern techniques for measuring brain activities, such as functional magnetic reso-nance imaging (e.g., Esterman, Noonan, Rosenberg, & De Gutis, 2013; Esterman et al., 2014; Rosenberg, Finn, Consta-ble, & Chun, 2015) or electroencephalography-event-related potential (e.g., Kirmizi-Alsan et al., 2006; Smallwood et al., 2008), and it provides new insights (e.g., determination that intrinsic brain connectivity powerfully predicts a sustained state of attention even in the presence of clinical symptoms of ADHD as well as in a healthy control group (Rosenberg et al., 2016)). We believe that the present findings will contribute to the development of sensitive measures to quantify everyday at-tentional deficits attributable to right hemisphere strokes (Robertson, 2003) and childhood and adulthood ADHD,
giv-en the difficulties in maintaining sustained attgiv-ention in these populations (Avisar & Shalev, 2011; Tucha et al., 2017).
Acknowledgments
This study has been supported by Grants-in-Aid for Scien-tific Research from the Japan Society for the Promotion of Sci-ence (17K04494) to KK and (17H02648) to JK. We thank Monica Rosenberg for sharing a Matlab script used for analy-sis in the present study. This work was supported by Graduate Grant Program of Graduate School of Letters, Hokkaido Uni-versity, Japan.
References
Avisar, A., & Shalev, L. (2011). Sustained attention and behav-ioral characteristics associated with ADHD in adults.
Applied Neuropsychology, 18, 107–116.
Bellgrove, M. A., Hawi, Z., Gill, M., & Robertson, I. H. (2006). The cognitive genetics of attention deficit hyperactivity dis-order (ADHD): Sustained attention as a candidate pheno-type. Cortex, 42, 838–845.
Brainard, D. H. (1997). The psychophysics toolbox. Spatial
Vision, 10, 433–436.
Broadbent, D. E., Cooper, P. F., FitzGerald, P., & Parkes, K. R. (1982). The cognitive failures questionnaire (CFQ) and its correlates. British Journal of Clinical Psychology, 21, 1–16. Brown, K. W., & Ryan, R. M. (2003). The benefits of being
present: Mindfulness and its role in psychological well-be-ing. Journal of Personality and Social Psychology, 84, 822– 848.
Carriere, J. S., Cheyne, J. A., & Smilek, D. (2008). Everyday at-tention lapses and memory failures: The affective conse-quences of mindlessness. Consciousness and Cognition, 17, 835–847.
Cheyne, J. A., Carriere, J. S. A., & Smilek, D. (2006). Absent-mindedness: Lapses of conscious awareness and everyday cognitive failures. Consciousness and Cognition, 15, 578– 592.
Christoff, K., Gordon, A. M., Smallwood, J. Smith, R. & Schooler, J. W. (2009). Experience sampling during fMRI reveals default network and executive system contributions to mind wandering. Proceedings of The National Academy of
Sciences of the United States of America, 106, 8719–8724.
Cohen, J. (1988). Statistical power analysis for the behavioral
sciences (2nd ed.). Hillsdale, NJ: Lawrence Erlbaum
Associ-ates.
Davies, D. R., & Parasuraman, R. (1982). The psychology of
vigilance. London, U.K.: Academic Press.
Dockree, P. M., Kelly, S. P., Roche, R. A., Hogan, M. J., Reilly, R. B., & Robertson, I. H. (2004). Behavioural and physiolog-ical impairments of sustained attention after traumatic brain injury. Brain Research Cognitive Brain Research, 20,
403–414.
Esterman, M., Noonan, S. K., Rosenberg, M., & DeGutis, J. (2013). In the zone or zoning out? Tracking behavioral and neural fluctuations during sustained attention. Cerebral
Cortex, 23, 2712–2723.
Esterman, M., Reagan, A., Liu, G., Turner, C., & DeGutis, J. (2014). Reward reveals dissociable aspects of sustained at-tention. Journal of Experimental Psychology: General, 143, 2287–2295.
Esterman, M., Rosenberg, M., & Noonan, S. K. (2014). Intrin-sic fluctuations in sustained attention and distractor pro-cessing. The Journal of Neuroscience, 34, 1724–1730. Head, J., & Helton, W. S. (2013). Perceptual decoupling or
mo-tor decoupling? Consciousness and Cognition, 22, 913–919. Head, J., & Helton, W. S. (2014). Practice does not make
per-fect in a modified sustained attention to response task.
Ex-perimental Brain Research, 232, 565–573.
Johnson, K. A., Robertson, I. H., Kelly, S. P., Silk, T. J., Barry, E., Daibhis, A., & Bellgrove, M. A. (2007). Dissociation in performance of children with ADHD and high-functioning autism on a task of sustained attention. Neuropsychologia,
45, 2234–2245.
Kirmizi-Alsan, E., Bayraktaroglu, Z., Gurvit, H., Keskin, Y. H., Emre, M., & Demiralp, T. (2006). Comparative analysis of event-related potentials during Go/NoGo and CPT: De-composition of electrophysiological markers of response in-hibition and sustained attention. Brain Research, 1104, 114– 128.
Kleiner, M., Brainard, D. H., & Pelli, D. (2007). What’s new in Psychtoolbox-3? Perception, 36 ECVP Abstract Supplement. Pelli, D. G. (1997). The VideoToolbox software for visual
psy-chophysics: Transforming numbers into movies. Spatial
Vision, 10, 437–442.
Risko, E. F., Anderson, N., Sarwal, A., Engelhardt, M., & King-stone, A. (2012). Every attention: Variation in mind wan-dering and memory in a lecture. Applied Cognitive
Psycholo-gy, 26, 234–242.
Robertson, I. H. (2003). Rehabilitation of attention. Zeitschrift
für Neuropsychologie, 14, 165–170.
Robertson, I. H., Manly, T., Andrade, J., Baddeley, B. T., & Yiend, J. (1997). ‘Oops!’: Performance correlates of every-day attentional failures in traumatic brain injured and nor-mal subjects. Neuropsychologia, 35, 747–758.
Rosenberg, M., D., Finn, E. S., Constable, R. T., & Chun, M. M. (2015). Predicting moment-to-moment attentional state.
NeuroImage, 114, 249–256.
Rosenberg, M. D., Finn, E. S., Scheinost, D., Papademetris, X., Shen, X., Constable, R. T., & Chun, M. M. (2016). A neuro-marker of sustained attention from whole-brain functional connectivity. Nature Neuroscience, 19, 165–171.
Rosenberg, M., Noonan, S., DeGutis, J., & Esterman, M. (2013). Sustaining visual attention in the face of distraction: A novel gradual-onset continuous performance task.
Atten-tion, PercepAtten-tion, & Psychophysics, 75, 426–439.
Seli, P. (2016). The attention-lapse and motor decoupling ac-counts of SART performance are not mutually exclusive.
Conscious and Cognition, 41, 189–198.
Smallwood, J., Beach, E., Schooler, J. W., & Handy, T. C. (2008). Going AWOL in the brain: Mind wandering reduces cortical analysis of external events. Journal of Cognitive
Neu-roscience, 20, 458–469.
Smallwood, J., McSpadden, M., & Schooler, J. W. (2008). When attention matters: The curious incident of the wan-dering mind. Memory & Cognition, 36, 1144–1150. Smilek, D., Carriere, J. S. A., & Cheyne, J. A. (2010). Failures of
sustained attention in life, lab, and brain: Ecological validity of the SART. Neuropsychologia, 48, 2564–2570.
Tucha, L., Fuermaier, A. B., Koerts, J., Buggenthin, R., Aschen-brenner, S., Weisbrod, M., ... Tucha, O. (2017). Sustained at-tention in adult ADHD: Time-on-task effects of various measures of attention. Journal of Neural Transmission, 124, 39–53.
Yantis S., & Jonides J. (1984). Abrupt visual onsets and selec-tive attention: Evidence from visual search. Journal of
Ex-perimental Psychology. Human Perception and Performance, 10, 601–621.