Why Are COVID-19 Mortality Rates by Country or Region So Different?:
An Ecologic Study of Factors Associated with Mortality from Novel Coronavirus
Infections by Country
Yoneatsu Osaki,* Hitoshi Otsuki,† Aya Imamoto,‡ Aya Kinjo,* Maya Fujii,* Yuki Kuwabara* and Yoko Kondo† *Division of Environmental and Preventive Medicine, Department of Social Medicine, School of Medicine, Faculty of Medicine, Tottori University, Yonago 683-8503, Japan, †Division of Medical Zoology, Department of Microbiology and Immunology, School of Medicine, Faculty of Medicine, Tottori University, Yonago 683-8503, Japan, and ‡Division of Pediatrics and Perinatology, School of Medicine, Faculty of Medicine, Tottori University, Yonago 683-8503, Japan
ABSTRACT
Background In order to find out the factors associated with the large disparities in COVID-19 mortality rates by country, we conducted an ecological study by link-ing existing statistics. In Japan, a large variation was observed in between geographical areas when assessing mortality. We performed a regional correlation analysis to find factors related to regional mortality. Methods This study design was an ecologic study. A multiple regression analysis was performed with COVID-19 mortality rates of different countries as the dependent variable together with various health care and economic factors. We calculated the cumulative mortal-ity rate as of June 30, 2020. For the regional correlation analysis of Japan, 47 prefectures were divided into nine regions. The factors examined were health care and tourism. Data for 33 Organization for Economic Co-operation and Development (OECD) countries were analyzed. In Japan’s regional analysis, the whole coun-try was classified into nine regions.
Results Factors related to mortality were the incidence of Kawasaki disease (KD), number of com-puted tomographies (CTs), and alcohol consumption. Mortality was low in countries with high incidence of KD and high number of CTs, as well as in countries with high alcohol consumption. In European countries, high smoking prevalence and a high Gini coefficient were positively related to high mortality. According to a regional analysis in Japan, mortality was related to proportion of population in the densely inhabited districts, the number of foreign visitors per capita, and the number of Chinese visitors per capita. Conclusion Low mortality in East Asia was associ-ated with specific disease morbidity (KD), alcohol consumption, and CT numbers. It was suggested that the mortality gap in Japan was related to the number of foreign tourists and the proportion of population in the densely inhabited districts.
Key words COVID-19; mortality; ecologic study; Ka-wasaki disease COVID-19 has become a global pandemic, and the number of infections and associated deaths continues to increase every day. As evidenced by the COVID-19 epi-demic curve by country, in some regions, the first wave of the epidemic may have subsided. However, it should be noted that there remain large disparities in between different countries’ mortality rates due to COVID-19. Among members of the European Organization for Economic Co-operation and Development (OECD),1 there is a 166-fold difference between the lowest mortality rates (Slovakia: 0.53 per 100,000 people as of 30 June) and the highest (Belgium: 85.55 per 100,000 people). Once East Asian and Oceanian countries are taken into consideration, an even significant difference is revealed, with China having the lowest mortality rate (0.33 per 100,000 people) and a 261-fold difference compared with the country with the highest mortality rate (Belgium). The low mortality rate in East Asian and Oceanian countries is significant, compared with European countries. The mortality rate is low not only in countries that implemented strong containment measures (e.g., China, New Zealand, and Australia) but also in countries like South Korea and Japan that did not enact stringent measures.2 Understanding the reasons for this phenomenon could lead to the development of measure to reduce mortality during the second and third waves of the epidemic. COVID-19 mortality has already been proven to be higher among older people, so it is relevant to find factors other than aging. There are articles that mortality or morbidity from COVID-19 by country is associated with Bacille de Calmette et Guérin Corresponding author: Yoneatsu Osaki, MD, PhD yoneatsu@tottori-u.ac.jp Received 2020 December 11 Accepted 2020 December 23 Online published 2021 January 21 Abbreviations: BCG, Bacille de Calmette et Guérin; COVID-19; Novel Coronavirus Disease; CT, computed tomography; DID, densely inhabited districts; GDP, gross domestic product; KD, Kawasaki disease; OECD, Organization for Economic Co-oper-ation and Development; UHC, universal health coverage; WHO, World Health Organization
(BCG) coverage and smoking rates.3–9 Report of a high incidence of Kawasaki disease-like symptoms among children affected by COVID-19 suggests a link between the two diseases.10 Factors commonly associated with mortality include accessibility of healthcare, healthcare delivery systems, number of healthcare facilities and the healthcare professionals. As economic inequalities have also been reported to be associated with access to healthcare, we also considered economically related indicators in the analysis.11 We also considered the number of CT scans, as a paper suggests that CT scans can lead to earlier detection of pneumonia caused by COVID-19.12 We used ecologic studies to evaluate these candidate factors. In order to come up with a hypothesis to clarify regional discrepancies in mortality, we conducted an ecological study by linking existing statistics and exam-ining the associated factors of mortality. In Japan, a large regional disparity in COVID-19 mortality was observed. The ratio of mortality rates in the largest and smallest areas is 83 to 1.13 Additionally, we conducted a regional correlation analysis. We deemed that providing hypotheses to elucidate regional differences in mortality rates in specific countries might be effective in preparing for future epidemics of this infectious disease.
SUBJECTS AND METHODS Study design
We performed a multiple regression analysis of COVID-19 mortality rates in different countries includ-ing various health care and economic factors. The number of cases per unit of population and case-fatality rate were not used as dependent variables because these were judged as unstable indices since the testing system and conditions varied between countries. To analyze the factors associated with regional differences in mortality rates in Japan, we calculated Spearman’s correlation coefficient between mortality and infection rates and each factor. Study subjects The countries analyzed included China, Japan, South Korea, Australia, New Zealand, Canada, and Israel, which were regarded to be at the end of the first wave of the epidemic.1 Additionally, we analyzed 26 countries, members of the OECD: Austria, Belgium, Czechia, Denmark, Estonia, Finland, France, Germany, Greece, Hungary, Iceland, Ireland, Italy, Latvia, Lithuania, Luxembourg, Netherlands, Norway, Poland, Portugal, Slovakia, Slovenia, Spain, Sweden, Switzerland, and the United Kingdom. All European countries were judged to have surpassed the first wave of the epidemic, as of June 30. For the regional correlation analysis of Japan, 47 prefectures were divided into nine regions, as many prefectures had a mortality rate of 0.13 Measures Cumulative mortality per 100,000 people was calculated by country using data from the European Centre for Disease Prevention and Control.14 We analyzed using factors prior to the COVID-19 pandemic. Factors were obtained from the OECD Statistics and World Health Organization (WHO) websites. We calculated the cu-mulative mortality rate until April 30, and June 30, 2020 and performed logarithmic transformation so that it was normally distributed. COVID-19 mortality and case-fatality rate have been found to be higher among older people,15–17 but country-specific age-adjusted mortality rates for COVID-19 have not been published. Therefore, in order to compare mortality rates by country, we adjusted the variables that had the strongest correlation with mortality rates among the indicators related to aging of the population, and examined the relationship with other candidate-related factors. Aging factors included the proportion of individuals over 65 years-old in a given country’s population, the old-age dependency ratio, life expectancy, and age-adjusted mortality rate. The most relevant indicator was life expectancy. Other factors examined were urban population, number of immigrants, unemployment rate, gross domestic product (GDP) per capita, the Gini coefficient, health expenditure, availability of hospital beds, number of physician, number of nurses, number of CTs, number of residents of elderly facilities, universal health cover-age (UHC) service coverage index, smoking prevalence, alcohol consumption, BCG vaccination coverage, inci-dence of KD, and governments’ responses to COVID-19 (Table 1). The Gini coefficient is a measure of the dis-tribution of income across a population. The coefficient ranges from 0 to 1, with 0 representing perfect equality and 1 representing perfect inequality. To analyze the factors associated with regional differences in COVID-19 mortality and infection rates in Japan,3 we examined health care and tourism data published by the Japanese government. The variables included proportion of elderly population,25 population density,26 proportion of population in the densely inhab-ited districts (DID),27 number of doctors per 100,000 people,28 number of hospital beds per 100,000 people,29 smoking prevalence,30 number of foreign tourists per 100,000 people,31 number of Chinese tourists per 100,000 people.31
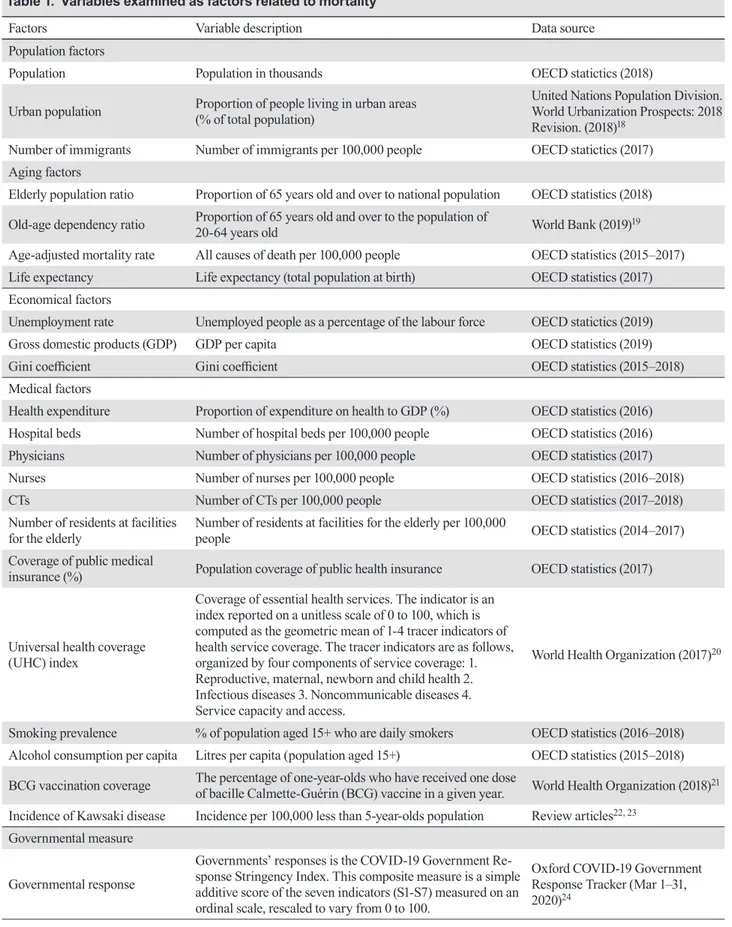
Table 1. Variables examined as factors related to mortality
Factors Variable description Data source
Population factors
Population Population in thousands OECD statictics (2018)
Urban population Proportion of people living in urban areas (% of total population) United Nations Population Division. World Urbanization Prospects: 2018 Revision. (2018)18
Number of immigrants Number of immigrants per 100,000 people OECD statictics (2017) Aging factors
Elderly population ratio Proportion of 65 years old and over to national population OECD statistics (2018) Old-age dependency ratio Proportion of 65 years old and over to the population of 20-64 years old World Bank (2019)19 Age-adjusted mortality rate All causes of death per 100,000 people OECD statistics (2015–2017) Life expectancy Life expectancy (total population at birth) OECD statistics (2017) Economical factors
Unemployment rate Unemployed people as a percentage of the labour force OECD statictics (2019)
Gross domestic products (GDP) GDP per capita OECD statistics (2019)
Gini coefficient Gini coefficient OECD statistics (2015–2018)
Medical factors
Health expenditure Proportion of expenditure on health to GDP (%) OECD statistics (2016) Hospital beds Number of hospital beds per 100,000 people OECD statistics (2016)
Physicians Number of physicians per 100,000 people OECD statistics (2017)
Nurses Number of nurses per 100,000 people OECD statistics (2016–2018)
CTs Number of CTs per 100,000 people OECD statistics (2017–2018)
Number of residents at facilities
for the elderly Number of residents at facilities for the elderly per 100,000 people OECD statistics (2014–2017) Coverage of public medical
insurance (%) Population coverage of public health insurance OECD statistics (2017)
Universal health coverage (UHC) index Coverage of essential health services. The indicator is an index reported on a unitless scale of 0 to 100, which is computed as the geometric mean of 1-4 tracer indicators of health service coverage. The tracer indicators are as follows, organized by four components of service coverage: 1. Reproductive, maternal, newborn and child health 2. Infectious diseases 3. Noncommunicable diseases 4. Service capacity and access. World Health Organization (2017)20
Smoking prevalence % of population aged 15+ who are daily smokers OECD statistics (2016–2018) Alcohol consumption per capita Litres per capita (population aged 15+) OECD statistics (2015–2018) BCG vaccination coverage The percentage of one-year-olds who have received one dose of bacille Calmette-Guérin (BCG) vaccine in a given year. World Health Organization (2018)21 Incidence of Kawsaki disease Incidence per 100,000 less than 5-year-olds population Review articles22, 23
Governmental measure Governmental response Governments’ responses is the COVID-19 Government Re-sponse Stringency Index. This composite measure is a simple additive score of the seven indicators (S1-S7) measured on an ordinal scale, rescaled to vary from 0 to 100. Oxford COVID-19 Government Response Tracker (Mar 1–31, 2020)24
Statistical analyses Logarithmic transformation was performed to restore the COVID-19 mortality rate to the normal distribu-tion. Since the age-adjusted mortality rate could not be calculated for each country, life expectancy and each variable were input as covariates for multiple regression analysis. To analyze the factors associated with regional differences in mortality/infection rates in Japan, we calculated Spearman’s correlation coefficient between mortality or infection rates and each factor. Statistical analyses were conducted using SPSS Statistics 25.0 for Windows (IBM, Armonk, NY, 2017). Ethics approval This study was conducted using publicly available data that did not include personal information, so no ethical review was required. Patients or the public were not involved in the design, or conduct, or reporting, or dis-semination plans of our research. The data used in this study were published as shown in Table 1 and did not contain any personal information. RESULTS The incidence of KD, number of CTs, and alcohol consumption were related to the COVID-19 mortality in analysis including Europe, Oceania, East Asia, Canada, and Israel (Table 2). Mortality was low in countries with high KD incidence and number of CTs, conversely, it was high in countries with high alcohol consumption. Taking into account standardized regression coefficient KD incidence was the highest associated factor (Table 2, Figs. 1–3). In an analysis limited to Europe, when we imple-mented the mortality rate by the end of April as the dependent variable, smoking prevalence and the Gini coefficient were positively significant associated factors. Similarly, when we implemented the mortality rate by the end of June was the dependent variable, smoking prevalence and Gini coefficient were positively signifi-cant associated factors (Figs. 4 and 5). The value of the standard regression coefficient of smoking prevalence tended to have a larger value earlier in the epidemic. The standardized regression coefficient of the smoking rate tended to decrease with time (until April 30 = 0.495, until May 31 = 0.467, and until June 30 = 0.454), while the standardized regression coefficient of the Gini coef-ficient tended to increase with time (0.315, 0.335, 0.348, respectively). According to a regional analysis in Japan, the mortality was related to the proportion of the population in densely inhabited districts, the number of foreigners per capita, and the number of Chinese individuals per capita. Chinese overnight stays were a more significant associated factor than foreign overnight stays (Table 3). DISCUSSION The current study revealed that, in Europe, COVID-19 national mortality rates are related to the smoking rate and Gini coefficient. In regions where the first wave of the epidemic seemed to have ended -including East Asia and Oceania- KD incidence, number of CTs, and alcohol consumption were related to mortality. Higher smoking rates, economic disparity, and higher alcohol consumption resulted in higher mortality rates, while higher rates of KD incidence and number of CTs re-sulted in lower mortality rates. The results of our study confirm that smoking is a factor related to a severe progression of COVID-19.3 However, it should be noted that one article posits that higher smoking rates lead to lower COVID-19 mortal-ity,4 which could be owed to the fact that said study analyzed countries including low population countries and cut-off for the measure of the mortality rate was May 30, 2020. Indicators related to health care provi-sion and access to medical care were not statistically significant variables in this study. Conversely, since the Gini coefficient is an indicator of economic disparity, low-income individuals are at greater risk to become seriously ill from COVID-19; thus, the mortality rate of the disease may be higher in societies with a higher pro-portion of low-income individuals. In the United States, counties with higher poverty rates have been reported to have a higher mortality rate.32 The results of this study showed that early in the epidemic, COVID-19 mortality was likely to be high in countries with high smoking rates, and after that, mortality was likely to be high in countries with large income disparities. This suggests that the disease will become more concentrated in vulnerable groups over time, and more compassionate measures are needed for these populations. Therefore, we can say that measures to reduce smoking and income disparity may reduce the mortality rate during the second and third waves of the epidemic. Economic inequalities cannot be easily remedied, but it can be suggested that countries with large economic disparities may have higher mortality rates from new infectious diseases and therefore need to focus on advance prepa-ration for the coming outbreak of the diseases. High alcohol consumption may have been related to a higher mortality rate because alcohol is typically provided outside the home, which makes individuals more likely to become infected. Chest CT scans are useful in finding milder patients with pneumonia.12 In countries with more CT scans, patients with pneumonia
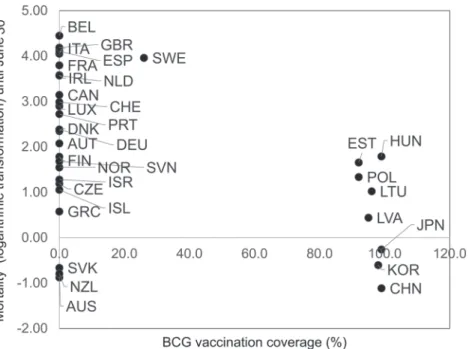
can be found earlier, which may lead to lower mortality due to earlier initiation of treatment in patients who become more severe if treatment is delayed. Some studies have reported that low COVID-19 mortality rates might be related to BCG vaccination.5–7 However, this hypothesis has proven to be unreliable, as some studies have shown conflictive results.8, 9 Although, BCG vaccination coverage was not statisti-cally significant in the current study, mortality rate was found to be low in countries that implemented BCG vaccination (Fig. 6). Since there are no countries with intermediate BCG vaccination coverages, it is difficult to verify the relationship between COVID-19 mortality and BCG vaccination. The incidence of KD was found to be a relevant factor. Many KD-like conditions were found among children of COVID-19 patients in Western countries.10 In Japan, the country with the highest incidence of KD, no increase in KD has been observed during 2020, and no pediatric cases of COVID-19 and KD have been identi-fied.33 It is hypothesized that populations in countries with a high incidence of KD have low mortality from COVID-19 because they have been repeatedly exposed to viruses similar to SARS-CoV-2 and have acquired widespread natural immunity. Since mortality rate among the Asian Americans is not lower than among Table 2. Results of multiple regression analysis with COVID-19 mortality as the dependent variable
Variables Partial regression
coefficient Standardized regression coefficient
t-statistics P-value Adjected R square Europe, Oceania, East Asia, Canada, and Israel (mortality as of June 30) Life expectancy (n = 33) 0.232 0.351 2.086 0.045 * 0.095 Elderly population ratio (n = 33) 0.114 0.233 1.331 0.193 0.024 Old-age dependency ratio (n = 32) 0.061 0.214 1.200 0.240 0.014 Age-adjusted mortality rate (n = 30) –0.002 –0.177 –0.952 0.349 –0.003 Europe only (mortality as of June 30) Life expectancy (n = 26) 0.343 0.635 4.022 0.000* 0.378 Age-adjusted mortality rate (n = 25) –0.005 –0.573 –3.350 0.003 * 0.299 Elderly population ratio (n = 26) 0.062 0.107 0.526 0.604 –0.003 Old-age dependency ratio (n = 25) 0.021 0.060 0.287 0.777 –0.040 Europe, Oceania, East Asia, Canada, and Israel (mortality as of June 30) Incidence of Kawasaki disease (n = 18) –0.018 –0.587 –2.776 0.014 * 0.298 Number of CTs (n = 27) –0.038 –0.525 –2.938 0.007* 0.260 Alcohol consumption (n = 30) 0.277 0.376 2.103 0.045* 0.187 Health expenditure (n = 33) 0.331 0.376 1.753 0.090 0.152 BCG vaccination coverage (n = 33) –0.014 –0.363 –1.780 0.085 0.154 Europe only (mortality as of April 30) Smoking prevalence (n = 15) 0.127 0.495 2.628 0.021 * 0.468 Gini coefficient (n = 25) 12.078 0.315 2.310 0.030* 0.552 Alcohol consumption (n = 23) 0.231 0.314 1.770 0.091 0.465 Number of CTs (n = 20) –0.033 –0.263 –1.781 0.092 0.588 Europe only (mortality as of June 30) BCG vaccination coverage (n = 25) 0.018 0.488 1.850 0.077 0.435 Smoking prevalence (n = 16) 0.119 0.454 2.174 0.049* 0.347 Gini coefficient (n = 25) 12.933 0.348 2.364 0.027* 0.478 Number of physician (n = 19) –0.553 –0.317 –1.786 0.093 0.453 Number of CTs (n = 20) –0.035 –0.292 –1.787 0.091 0.496 The table shows the results for variables with p-values less than 0.1. *P < 0.05
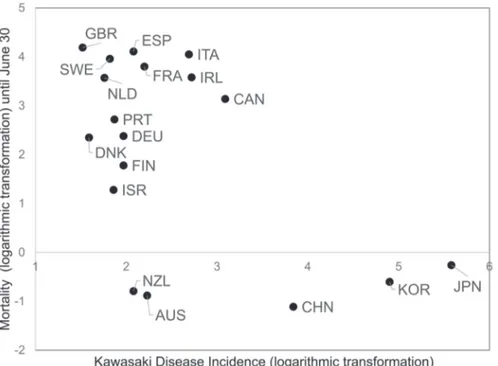
Fig. 1. Relationship between COVID-19 mortality and Kawasaki Disease incidence (Europe, East Asia, Oceania, Canada, Israel). A scatter plot created by logarithmically converting the mortality rate of COVID-19 on the vertical axis and logarithmically converting the incidence Kawasaki disease on the horizontal axis. Each dot indicates the value of each country. The alphabet near the dot indicates the International Organization for Standardization (ISO) 3-digit country code. AUS, Australia; CAN, Canada; CHN, China; DEU, Germany; DNK, Denmark; ESP, Spain; FIN, Finland; FRA, France; GBR, United Kingdom; IRL, Ireland; ISR, Israel; ITA, Italy; JPN, Japan; KOR, Korea; NLD, Netherlands; NZL, New Zealand; PRT, Portugal; SWE, Sweden. Fig. 2. Relationship between COVID-19 mortality and number of CTs (Europe, East Asia, Oceania, Canada, Israel). A scatter plot created by logarithmically converting the COVID-19 mortality rate on the vertical axis and the number of CTs per 100,000 population on the horizontal axis. AUS, Australia; AUT, Austria; CAN, Canada; CHE, Switzerland; CZE, Czech Republic; DEU, Germany; DNK, Denmark; ESP, Spain; EST, Estonia; FIN, Finland; FRA, France; GRC, Greece; HUN, Hungary; IRL, Ireland; ISL, Iceland; ISR, Israel; ITA, Italy; JPN, Japan; KOR, Korea; LTU, Lithuania; LUX, Luxembourg; LVA, Latvia; NLD, Netherlands; NZL, New Zealand; POL, Poland; SVK, Slovakia; SVN, Slovenia.
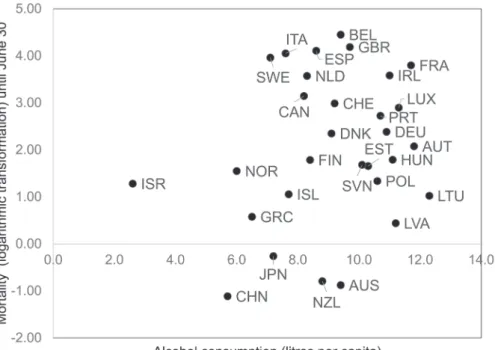
Fig. 3. Relationship between COVID-19 mortality and alcohol consumption (Europe, East Asia, Oceania, Canada, Israel). A scatter plot created by logarithmically converting the COVID-19 mortality rate on the vertical axis and the alcohol consumption per capita of the population aged 15 and over on the horizontal axis. AUS, Australia; AUT, Austria; BEL, Belgium; CAN, Canada; CHE, Switzerland; CHN, China; DEU, Germany; DNK, Denmark; ESP, Spain; EST, Estonia; FIN, Finland; FRA, France; GBR, United Kingdom; GRC, Greece; HUN, Hungary; IRL, Ireland; ISL, Iceland; ISR, Israel; ITA, Italy; JPN, Japan; LUX, Luxembourg; LVA, Latvia; LTU, Lithuania; NLD, Netherlands; NOR, Norway; NZL, New Zealand; POL, Poland; PRT, Portugal; SVN, Slovenia; SWE, Sweden. Fig. 4. Relationship between COVID-19 mortality and smoking rate (Europe). A scatter plot created by logarithmically converting the COVID-19 mortality rate on the vertical axis and the smoking prevalence on the horizontal axis. CHE, Switzerland; CZE, Czech Republic; DEU, Germany; DNK, Denmark; ESP, Spain; EST, Estonia; FIN, Finland; FRA, France; GBR, United Kingdom; IRL, Ireland; ISL, Iceland; ITA, Italy; LUX, Luxembourg; NLD, Netherlands; NOR, Norway; SWE, Sweden.
Caucasians,34, 35 the lower rate of COVID-19 mortality in East Asian countries is more owed to environmental factors rather than genetic factors. It is speculated that living in an environment susceptible to KD is related to factors that prevent the exacerbation of COVID-19. Outside of Europe, North America, East Asia and Oceania, there are few reliable data on incidence of KD, making it difficult to examine the association between country-specific COVID-19 mortality and incidence of KD. However, the relationship between the immune system of people with a history of Kawasaki disease and COVID-19 infection or severity may be worth investigating. If we find factors that vary in frequency between Europe and East Asia, we can make them appear to be associated with COVID-19 mortality. For example, one study has shown that mortality is low in countries where rice is a staple of its citizens diet.36 However, it is difficult to explain the reason for this phenomenon from a medical or biological standpoint. KD is a disease the cause of which is still unknown, but it is strongly suspected that infectious diseases are involved in its etiology. Among the hypotheses about its etiology, there is also a coronavirus infection, although this coronavi-rus theory has not gained much traction.37 In Japan, the incidence of KD is increasing yearly. If the proportion of the population repeatedly exposed to pathogens that cross-react with the novel coronavirus, especially among young people, is high, it is possible that not many people will develop serious COVID-19-related pneumonia. It is speculated that the mortality gap by region in Japan is caused by the concentration of population and tourism in urban areas. No clear regional differences in the incidence of KD have been observed in Japan. In other words, it is speculated that the first wave of epidemics in Japan might have been brought in by for-eign tourists, after which it spread in densely populated areas, thus, giving rise to COVID-19 related deaths. In areas frequented by foreign tourists, infectious diseases are likely to spread, thus, precautionary health crisis measures such as strengthening the surveillance system and improving the medical system are necessary. Winged animals, such as birds and bats, can transmit infectious diseases. For example, common migratory birds, such as swallows, can carry the virus. Swallows travel between East and Southeast Asia, and breed and stay in Japan from March to October. In northern Japan and metropolitan areas, nesting activ-ity has been scarce,38 nesting areas for swallows and areas with low COVID-19 mortality appear to match. Thus, there may be other factors that better explain the regional differences in COVID-19 mortality rate in ad-dition to those analyzed in this study. One limitation of this research is that it followed an ecological research design. Since ecological studies Fig. 5. Relationship between COVID-19 mortality and Gini coefficient (Europe). A scatter plot created by logarithmically converting the COVID-19 mortality rate on the vertical axis and the Gini coefficient on the horizontal axis. AUT, Austria; BEL, Belgium; CHE, Switzerland; CZE, Czech Republic; DEU, Germany; DNK, Denmark; ESP, Spain; EST, Estonia; FIN, Finland; FRA, France; GBR, United Kingdom; GRC, Greece; HUN, Hungary; IRL, Ireland; ISL, Iceland; IITA, Italy; LUX, Luxembourg; LVA, Latvia; LTU, Lithuania; NLD, Netherlands; NOR, Norway; POL, Poland; PRT, Portugal; SVK, Slovakia; SVN, Slovenia; SWE, Sweden.
Ta bl e 3 . Ex am in at io n o f f ac to rs r el at ed t o i nf ec tio n r at e a nd m or ta lit y b y r eg io n i n J ap an A s o f J ul y 7 In fec te d ca se s D ea th s In fec te d ra te [p er 10 0 thou sa nd s po pu la tion (T P)] Mo rta lit y (p er 10 0 TP) Ca se fa ta lit y ra te Pr op or tion of el de rly po pu la tion Po pu la tion de ns ity % o f po pu la tion in th e de nse ly in ha bi te d di str ic ts N umb er of d oc to rs pe r 1 00 T P (2 018 ) N umb er of h os pi ta l be ds p er 10 0 T P) (2 01 7) Sm ok in g ra te (2 01 9) N umb er o f for eig ne r sta ys p er 10 0 T P (2 018 ) N umb er o f Ch in es e sta ys p er 10 0 T P (2 018 ) Ho kk ai do 1277 101 24 .32 1.9 2 7.9 1 0. 31 9 66 .9 3 75 .2 25 4.0 17 76 .7 22 .6 146 46 7.6 35 68 7.4 To ho ku 29 4 2 3. 39 0.0 2 0. 68 0. 32 0 12 9.4 6 46. 5 23 0.7 13 04 .9 22 .1 14 85 1.4 228 0.8 N or th er n K an to 42 9 29 6. 37 0. 43 6.7 6 0. 29 3 35 7.6 5 40 .7 22 0. 3 11 29 .6 19. 1 10 861 .6 18 79 .3 So ut he rn K an to 10 89 0 53 4 29. 65 1.4 5 4.9 0 0. 252 27 09 .73 89 .6 24 9.2 88 9.2 18 .3 79 00 2. 4 21 30 0. 3 Chu bu 16 62 10 0 7.8 3 0. 47 6.0 2 0. 28 8 317. 51 57. 0 231 .8 11 02 .2 18 .7 45 65 5.6 17 76 3.8 K in ki 333 6 15 6 14 .9 5 0.7 0 4.6 8 0. 28 7 67 3.7 6 78 .4 28 1.3 121 3.6 18 .4 92 75 8.7 28 00 4.0 Ch ugo ku 26 4 3 3.6 3 0.0 4 1.14 0. 31 2 22 8.1 9 51 .1 29 0.1 15 46 .6 17. 6 23 01 2. 4 24 46 .0 Sh iko ku 19 3 9 5.1 9 0. 24 4.6 6 0. 333 19 7.9 0 42 .0 30 5.8 18 33 .2 17. 0 21 06 6. 6 362 6. 4 Ky ush u/ Ok in aw a 13 22 45 9.2 7 0. 32 3.4 0 0. 29 5 32 0. 30 56 .5 29 7.2 17 62 .6 19. 8 84 18 7.1 12 73 6.1 Co rre la tio n co effi cie nt o f S pe ar m an w ith in fe ct ed ra te 0. 467 0. 81 7 0.0 5 –0 .2 67 0.1 33 0.7 83 0. 83 3 Co rre la tio n co effi cie nt o f S pe ar m an w ith m or ta lit y 0. 333 0.7 33 –0 .13 3 –0. 30 0 0.1 83 0.7 00 0. 81 7 D en se ly in ha bi te d di str ic ts (DI D) : c en su s a re as th at h av e a p op ul at io n de ns ity o f a bo ut 4 ,0 00 o r m or e p er sq ua re m et er w ith a to ta l p op ul at io n of 5 ,0 00 o r m or e w ith ad ja ce nt ar ea s.
cannot prove causal relationships, the purpose of this study was to propose useful hypotheses. In this re-search, useful results for indicating the direction of the answer to the problem were produced, and our results were consistent with the existing literature. In conclusion, the current study revealed that, in Europe, COVID-19 national mortality rates are related to the smoking rate and Gini coefficient. In regions where the first wave of the epidemic seemed to have ended -including East Asia and Oceania- KD incidence, number of CTs, and alcohol consumption were related to mortality. Higher smoking rates, economic dispar-ity, and higher alcohol consumption resulted in higher mortality rates, while higher rates of KD incidence and number of CTs resulted in lower mortality rates. Measures against smoking and measures to reduce economic inequality might reduce the mortality rate during the second and third waves of the epidemic. The low mortality rate of COVID-19 in countries with a high incidence of KD is expected to provide useful informa- tion for the development of therapeutic drugs and vac-cines by examining the immune system of those with a history of KD. In areas frequented by foreign tourists, infectious diseases are likely to spread, thus, prepara-tion for health crisis measures such as strengthening the surveillance system and improving the medical system, are necessary. Acknowledgments: We would like to thank Editage (www. editage.com) for English language editing.
The authors declare no conflict of interest. REFERENCES 1 Download historical data (to 14 December 2020) on the daily number of new reported COVID-19 cases and deaths worldwide [Internet]. Solna (Sweden): European Centre for Disease Prevention and Control (European Union) [cited 2020 Dec 28]. Available from: https://www.ecdc.europa.eu/ en/publications-data/download-todays-data-geographic-distribution-covid-19-cases-worldwide. 2 Coronavirus: The world in lockdown in maps and charts [Internet]. London: BBC News [cited 2020 April 7]. Available form: https://www.bbc.com/news/world-52103747. 3 Reddy RK, Charles WN, Sklavounos A, Dutt A, Seed PT, Khajuria A. The effect of smoking on COVID-19 sever-ity: a systematic review and meta-analysis. J Med Virol. 2021;93:1045-56. DOI: 10.1002/jmv.26389, PMID: 32749705 4 Tsigaris P, Teixeira da Silva JA. Smoking prevalence and COVID-19 in Europe. Nicotine Tob Res. 2020;22:1646-9. DOI: 10.1093/ntr/ntaa121, PMID: 32609839 5 Miyasaka M. Is BCG vaccination causally related to reduced COVID‐19 mortality? EMBO Mol Med. 2020;12:e12661. DOI: 10.15252/emmm.202012661, PMID: 32379923
Fig. 6. Relationship between COVID-19 mortality and BCG vaccination coverage (Europe, East Asia, Oceania, Canada, Israel). A scatter plot created by logarithmically converting the COVID-19 mortality rate on the vertical axis and BCG vaccination coverage on the horizontal axis. AUS, Australia; AUT, Austria; BEL, Belgium; CAN, Canada; CHE, Switzerland; CHN, China; DEU, Germany; CZE, Czech Republic; DNK, Denmark; ESP, Spain; EST, Estonia; FIN, Finland; FRA, France; GBR, United Kingdom; GRC, Greece; HUN, Hungary; IRL, Ireland; ISL, Iceland; ISR, Israel; ITA, Italy; JPN, Japan; KOR, Korea; LUX, Luxembourg; LVA, Latvia; LTU, Lithuania; NLD, Netherlands; NOR, Norway; NZL, New Zealand; POL, Poland; PRT, Portugal; SVK, Slovakia; SVN, Slovenia; SWE, Sweden.
6 Ebina-Shibuya R, Horita N, Namkoong H, Kaneko T. National policies for paediatric universal BCG vaccination were associated with decreased mortality due to COVID ‐19. Respirology. 2020;25:898-9. DOI: 10.1111/resp.13885, PMID: 32558034 7 Escobar LE, Molina-Cruz A, Barillas-Mury C. BCG vaccine protection from severe coronavirus disease 2019 (COVID-19). Proc Natl Acad Sci USA. 2020;117:17720-6. DOI: 10.1073/ pnas.2008410117, PMID: 32647056 8 Hamiel U, Kozer E, Youngster I. SARS-CoV-2 Rates in BCG-vaccinated and unvaccinated young adults. JAMA. 2020;323:2340-1. DOI: 10.1001/jama.2020.8189, PMID: 32401274 9 Wassenaar TM, Buzard GS, Newman DJ. BCG vaccination early in life does not improve COVID‐19 outcome of elderly populations, based on nationally reported data. Lett Appl Microbiol. 2020;71:498-505. DOI: 10.1111/lam.13365, PMID: 32734625 10 Licciardi F, Pruccoli G, Denina M, Parodi E, Taglietto M, Rosati S, et al. SARS-CoV-2–Induced Kawasaki-Like Hyperinflammatory Syndrome: A Novel COVID Phenotype in Children. Pediatrics. 2020;146:e20201711. DOI: 10.1542/ peds.2020-1711, PMID: 32439816 11 Doorslaer E, Koolman X, Jones AM. Explaining income-related inequalities in doctor utilisation in Europe. Health Econ. 2004;13:629-47. DOI: 10.1002/hec.919, PMID: 15259043 12 Gaia C, Maria Chiara C, Silvia L, Chiara A, Maria Luisa DC, Giulia B, et al. Chest CT for early detection and management of coronavirus disease (COVID-19): a report of 314 patients admitted to Emergency Department with suspected pneu-monia. Radiol Med (Torino). 2020;125:931-42. DOI: 10.1007/ s11547-020-01256-1, PMID: 32729028 13 Status of positive test cases in each prefecture (Domestic cases excluding airport quarantine and charter flights) [Inter-net]. Tokyo: Ministry of Health, Labour and Welfare, Japan [cited 2020 Sep 7]. Available from: https://www.mhlw.go.jp/ content/10906000/000663402.pdf. Japanese. 14 OECD Statistics [Internet]. Paris: Organization for Economic Co-operation and Development [cited 2020 Sep 20]. Available from: https://stats.oecd.org/. 15 Baloch S, Baloch MA, Zheng T, Pei X. The coronavirus disease 2019 (COVID-19) pandemic. Tohoku J Exp Med. 2020;250:271-8. DOI: 10.1620/tjem.250.271, PMID: 32321874 16 Dudley JP, Lee NT. Disparities in age-specific morbidity and mortality from SARS-CoV-2 in China and the Republic of Korea. Clin Infect Dis. 2020;71:863-5. DOI: 10.1093/cid/ ciaa354, PMID: 32232322 17 Goldstein JR, Lee RD. Demographic perspectives on the mortality of COVID-19 and other epidemics. Proc Natl Acad Sci USA. 2020;117:22035-41. DOI: 10.1073/pnas.2006392117, PMID: 32820077 18 Urban population (% of total population) [Internet]. Wash-ington, D.C.: The World Bank [cited 2020 Sep 7]. Available from: https://data.worldbank.org/indicator/SP.URB.TOTL. IN.ZS. 19 Age dependency ratio, old (% of working-age population) [Internet]. Washington, D.C.: The World Bank [cited 2020 Sep 7]. Available from https://data.worldbank.org/indicator/ SP.POP.DPND.OL. 20 Primary Health Care on the Road to Universal Health Cover-age 2019 Monitoring report [Internet]. Geneva: World Health Organization [cited 2020 Sep 7]. Available from: https://www. who.int/docs/default-source/documents/2019-uhc-report.pdf. 21 BCG Immunization coverage estimates by country
[Internet]. Geneva: World Health Organization [cited 2020 Sep 7]. Available from: https://apps.who.int/gho/data/view. main.80500?lang=en. 22 Lin MT, Wu MH. The global epidemiology of Kawasaki dis-ease: review and future perspectives. Glob Cardiol Sci Pract. 2017;2017:e201720. DOI: 10.21542/gcsp.2017.20, PMID: 29564341 23 Kim GB. Reality of Kawasaki disease epidemiology. Korean J Pediatr. 2019;62:292-6. DOI: 10.3345/kjp.2019.00157, PMID: 31319643 24 Oxford COVID-19 Government Response Tracker, Blavatnik School of Government. Data use policy: Creative Commons 2020 [Internet]. Hale, Thomas, Angrist N, Cameron-Blake E, Hallas L, Kira B, et al. [cited 2020 Sep 7]. Available from: https://covidtracker.bsg.ox.ac.uk/stringency-scatter. 25 Population estimates 2019. April 14, 2020 [Internet]. Tokyo: Statistics Bureau of Japan [cited 2020 July 30]. Available from: https://www.stat.go.jp/data/jinsui/2019np/index.html. Japanese. 26 Statistical reports on the land area by prefectures and munici-palities in Japan. Dec 26,2019 [Internet]. Tsukuba: Geospatial Information Authority of Japan [cited 2020 Sep 7]. Available from: https://www.gsi.go.jp/KOKUJYOHO/MENCHO/ backnumber/GSI-menseki20191001.pdf. Japanese. 27 Population of densely inhabited district by prefecture, 2015 [Internet]. Tokyo: National Institute of Population and Social Security Research [cited 2020 Sep 7]. Available from: http:// www.ipss.go.jp/syoushika/tohkei/Popular/P_Detail2020. asp?fname=T12-22.htm&title1=%87%5D%87U%81D%93 s%93%B9%95%7B%8C%A7%95%CA%93%9D%8Cv&t itle2=%95%5C12%81%7C22+%93s%93%B9%95%7B%8. Japanese. 28 Survey of Physicians, Dentists and Pharmacists 2018 [Inter-net]. Tokyo: Ministry of Health, Labour and Welfare, Japan [cited 2020 Sep 7]. Available from: https://www.mhlw.go.jp/ toukei/saikin/hw/ishi/18/index.html. Japanese. 29 Static/Dynamic Survey of Medical Institutions and Hospital Report 2017, Dec 27, 2018 [Internet]. Tokyo: Ministry of Health, Labour and Welfare, Japan [cited 2020 Seo 7]. Available from: https://www.mhlw.go.jp/toukei/saikin/hw/ iryosd/17/dl/09gaikyo29.pdf. Japanese. 30 Cancer Information Service, National Cancer Center, Japan. Smoking rate by prefecture from Comprehensive Survey of Living Conditions 2019, Ministry of Health, Labour and Welfare, Japan [Internet]. Cancer Registry and Statistics [cited 2019 Sep 7]. Available from: https://ganjoho.jp/data/reg_stat/ statistics/dl/Pref_Smoking_Rate(2001_2019).xls. Japanese. 31 Japan Tourism Statistics. The number of guests staying at accommodations in each prefecture of Japan by country/area, 2018, Aug 5, 2020 [Internet]. Tokyo: Japan National Tourism Organization [cited 2020 Sep 7]. Available from: https:// statistics.jnto.go.jp/en/graph/#graph--inbound--prefecture--ranking. 32 Abedi V, Olulana O, Avula V, Chaudhary D, Khan A, Shahjouei S, et al. Racial, Economic, and Health Inequality and COVID-19 Infection in the United States. J Racial Ethn Health Disparities. 2020;1:1-11. DOI: 10.1007/s40615-020-00833-4, PMID: 32875535
33 News about Kawasaki disease and COVID-19 [Internet]. Tokyo: Japanese Society of Kawasaki Disease [cited 2020 Sep 7]. Available from: http://www.jskd.jp/pdf/20200508COVID-19andKD.pdf. Japanese. 34 Mahajan UV, Larkins-Pettigrew M. Racial demographics and COVID-19 confirmed cases and deaths: a correlational analy-sis of 2886 US counties. J Public Health (Oxf). 2020;42:445-7. DOI: 10.1093/pubmed/fdaa070, PMID: 32435809 35 Goldstein JR, Atherwood S. Improved measurement of racial/ethnic disparities in COVID-19 mortality in the United States. medRxiv 2020;2020.05.21.20109116. DOI: 10.1101/2020.05.21.20109116. 36 Watanabe S, Wahlqvist ML. Covid-19 and dietary socioecol-ogy: risk minimisation. Asia Pac J Clin Nutr. 2020;29:207-19. DOI: 10.6133/apjcn.202007_29(2).0001, PMID: 32674226 37 Nakamura Y. [Etiology and pathogenesis of Kawasaki dis-ease]. Nihon Rinsho. 2016;74(suppl 6):503-7. PMID: 30547547 Japanese. 38 The National Survey on the Natural Environment. Report of the distributional survey of Japanese animals (Birds). 2004 [Internet]. Fujiyoshida: Biodiversity center of Japan [cited 2020 Sep 7]. Available from: http://www.biodic.go.jp/ reports2/6th/6_bird/6_bird.pdf. Japanese.
![Table 3. Examination of factors related to infection rate and mortality by region in Japan As of July 7Infected casesDeathsInfected rate [per 100 thousands population (TP)]](https://thumb-ap.123doks.com/thumbv2/123deta/5779107.1027147/9.892.250.625.84.1097/examination-factors-infection-mortality-infected-casesdeathsinfected-thousands-population.webp)