High Mortality Rate of Infectious Diseases in Dialysis Patients: A Comparison with the General Population in Japan
Authors’ full names:
Minako Wakasugi,1 Kazuko Kawamura,2 Suguru Yamamoto,2 Junichiro James Kazama,3 and Ichiei Narita2
1
Center for Inter-organ Communication Research and 2Division of Clinical Nephrology and Rheumatology, Niigata University Graduate School of Medical and Dental Science, and 3Division of Blood Purification Therapy, Niigata University Medical and Dental Hospital, Japan
Corresponding author:
Minako Wakasugi, M.D., M.P.H., PhD.
Asahimachi 1-757, Chuo-ku, Niigata 951-8510, Japan Tel: +81-25-227-2116
Fax: +81-25-227-2116
E-mail: [email protected]
Abstract
Background: Infectious disease is the second leading cause of death among dialysis patients, and it is generally assumed that the mortality rate of infectious disease is considerably higher in dialysis patients than in the general population. There are no comprehensive studies on this issue and on the contribution of each category of infectious disease to excess mortality in dialysis patients in Japan.
Methods: We used mortality data reported to the Japanese Society for Dialysis Therapy and national Vital Statistics data for 2008 and 2009. We calculated standardized mortality ratios and compared the mortality rates for each category of infectious disease.
Results: During the 2-year study period, 274 683 and 10 435 deaths from infectious diseases were recorded in 126 million people and 273 237 dialysis patients, respectively. The standardized mortality ratio for all infectious diseases was 7.5 (95% confidence interval, 7.3–7.6) in dialysis patients with respect to the general population in Japan. The categories of infectious disease with a significantly higher standardized mortality ratio among the dialysis patients were sepsis, peritonitis, influenza, tuberculosis, and pneumonia and in that order. In particular, the mortality rate of sepsis contributed to 69.5% of the difference in infectious disease mortality between dialysis patients and the general population.
Conclusions: This study underlines markedly increased mortality from infectious diseases, particularly from sepsis, in dialysis patients compared with the general population.
Key Words: Dialysis, Epidemiology, Infection, Population, Sepsis, Standardized mortality ratio
Introduction
Each year more than 5 000 dialysis patients die from infectious diseases in Japan (1). According to the Japanese Society for Dialysis Therapy (JSDT) registry, infectious disease is the second leading cause of death among dialysis patients, and the percentage of patients who die as a result of infectious diseases has gradually increased (1). The mortality rates resulting from sepsis and pneumonia were reported to be markedly higher in dialysis patients compared with the general population in the United States (US) (2,3). In Japanese dialysis patients, it is generally assumed that mortality caused by infectious diseases is also higher compared with the general population, but no precise data about this issue has been presented. There are several differences concerning dialysis therapy between the US and Japan, such as type of blood access (4) and dialyzer reuse (5), which might affect mortality caused by infectious diseases. In addition, there has been no detailed investigation of the categories of infectious diseases in Japan associated with mortality. Infectious diseases encompass several categories of disease, such as sepsis, pneumonia, peritonitis, and tuberculosis, but the contribution of each infectious disease to the excess mortality in dialysis patients has never been analyzed. Identification of the categories of infectious diseases most associated with mortality would be important for establishing effective prevention strategies in patients with end stage renal disease.
The objectives of this study were: to determine whether the mortality rate of infectious diseases is higher in Japanese dialysis patients than in the general population; and to determine the extent to which different categories of infectious diseases contribute to mortality differences between the dialysis population and the general population. We
analyzed annual mortality rates related to infectious diseases in Japanese dialysis patients and compared them with rates derived from Japanese national Vital Statistics data.
Materials and Methods Sources of data
Mortality data of dialysis patients were extracted from the annual data reported by the Renal Data Registry Committee of JSDT for the years 2008 and 2009, and comprised a total of 51 423 deaths (6,7). The JSDT registry data collection techniques and the characteristics of the dialysis population have been described in detail elsewhere (1). Briefly, the JSDT registry collects data every year by questionnaires to all dialysis facilities in Japan. This registry collects information on medical history, treatment conditions, and outcomes of individual dialysis patients. As the characteristics of the patients may be associated with infection mortality, a brief summary is given here. For the year ending 31 December 2008, the percentage of patients treated by hemodialysis and peritoneal dialysis was 96.7% and 3.3%, respectively. Patients with diabetic nephropathy accounted for 34.2% of all dialysis patients. For hemodialysis, a native vessel arteriovenous fistula, an artificial vessel arteriovenous fistula, a superficial artery, a long-term implantable catheter, and a temporary venous catheter were used in 89.7%, 7.1%, 1.8%, 0.5%, and 0.5% of patients, respectively. The mean single-pool Kt/V (the fractional clearance of urea as a function of its distribution volume) (8) was 1.38 (standard deviation = 0.31). Of the facilities that responded to questions regarding the measurement of endotoxin concentration in the dialysate solution, 93.6% achieved the control standard of endotoxin concentration in the dialysate solution of <0.05 EU/mL,
and 97.4% achieved a bacterial count of <100 cfu/mL in the dialysate solution, as specified by the JSDT (9).
Mortality data for the general population were obtained from a national Vital Statistics survey. The National Vital Statistics Survey Form consists of five types of forms, Live Birth Form, Death Form, Fetal Death Form, Marriage Form, and Divorce Form. We used the data from the Death Form, which is based on Notification of Death, for years 2008 and 2009 and comprised a total of 2.28 million deaths (10,11).
Case definitions
Mortality due to infectious diseases was included in the analyses of both the JSDT data and the national Vital Statistics only if infectious disease was the underlying cause of death. Infectious diseases causing death were categorized according to the JSDT definition using the 10th modified edition of the International Classification of Diseases (ICD-10) codes (12) (Appendix). We combined mortality due to acute viral hepatitis and fulminant viral hepatitis to make one category because of the small numbers of deaths. It is important to note that the planned analyses did not compare case fatality rates, which is the ratio of deaths within patients presenting with an infection over a certain period of time, but rather annual mortality due to infection.
Data analyses
First, we analyzed annual mortality rates caused by all infectious diseases, which included not only definite infectious causes but also suspected infectious causes of death. Then, we analyzed annual mortality rates caused by specific infectious disease categories,
which included only cases with a definite infectious cause of death.
Both the dialysis patients and the general population were categorized into five age groups: 0–29, 30–44, 45–59, 60–74, and ≥75 years. Mortality rates were calculated by the number of deaths divided by the number of person-years accumulated during the study period. The estimate of the number of person-years during the study period was obtained by multiplying the number of the population at the mid-point by 2 (13). We calculated the expected number of deaths by multiplying the total number of person-years during the study period by the corresponding age-specific mortality rate for the general population. Standardized mortality ratios (SMRs) were then calculated as the ratio between the observed and the expected number of deaths. Confidence intervals (CIs) for the SMRs were calculated using the normal approximation to the Poisson distribution (14). The SMR can be interpreted as the relative difference in the mortality rate among the dialysis patients compared with that of the general population. We calculated the age-adjusted mortality rate difference to determine whether there was excess mortality in dialysis patients compared with the general population on an absolute scale. We also calculated the percent difference in mortality rate for all infectious diseases, to determine the contributions of specific infectious diseases to any differences between dialysis patients and the general population in all infectious disease mortality (15).
Results
During the 2-year study period, 274 683 and 10 435 infectious deaths were recorded in 126 million of the general population and in 273 237 dialysis patients,
10 000 person-years in the general population and the dialysis populations, respectively (Table 1). The SMR for all infectious diseases was 7.5 (95% CI, 7.3–7.6) for the dialysis patients with respect to the general population.
Of the 3 291 deaths arising from a specific infection, the categories with significantly higher SMRs in dialysis patients were sepsis, peritonitis, influenza,
tuberculosis, pneumonia, and other infectious diseases (ICD-10 codes in Appendix). The top two categories were sepsis and peritonitis. Compared with the general population, the SMRs for sepsis and peritonitis were 14.3 (95% CI, 13.5–15.0) and 9.9 (95% CI, 8.2– 11.8), respectively, for the dialysis patients. The mortality rates arising from sepsis and peritonitis were markedly higher in dialysis patients compared with the general
population, being 30- and 25-fold higher, respectively, in the 60–74-year-old age group (Figure 1A and B). The mortality rate arising from pneumonia was 4-fold higher in the same age group (Figure 1C). The mortality rates of other categories of infectious diseases also increased with age among dialysis patients (data not shown).
The pattern of infectious causes of death was different across the age groups (Table 2). With increasing age, the proportion resulting from sepsis decreased, whereas the proportion resulting from pneumonia increased. Although death from pneumonia constituted 46.1% of all infectious disease deaths, the age-adjusted mortality rate
difference between dialysis patients and the general population was smaller than that for sepsis. Sepsis contributed to 69.5% of the difference in all infectious disease deaths among dialysis patients and the general population, despite sepsis deaths constituting only 42.9% of all infectious disease deaths. The overall mortality rate of sepsis was 0.79
and 25.86 per 10 000 person-years in the general population and in dialysis patients, respectively.
Discussion
The present study demonstrates that infectious disease mortality was markedly higher in Japanese dialysis patients compared with that in the general population. We found that the SMRs differed according to the infectious disease categories, and that sepsis and peritonitis exhibited particularly high SMRs.
Development of sepsis and peritonitis could be influenced by the dialysis procedure. Catheter use for hemodialysis blood access is a well-known risk factor for sepsis (16,17), and peritonitis is a well-known cause of mortality in peritoneal dialysis patients (18). Regarding SMRs, we did not expect peritonitis to be ranked second, because peritoneal dialysis patients accounted for only 3.3% of the total dialysis
population in Japan. We present two possible explanations for this. One possibility is that peritonitis mortality was very low in the general population, thus the SMR for peritonitis in dialysis patients could be apparently high, even when the peritonitis mortality among these patients is not obviously high. The other possibility is that peritonitis in
hemodialysis patients also contributed to the deaths. Further research is needed to investigate the association between infectious disease mortality and dialysis modality among Japanese dialysis patients.
The SMR for pneumonia was apparently lower than that for sepsis or peritonitis. In the ≥75 year-old age group, there was no difference in mortality rates arising from pneumonia between dialysis patients and the general population. These results suggest
that death from pneumonia in the elderly dialysis patients might be related to age rather than to end stage renal disease.
Our study also found that sepsis contributed to a major proportion of the overall difference in infectious disease mortality between dialysis patients and the general population. This finding indicates that prevention and treatment of sepsis is one of the most important issues to address to reduce infection-related deaths in dialysis patients. Although the observed mortality for sepsis in the general population was comparable in Japan to that in the US (0.008 per 100 person-years (2)), the mortality for sepsis among dialysis patients in our study was approximately one-tenth of that in the US, which has been reported to be 2.117 and 3.023 per 100 person-years for hemodialysis and peritoneal dialysis patients, respectively (2). This discrepancy may be partly because of differences in the survey technique between the two studies. Nevertheless, it is apparent that the mortality rate associated with sepsis in dialysis patients is clearly higher than in the general population both in Japan and the US.
Several risk factors for sepsis in dialysis patients have been identified or
suggested, including older age, diabetes, low serum albumin, type of vascular access, iron overload, and dialyzer reuse (16,17,19,20). However, our results could not be an age-related effect, because we adjusted for age. A higher proportion of diabetic patients among dialysis patients and a poorer nutritional state than in the general population might have some bearing on the results. It could not be explained completely by the type of vascular access, iron overload, and dialyzer reuse, because of the widespread use of a native arteriovenous fistula for blood access (4), the lowest rate of intravenous iron use among 12 countries in the Dialysis Outcomes and Practice Patterns Study (21), and no
dialyzer reuse in Japan. Therefore, further research is warranted for more detailed analysis of the risk factors among Japanese dialysis patients.
Our study showed that the dialysis-related increase in age-adjusted mortality rates differed according to the infectious disease. Interaction of three pivotal factors, including host immunity, virulence of pathogens, and the dialysis procedure per se, might be associated with infection among dialysis patients (22). The findings of this study indicated the possibility that this interaction could differ among the different infectious disease categories. We also found that the pattern of infectious causes of death was different across the age groups. Thus, we recommend further research to assess the risk factors for each category of infectious disease and for each age group in Japanese dialysis patients.
Some limitations of the present study should be discussed. First, we included cases in the analyses only if infectious disease was the underlying cause of death. Our analysis may have underestimated the magnitude of the mortality caused by infection, because infection is also associated with cardiovascular events and deaths (17,20). In addition, the mortality from specific infectious disease categories could also be
underestimated among the dialysis patients, as the JSDT registry distinguishes definite causes from suspected causes of death. We included in the analyses only those infectious diseases which were noted as the definite cause of death, because we did not have
information on deaths suspected to result from infectious disease. Definite causes of death were available for only one quarter of the total deaths in the JSDT registry; thus, mortality from specific infectious disease categories could be underestimated. Second, the validity of the death diagnosis could not be confirmed. However, as our study used
the ICD-10 codes for definition of cause of death in both surveys, we consider it unlikely that this would introduce bias in the present results. Third, the SMRs were adjusted only for age. Finally, our study did not show case fatality rates, which is the ratio of deaths among patients presenting with a particular condition. Thus, we could not answer the following question: do dialysis patients have a higher risk of suffering an infection, or a higher risk of death caused by an infection, or both?
Despite these limitations, this study has several strengths. Our study used data from a national Vital Statistics survey and a nationwide survey of Japanese dialysis facilities. Both surveys are an almost complete national census. In addition, we comprehensively evaluated mortality caused by infectious diseases among Japanese dialysis patients compared to the general population using the SMRs, which can help to adjust for population age differences to better understand the relative mortality risk. Finally, our findings indicate that there are many unresolved issues concerning deaths from infectious disease in Japanese dialysis patients. We believe that the suggested future research would make a very valuable contribution to our knowledge in order to provide better care for dialysis patients.
Conclusions
Our study underlines that marked differences exist between the dialysis
population and the general population in mortality from infectious diseases, particularly from sepsis. Because the percentage of dialysis patients who die as a result of infectious disease has gradually increased in Japan, further investigation is urgently required to decrease infection-related mortality in these patients.
Acknowledgement
We thank the Committee of the Renal Data Registry of the Japanese Society for Dialysis Therapy for permission to use their data. The opinions reflected in this
manuscript are those of the authors alone and do not reflect the official position of JSDT. None of the authors have any conflicts of interest associated with this study.
References
1. Nakai S, Suzuki K, Masakane I et al. An overview of regular dialysis treatment in Japan (as of 31 December 2008). Ther Apher Dial 2010;14:505–40.
2. Sarnak MJ, Jaber BL. Mortality caused by sepsis in patients with end-stage renal disease compared with the general population. Kidney Int 2000;58:1758–64.
3. Sarnak MJ, Jaber BL: Pulmonary infectious mortality among patients with end-stage renal disease. Chest 2001;120:1883–7.
4. Ethier J, Mendelssohn DC, Elder SJ et al. Vascular access use and outcomes: an international perspective from the Dialysis Outcomes and Practice Patterns Study. Nephrol Dial Transplant 2008;23:3219–26.
5. Brown C. Current opinion and controversies of dialyser reuse. Saudi J Kidney Dis Transpl 2001;12:352–63.
6. Patient Registration Committee. Cause of death. In: Tsubakihara Y, ed. An overview of regular dialysis treatment in Japan as of Dec. 31, 2008 CD-ROM. Tokyo, Japan: Japanese Society for Dialysis Therapy. 2009; Tables 123 and 150.
7. Patient Registration Committee. Cause of death. In: Tsubakihara Y, ed. An overview of regular dialysis treatment in Japan as of Dec. 31, 2009 CD-ROM. Tokyo, Japan: Japanese Society for Dialysis Therapy. 2010; Tables 115 and 142.
8. Shinzato T, Nakai S, Fujita Y et al. Determination of Kt/V and protein catabolic rate using pre- and postdialysis blood urea nitrogen concentrations. Nephron
1994;67:280–90.
9. Nakai S, Masakane I, Shigematsu T et al. An overview of regular dialysis treatment in Japan (as of 31 December 2007). Ther Apher Dial 2009;13:457–504.
10. Bureau of Census, Ministry of Internal Affairs and Communications. Vital statstics of Japan 2008. http://www.e-stat.go.jp/SG1/estat/GL08020103.do?_toGL
08020103_&listID=000001057801&disp=Other&requestSender=dsearch (Accessed July 23, 2011).
11. Bureau of Census, Ministry of Internal Affairs and Communications. Vital statstics of Japan 2009. http://www.e-stat.go.jp/SG1/estat/GL08020103.do?_toGL
08020103_&listID=000001066499&disp=Other&requestSender=dsearch (Accessed July 23, 2011).
12. Patient Registration Committee, Japanese Society for Dialysis Therapy, Tokyo, Japan. An overview of regular dialysis treatment in Japan as of 31 December 2003. Ther Apher Dial 2005;9:431–58.
13. Jacques Esteve, Ellen Benhamou, Luc Raymond. Techniques for the analysis of Cancer Risk. In: Statistical Methods In Cancer Research: Volume IV: Descriptive
Epidemiology. Lyon, France: International Agency for Research on Cancer, 1994;49–105. 14. Morris JA, Gardner MJ. Epidemiological studies. In: Statistics with Confidence, 2nd ed. London, UK: BMJ books, 2000;57–72.
15. Richardus JH, Kunst AE. Black-white differences in infectious disease mortality in the United States. Am J Public Health 2001;91:1251–3.
16. Powe NR, Jaar B, Furth SL et al. Septicemia in dialysis patients: incidence, risk factors, and prognosis. Kidney Int 1999;55:1081–90.
17. Ishani A, Collins AJ, Herzog CA et al. Septicemia, access and cardiovascular disease in dialysis patients: the USRDS Wave 2 study. Kidney Int 2005;68:311–8.
18. Pérez Fontan M, Rodríguez-Carmona A, García-Naveiro R, et al. Peritonitis-related mortality in patients undergoing chronic peritoneal dialysis. Perit Dial Int 2005;25:274–84.
19. Boelaert JR, Daneels RF, Schurgers ML et al. Iron overload in haemodialysis patients increases the risk of bacteraemia: a prospective study. Nephrol Dial Transplant 1990;5:130–4.
20. Foley RN, Guo H, Snyder JJ et al. Septicemia in the United States dialysis population, 1991 to 1999. J Am Soc Nephrol 2004;15:1038–45.
21. Pisoni RL, Bragg–Gresham JL, Young EW et al. Anemia management and outcomes from 12 countries in the Dialysis Outcomes and Practice Patterns Study (DOPPS). Am J Kidney Dis 2004;44:94–111.
22. Jaber BL. Bacterial infections in hemodialysis patients: pathogenesis and prevention. Kidney Int 2005;67:2508–19.
Figure legend
Figure 1. Mortality rates due to sepsis (A), peritonitis (B), and pneumonia (C) among dialysis patients (black line) compared with the general population (gray line).
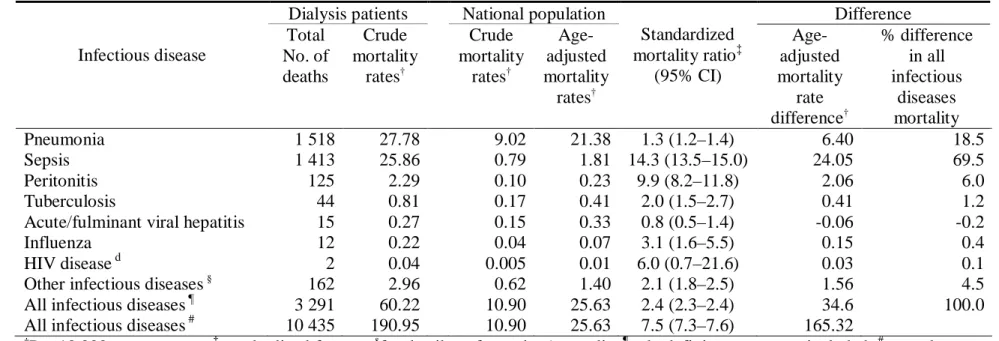
Table 1. Differences between dialysis patients and the general population in mortality associated with specific infectious disease categories
Infectious disease
Dialysis patients National population
Standardized mortality ratio‡ (95% CI) Difference Total No. of deaths Crude mortality rates† Crude mortality rates† Age-adjusted mortality rates† Age-adjusted mortality rate difference† % difference in all infectious diseases mortality Pneumonia 1 518 27.78 9.02 21.38 1.3 (1.2–1.4) 6.40 18.5 Sepsis 1 413 25.86 0.79 1.81 14.3 (13.5–15.0) 24.05 69.5 Peritonitis 125 2.29 0.10 0.23 9.9 (8.2–11.8) 2.06 6.0 Tuberculosis 44 0.81 0.17 0.41 2.0 (1.5–2.7) 0.41 1.2
Acute/fulminant viral hepatitis 15 0.27 0.15 0.33 0.8 (0.5–1.4) -0.06 -0.2
Influenza 12 0.22 0.04 0.07 3.1 (1.6–5.5) 0.15 0.4
HIV disease d 2 0.04 0.005 0.01 6.0 (0.7–21.6) 0.03 0.1
Other infectious diseases§
162 2.96 0.62 1.40 2.1 (1.8–2.5) 1.56 4.5
All infectious diseases ¶ 3 291 60.22 10.90 25.63 2.4 (2.3–2.4) 34.6 100.0
All infectious diseases # 10 435 190.95 10.90 25.63 7.5 (7.3–7.6) 165.32 †
Per 10 000 person-years; ‡standardized for age; §
for details, refer to the Appendix; ¶only definite cases were included; #not only definite cases but also suspected cases were included.
Table 2. Causes of death stratified by age among dialysis patients
Age Category, No. (%)† Cause of death
All <30 y 30–44 y 45–59 y 60–74 y ≥75 y
No information
available
All infectious diseases‡ 3 291 (100.0) 4 (100.0) 29 (100.0) 230 (100.0) 1 279 (100.0) 1 747 (100.0) 2
Pneumonia 1 518 (46.1) 2 (50.0) 8 (27.6) 49 (21.3) 505 (39.5) 953 (54.6) 1
Sepsis 1 413 (42.9) 1 (25.0) 19 (65.5) 144 (62.6) 633 (49.5) 616 (35.3) 0
Peritonitis 125 (3.8) 0 (0) 1 (3.5) 16 (7.0) 62 (4.8) 45 (2.6) 1
Tuberculosis 44 (1.3) 0 (0) 0 (0) 1 (0.4) 18 (1.4) 25 (1.4) 0
Acute / fulminant viral hepatitis
15 (0.5) 0 (0) 0 (0) 1 (0.4) 7 (0.5) 7 (0.4) 0
Influenza 12 (0.4) 0 (0) 0 (0) 2 (0.9) 5 (0.4) 12 (0.7) 0
HIV disease 2 (0.1) 0 (0) 0 (0) 0 (0) 1 (0.1) 1 (0.1) 0
Other infectious diseases § 162 (4.9) 1 (25.0) 1 (3.5) 17 (7.4) 48 (3.8) 95 (5.4) 0
†
The value in parentheses is the percentage of patients with respect to the total number of deaths in each age category; ‡only definite cases were included; §for details, refer to the Appendix.
Figure 1.
B
Age, years
Dialysis patients General populationM
o
rta
lity
r
ate
,
pe
r 1
0
,000 pe
rs
on
-yea
rs
M
o
rta
lity
r
ate
,
pe
r 1
0
,000 pe
rs
on
-yea
rs
Dialysis patients General populationAge, years
A
30-fold 25-foldC
Age, years
4-fold Dialysis patients General populationM
o
rt
ality
r
ate
,
pe
r 1
0
,000 pe
rs
on
-yea
rs
Appendix. List of infectious diseases and related ICD-10 codes
Infectious diseases ICD-10 codes
Tuberculosis Sepsis
Acute / Fulminant viral hepatitis
Human immunodeficiency virus disease Influenza
Pneumonia Peritonitis
Other infectious diseases
A15-A19 A40-A41 B15, B16, B17, K72.0 B20-B24 J10 - J11 J12-J18 K65
A00-A09, A20-A39, A42-A99, B00-B09, B25-B99, G00 - G09