* Corresponding to: FENGYUN Liu
Graduate School of Economics, Ritsumeikan University 1-1-1 Nojihigashi, Kusatsu, Shiga 525-8577 Japan E-mail: [email protected]
査読論文
The Impact of Financial Openness and Bank
Restructuring Reform from 2003 on Funds Invested in
Real Estate in China : An Institutional Study
FENGYUN Liu
*Abstract
Based on the historical and institutional analysis, this paper examines the impact of financial openness, and bank restructuring reform since 2003 on funds invested in real estate. The study finds that financial openness reform increased foreign fund inflow and foreign exchange reserves, thus increased base money and money supply. This resulted in an increase of the funds invested in real estate. Bank restructuring reform expanded the banking sector’s abilities in financing and money management, and increased monetary multiplier and money supply and subsequently investment in real estate.
Keywords
Funds invested in real estate, Financial openness, Bank restructuring reform.
1 Introduction
The financial industry and the real estate industry are inseparable. The recent crises, the Asian crisis in 1997 and the US crisis in 2008, were caused by excessive financial expansion to the real estate industry. In the 2000’s, the Chinese real estate industry developed, and flourished. The investment completed by the real estate development enterprises ascended from 498.4 billion RMB in 2000 to 6179.6 billion RMB in 2011. Since then, and especially since 2003, house prices have been soaring. The average commercialized building price increased from 2063 Yuan/sq. m. in 1999 to 2359 Yuan/sq.
m. in 2003, and reached 5357 Yuan/sq. m. in 2011. Liang and Cao (2007) and Zhou (2005) propose that the expansion of bank loans to the real estate industry resulted in higher house prices. Xiong (2007) and Hu (2009) assert that excessive money supply and liquidity led to the expansion of banking credit, and eventually generated a surge in house prices. The common ground of these studies is that the increasing funds invested in real estate boosted the soaring house prices in China. Liu (2013) suggests that the financial reforms since 2003 led to a stronger impact of money supply on commercialized building prices than before. Moreover, the real estate bubble tends to accompany financial reform and financial liberalization such as the Japanese real estate bubble in the 1980’s. Nowadays, China seems to face a similar situation with financial openness and the anticipation of Renminbi (RMB) appreciation. After entering the World Trade Organization (WTO) in 2011, China started the process of financial openness. Then qualified foreign institutional investors (QFII) first invested in China in 2003. Since then foreign funds have been increasingly flowing into China. To meet new challenges created by foreign banks since the financial openness, Chinese banks started bank restructuring reform in 2003. The four state-owned banks became joint-stock banks, and were listed on the securities market. What was the impact of financial openness and bank restructuring reform on funds invested in real estate, and how they affected? These problems have never been clearly analyzed by the existing literature in China. Consequently, this paper tries to shed light on these problems based on historical and institutional analysis, and aims to fill some gaps in this field of study and propose some guidance for financial reform and house price regulation and control.
The remainder of this paper is as follows. Section 2 reviews related literature. Section 3 analyzes the characteristics of financial system and fund flow before 2003. Section 4 examines the influences of financial openness and bank restructuring reform on money supply and thus funds invested in real estate, and how they affected. Section 5 outlines conclusions, and policy implications.
2 Literature Review on Financial Reform and the Real Estate Industry
The role of financial factor in economic activities is proposed by Schumpeter (1911). He stresses the important role of financial intermediaries in mobilizing funds, managing risk, monitoring corporations, and reducing trading costs. Patrick (1966), Lewis (1955), Goldsmith (1969), MacKinnon (1973) and Shaw (1973) further confirm the positive
relationship between financial development and economic growth theoretically. The same findings are also held by recent empirical studies, such as Guiso et al. (2004), a cross country study by Gregorio and Guidotti (1995), and the panel data of 80 countries over the period of 1960 to1989 analyzed by King and Levine (1993), Beck et al (2000) of 32 countries over the period of 1980-1995, and Levine (2002) of 48 countries over the 1980-1995 period. However, each country has its own characteristics in different financial development stages. More specific studies according to countries and stages are required.
Levine and Zervos (1998) argue that financially deep markets have high capital market liquidity which increases the intrinsic value of assets. Ebrahim and Hussain (2010) study the impact of financial development on asset valuation and focus on cross-sectional risk-sharing and agency costs. This study was based on the complete market contracting hypothesis which cannot be achieved in developing countries. Since Japan experienced the financial reform and real estate bubble in the 1980’s, some literature started to discuss the role of financial reform in the real estate bubble from the institutional aspect. Miyazaki (1992) asserts that financial liberalization in the early 1980’s, the Plaza Accord and finance deregulation in the late 1980’s stimulated the emergence of the bubble. Accounting easing policies, financial changes in corporations, amplification of banking credits enhanced the expansion of the bubble. These institutional changes and reforms brought massive “M2+CD” and banking credit flowing into the real estate industry, which inflated stock prices and land prices beyond their real value. Okina et al. (2001) and Shiratsuka (2003) suggest that the following factors resulted in the emergence of the bubble: aggressive behavior of financial institutions; the progress of financial deregulation; inadequate risk management on the part of financial institutions; introduction of the Capital Accord; protracted monetary easing; taxation and regulations biased towards accelerating the rise of land prices; overconfidence and euphoria; overconcentration of economic functions in Tokyo. Hoshi and Kashyap (2000, 2001) assert that because large and well-known manufacturing firms substantially reduced their dependence on bank financing by issuing bonds during the 1980’s, banks increased lending to medium and small corporations. Most of them were connected to the real estate industry. These studies confirm the important role of the financial reform in the 1980’s in driving a massive money supply and bank credit into the real estate industry in Japan. Similar to the 1980’s in Japan, accompanying financial openness and bank restructuring reform, there are also massive funds invested in real estate in current China. Xiong (2007), Hu (2009), and Liu (2013) find that excessive money supply and liquidity had a significant impact on increase in house prices. Zhou (2005) and Liang and Cao (2007) state that the expansion of banking credit causes upswings in house
prices. Thus, the influence of financial openness reform and bank restructuring reform on money supply and thus funds invested in real estate in China deserves further discussion.
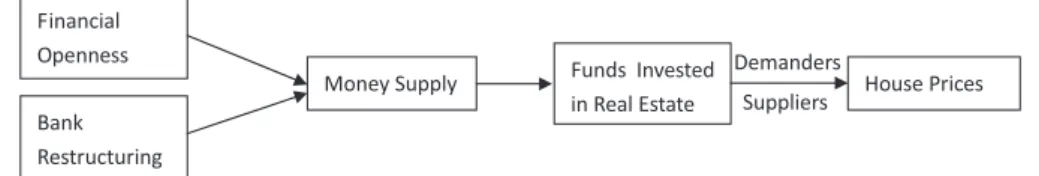
The process of financial openness and bank restructuring reform from 2003 affecting funds invested in real estate and house prices is shown in Figure 1. This paper will focus on how financial openness and bank restructuring reform influence money supply and thus funds invested in real estate.
Figure 1 Process of Financial Openness and Bank Restructuring Reforms Affecting the Funds Invested in Real Estate and House Prices
3 Financial System and Fund Flow Before 2003
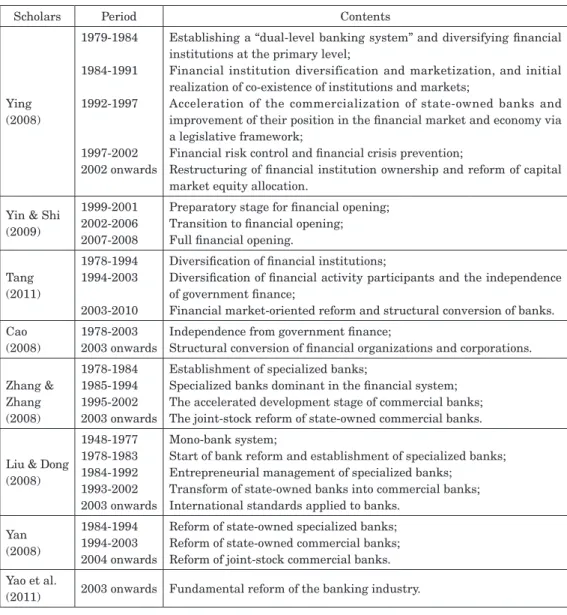
There are many existing studies which discuss the process of Chinese financial reform since 1978 and divide it into several stages, as shown in Table 1. These studies separate the Chinese financial reform into different stages. They all assent to that, since 2003 the Chinese financial or banking sector experienced a different and fundamental reform, and the financial reform mainly consists of financial openness and bank restructuring. To have a good comparative understanding of the situation since 2003, we will first discuss the financial system and fund flow before 2003. According to the literature cited, we divide the stage prior to 2003 into the stage from 1949 to 1978 and the one from 1978 to 2003.
3.1 Financial System and Fund Flow from 1949 to 1978
Under the centralized planned economic system, there emerged a centralized state banking system. The People’s Bank of China (PBC) was established on December 1st,
1949, based on merges of the Bank of North China, the Beihai Bank, and the Bank of Northwest Peasantry in the liberated area. The PBC was confined as the socialistic state bank. Although the People’s Construction Bank of China, the Bank of China, the Agricultural Bank of China, the Rural Credit Cooperatives, and the People’s Insurance Company of China were established and abolished several times, they were just derivative organizations of the Treasury and the PBC rather than independent financial institutions.
All the joint public-private banks were absorbed into the PBC. At the end of 1957, the mono-banking system was formed, in which there was only one bank – the PBC, and branches of the PBC were established all over the country according to the hierarchy of the administrative divisions. The other financial institutions - the Bank of China and the Rural credit cooperatives – were subordinate units of the PBC.
The PBC functioned both as a central bank and as a commercial bank. It performed the duties of collecting idle money as short-term credit to promote industrialization of the country and socialist transformation, making liquidation for the state operated economy
Table 1 Related Literature on the Process of Chinese Financial Reform
Scholars Period Contents
Ying (2008) 1979-1984 1984-1991 1992-1997 1997-2002 2002 onwards
Establishing a “dual-level banking system” and diversifying financial institutions at the primary level;
Financial institution diversification and marketization, and initial realization of co-existence of institutions and markets;
Acceleration of the commercialization of state-owned banks and improvement of their position in the financial market and economy via a legislative framework;
Financial risk control and financial crisis prevention;
Restructuring of financial institution ownership and reform of capital market equity allocation.
Yin & Shi (2009)
1999-2001 2002-2006 2007-2008
Preparatory stage for financial opening; Transition to financial opening; Full financial opening. Tang
(2011)
1978-1994 1994-2003 2003-2010
Diversification of financial institutions;
Diversification of financial activity participants and the independence of government finance;
Financial market-oriented reform and structural conversion of banks. Cao
(2008)
1978-2003 2003 onwards
Independence from government finance;
Structural conversion of financial organizations and corporations. Zhang & Zhang (2008) 1978-1984 1985-1994 1995-2002 2003 onwards
Establishment of specialized banks;
Specialized banks dominant in the financial system; The accelerated development stage of commercial banks; The joint-stock reform of state-owned commercial banks. Liu & Dong
(2008) 1948-1977 1978-1983 1984-1992 1993-2002 2003 onwards Mono-bank system;
Start of bank reform and establishment of specialized banks; Entrepreneurial management of specialized banks;
Transform of state-owned banks into commercial banks; International standards applied to banks.
Yan (2008)
1984-1994 1994-2003 2004 onwards
Reform of state-owned specialized banks; Reform of state-owned commercial banks; Reform of joint-stock commercial banks. Yao et al.
and cooperatives, and supervising the circulation and allocation of agricultural products and commodities. Credit activities were limited to the PBC, and credit between enterprises was prohibited. All bank credit was totally planned and controlled by the central government. Deposit collection and loan allocation were conducted by the headquarters of the PBC. However, the fixed funds and circulation funds needed by enterprises were allocated by the Treasury. Only that part of the circulation funds which exceeded the allocation quota, came from bank loans which were short-term credit less than 1 year. During this period, fiscal allocation was mismatched, because the Treasury allocated most of funds to the industrial sector to promote it over the service sector. Consequently, the PBC was only an administrative institution to manage the funds strictly. Furthermore, the PBC was officially merged into the Treasury in 1969.
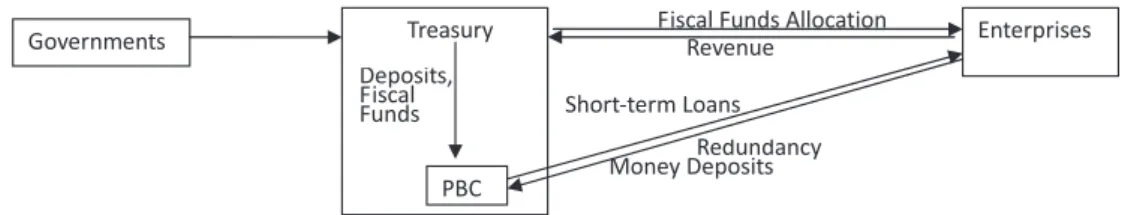
Therefore, characteristics of fund flow from 1949 to 1978 could be shown in Figure 2. As shown by Wang and Guo (2008), there were four characteristics in the planned economy period: “Big Treasury and small finance”, that is, the financial system was subordinated to the Treasury; the PBC played the role of both a central bank and a commercial bank; the centralized planned management of the banking sector; there was no credit between enterprises. Although subsequent financial reforms changed these characteristics, the independence of the banking sector on the National Treasury in planned period still has great influences to the recent financial reforms. Because the PBC was a subordinate unit of the Treasury, next reform focused on the independence of the PBC from 1978 to 2003. Additionally, bank restructuring reform since 2003 to reduce the dependence on the state also rooted from the subordinate relationship of the PBC to the Treasury.
Figure 2 Characteristics of Fund Flow from 1949 to 1978
3.2 Financial System and Fund Flow from 1978 to 2003
The Third Plenary Session of the 11th Central Committee of the Communist Party of China was held on December 18th, 1978, and promoting the economic development was
set as a strategic goal. A series of reform had been implemented, including the financial system. Financial reform of this period focused on the independence of the financial sector
from the National Treasury. After these reforms, the bank-based financial system had been found.
The Agricultural Bank of China (ABC), the Bank of China (BOC) and the People’s Construction Bank of China (the predecessor of China Construction Bank (CCB)) were separated from the People’s Bank of China to take charge of the rural reform support business, the foreign exchange business and the long-term construction fund business respectively in 1979. The People’s Bank of China was set as the specialized central bank in 1984. Since then, the PBC merely took the duty of the central bank, and the general banking businesses which the PBC used to do were transferred to the Industrial and Commercial Bank of China (ICBC). According to the “Law of the People’s Bank of China” issued in 1995 and revised in 2003, the PBC is forbidden to lend to or borrow from the government finance and to buy or sell the treasury bonds or other government bonds directly. Then, the PBC became independent of the Treasury in the law.
Since February of 1982, replacing the direct and total control on credit by the headquarters of the PBC, banks had some freedom on lending within a fixed difference between the total deposits and the total loans. The operating funds and fixed funds of the state-owned enterprises were required to borrow from banks as the loan since July, 1983 and January, 1985 respectively, instead of the direct fiscal allocation before then. However, bank loans were still required to follow the planned fiscal expenditure. Lending interest rates were set to match the industrial policies, and even additional bank loans were provided to bad performed state-owned enterprises to prevent their bankruptcies although they could not return the money. As a result, the four giant state-owned specialized banks were tied in the problem of non-performing loans. To separate the four giant state-owned specialized banks from the government finance, a series of reforms were conducted. In 1994, the three policy banks (the China Development Bank, the Import and Export Bank of China and the Agricultural Development Bank of China) were found to take over the policy finance from the four giant state-owned specialized banks which then changed into the four giant state-owned commercial banks. In November, 1998, the National Treasury injected 270 billion capitals to the four giant state-owned commercial banks by issuing special treasury bonds. Then, four financial asset management companies (Xinda, Dongfang, Changcheng and Huarong) were found in 1999 to buy 1400 billion RMB non-performing loans from the four banks. After these reforms, although the four banks no longer took policy finance businesses, and had more capitals and a relieved non-performing loans problem, they were still not independent from the direct state control because of the
overwhelming state-owned ownership. Thus the next reform of bank restructuring started since 2003.
In 1986, the Chinese government decided to introduce the joint stock commercial bank, and the Bank of Communications was reset in July with 2 billion RMB capitals from the State Council. In 1987, the second largest joint stock commercial bank – the CITIC Industrial Bank (the name changed into CITIC Bank in 2005) - was founded. Since then, another 4 joint stock commercial banks were set from 1987 to 1988, and another 5 were established after the Deng Xiaoping’s south tour speech in 1992.
In October, 1978, the first non-bank financial institutions – the China International Trust and Investment Corporation (CITIC) was found, and first issued 10 billion Private Placement Bond in Japan in 1982. The Law of Trusts was issued in 2001.
At the same time, the securities sector and the insurance sector also developed. In September of 1984, the first joint-stock companies – Tianqiao department store was founded. The Shanghai Stock Exchange and the Shenzhen Stock Exchange were established in December of 1990 and July of 1991 respectively. The China Securities Regulatory Commission was set in 1992. The life insurance business was lifted the ban in 1982, and the China Insurance Regulatory Commission (CIRC) was founded in 1998. However, the securities sector and the insurance sector were still much smaller than the banking sector, and the majority of financing activities was still conducted by bank credit.
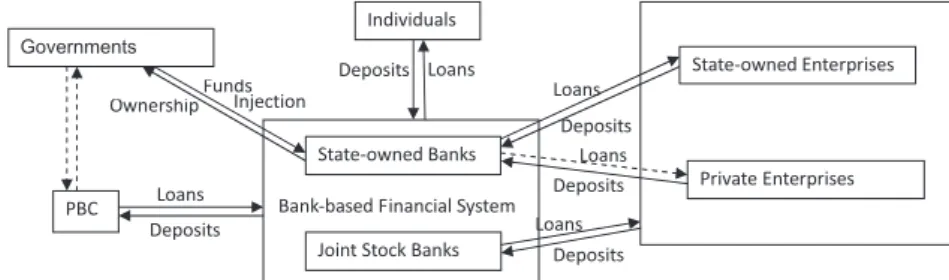
Therefore, the characteristics of fund flow from 1978 to 2003 could be shown as Figure 3. After the reforms of this period, the PBC became independent of the government finance. However, the four state-owned banks were still dependent on the government finance which had tied the state-owned banks in problems of non-performing loans and low capital level. To face the competition after entering the WTO, accompanying financial openness, bank restructuring reforms started since 2003 to reduce the ownership of the state.
Figure 3 Characteristics of Fund Flow from 1978 to 2003
4 Financial System, Money Supply and Funds Invested in Real Estate Since 2003
According to the literature on financial reform cited in Section 3, the Chinese financial system has experienced a fundamental reform since 2003. As the International Monetary Fund (IMF) and the World Bank (2012) confirms, the banking system has undergone tremendous change in China in the recent period, such as the establishment of the China Banking Regulatory Commission (CBRC) in 2003, the strengthening of financial sector regulation and supervision, the conversion of four large state-owned banks into joint-stock companies, the consolidation of rural credit cooperatives, the restructuring of joint-stock banks and securities companies, and the reform of the insurance sector. Financial openness and bank restructuring reform are the major content of the financial reform since 2003. 4.1 Impact of Financial Openness on Funds Invested in Real Estate
4.1.1 Financial Openness
After entering into the WTO in 2001, the Chinese market started to open to the outside world. According to the “Protocol on the Accession of the People’s Republic of
China”, foreign financial institutions would be allowed to provide service for local currency
business to all Chinese clients without geographic restrictions within five years after accession to the WTO. Since then, the banking sector, the securities sector, the insurance sector has opened to the foreign investors step by step.
Since December 11th, 2006, China fulfilled the commitments made on the banking
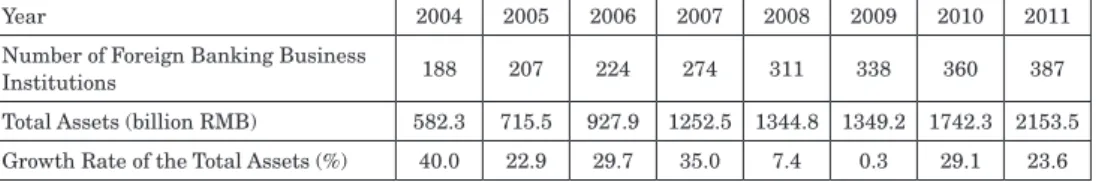
sector and fully opened the local currency businesses to foreign banks. The number of foreign banking business institutions was increasing from 2004 to 2011, shown in Table 2. Foreign investment in Chinese banks reached a peak from 2004 to 2006, because 4 banks of the 5 giant ones, 9 of the 12 national joint stock commercial banks and 6 city commercial banks accepted foreign funds. Although the exact data is not available before 2004, the
Table 2 Number of Foreign Banking Business Institutions and Their Total Assets
Year 2004 2005 2006 2007 2008 2009 2010 2011 Number of Foreign Banking Business
Institutions 188 207 224 274 311 338 360 387 Total Assets (billion RMB) 582.3 715.5 927.9 1252.5 1344.8 1349.2 1742.3 2153.5 Growth Rate of the Total Assets (%) 40.0 22.9 29.7 35.0 7.4 0.3 29.1 23.6
Note: Foreign banking business institutions include head offices of legal institutions and their branches and subsidiaries, and branches of foreign banks.
foreign investment in Chinese banks was not as common as that after 2004 (Zhang, 2012). Moreover, the security sector and the insurance sector were also gradually open to foreign institutions according to the WTO entering commitments. The first Sino-foreign joint venture security company was founded on April 25th, 2003. The Swiss
Bank Corporation and Nomura Securities became the first group of qualified foreign institutional investors (QFII) on May 27th, 2003. There are 10 QFII in the end of 2003, and
1.9 billion dollar entered into the market. By the end of 2011, 110 QFII had been approved, and gotten the quota of 21.6 billion dollar on security investment. Figure 4 illustrates fund flow of QFII from 2003 to 2011. There had been an increase in emigrant remittance flow of QFII since 2003, and peaked at around 3.45 billion dollar in 2006. After that it dropped in 2007 and 2008, and jumped to the highest point of about 3.7 billion dollar in 2009. Net remittance of fund flow to China from QFII peaked in 2006 at approximately 3.40 billion dollar.
Figure 4 The Emigrant Remittance and Repatriation of Funds of QFII from 2003 to 2011 (Billion dollars)
Source: “The Monitoring Report of Cross-border Capital Flow in China (2011)” from the China State Administration of Foreign Exchange.
Furthermore, the exchange rate system of China has been reforming slowly to catch up with the world. The single exchange rate system of dollar currency peg was changed into that with the reference to a basket of currencies on July 21th, 2005, and the RMB against the dollar appreciated by 2% to 8.11. With the expectation of RMB appreciation, a great number of speculative funds flowed into China. Table 3 indicates hot money flow to China from 2001 to 2011. In 2001 and 2002, there was an outflow of hot money from China. Since 2003, however, the outflow has changed into inflow except 2006, and peaked at 76.8 billion dollar in 2004. There was a total hot money of 367 billion dollar flowing into China from 2003 to 2011.
Table 3 Hot Money Flow from 2001 to 2011 (Billion dollar)
Year 2001 2002 2003 2004 2005 2006 2007 2008 2009 2010 2011 Amount -25.7 -16.1 40.2 76.8 46.2 -27.4 57.8 32.7 29.1 75.0 36.6 Source: “The Monitoring Report of Cross-border Capital Flow in China (2011)” from the China State Administration of Foreign Exchange.
Based on the above analysis, financial openness brought a high level of foreign fund inflow. It had two effects on funds invested in real estate. Firstly, foreign funds could invest in the high profitable industry, such as the real estate industry. Secondly, foreign fund inflow could increase foreign exchange reserve, and the central bank has to issue domestic money to maintain the stability of the exchange rate, which could result in growth in base money and thus multiplied growth in money supply.
4.1.2 Financial Openness, Base money and Funds Invested in Real Estate
Financial openness could increase foreign funds which enter into not only the financial market but also other industries because of the more freedom on cross-border fund flow. For example, many scholars find positive interaction between financial openness and trade openness, such as Whitman (1969), Aizenman and Nay (2009), Ni and Zheng (2004) and Han (2004). Financial openness could boost international trade and thus boost foreign fund inflow to other industries as well.
According to the China Securities Regulatory Commission, there are mainly four kinds of foreign funds flowing into China: foreign trade surplus, foreign direct investment (Figure 5), funds raised from the securities market aboard (Table 4), and hot money (Table 3).
Figure 5 indicates growth rate of foreign direct investment (FDI) flow and its components from 1998 to 2011. FDI flow increased from 40.3 billion dollar in 1999 to 116.0 billion dollar in 2011, with the greatest growth rate of 23.6% in 2008. The major part of FDI was flowing to the manufacturing industry, accounting for 71.0% in 2004. However, since then, there was no obvious growth of FDI to the manufacturing industry, and its proportion tended to decline to 45.0% in 2011. It is followed by the FDI flowing to the real estate industry. Its share rose sharply from the lowest point of 9.0% (5.4 billion dollar) in 2005 to 23.2% (26.9 billion dollar) in 2011, with the greatest growth rate of 107.7% in 2007. The FDI flowing to the financial industry started from 2000. Although it accounted for only a small percentage from 0.2% in 2000 to 1.7% in 2011, it had a large growth rate since 2002. Interestingly, both the hot money flow in Table 3 and the FDI flowing into the real estate industry reached crests in 2004, 2007 and 2010, suggesting that the real estate
industry might be one of the main targets of foreign fund inflows. Consequently, with the openness of the Chinese financial market, there were increasing funds flowing into the real estate industry. Growth in foreign direct investment flow was attributed to the fictitious economy such as the real estate industry and the financial industry rather than the real economic sectors such as the manufacturing industry.
Figure 5 Growth Rates of the Foreign Direct Investment Flows (at right axis, %) and Its Components (at left axis, billion dollar) from 1998 to 2011
Source: China Statistical Yearbook (1999-2012).
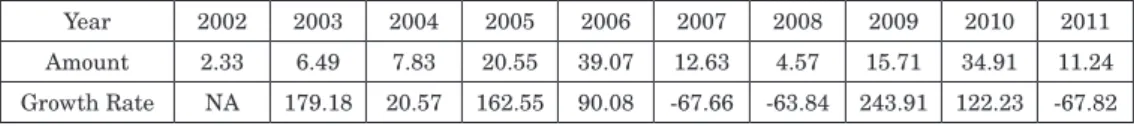
Table 4 shows fund flow raised from the securities market abroad from 2002 to 2011. It jumped drastically from 2.33 billion dollar in 2002 to 39.07 billion dollar in 2006, and then fell down in 2007 and 2008, and after that soared again to 34.91 billion dollar in 2010.
Table 4 Fund Flow Raised from the Securities Market Abroad from 2002 to 2011 (Billion dollar & %)
Year 2002 2003 2004 2005 2006 2007 2008 2009 2010 2011 Amount 2.33 6.49 7.83 20.55 39.07 12.63 4.57 15.71 34.91 11.24 Growth Rate NA 179.18 20.57 162.55 90.08 -67.66 -63.84 243.91 122.23 -67.82 Source: The China Securities Regulatory Commission.
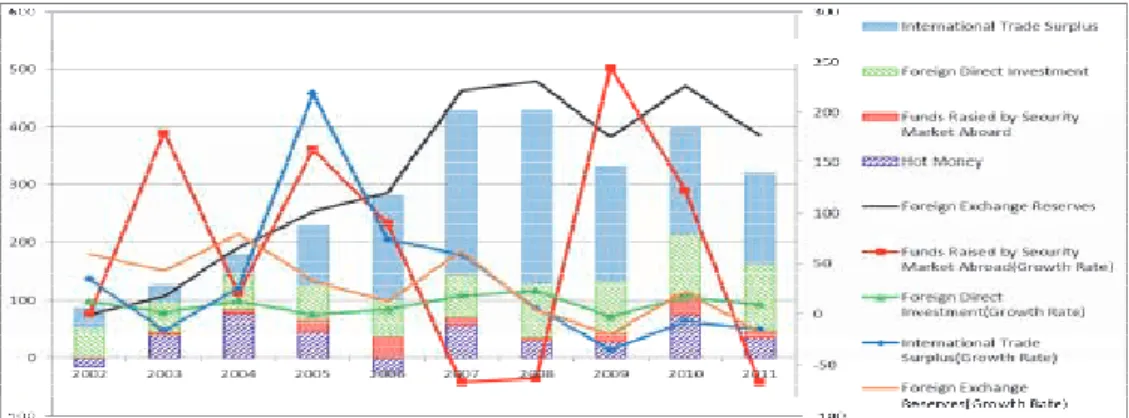
Accompanying growth in foreign fund inflow, foreign exchange reserves also increased. As shown in Figure 6, the largest part of foreign exchange reserve increment was attributed to foreign direct investment in 2002 and 2003, to hot money in 2004, and to international trade surplus from 2005 to 2011. From 2003 to 2011, the average ratio of international trade surplus against foreign exchange reserve increment was largest at 44.1%, followed by that of foreign direct investment at 26.7%, then by that of hot money at 15.5%, and the last was that of fund flow raised from the securities market aboard at
5.6%. Kraay (1998) develops an indicator for the financial openness by using the balance of international payments, that is, GDP divides summation of inflow and outflow of financial direct investment, investment in securities and other investments under the financial account. Lane and Miseli-Ferretti (2001, 2003, and 2007) develop this indicator with the stock data displacing the flow data. Huang (2007) also agrees this indicator and suggests improving it by the GDP at PPP. Based on these studies, we calculated the total average share of the latter three factors, 47.8%, even larger than the average share of international trade deficit, implying that financial openness had considerably strong positive influence on growth in foreign exchange reserves. Moreover, the fluctuation of the growth rate of foreign exchange reserves was most similar to that of foreign direct investment. Therefore, we cannot deny the contribution of movements in foreign direct investment to the changes in foreign exchange reserves.
Figure 6 Components (at left axis, billion dollar) of Foreign Exchange Reserve Increment and Their Growth Rates (at right axis, %) from 2002 to 2011
Notes: The variables in this figure are in flow data.
Source: “The Monitoring Report of Cross-border Capital Flow in China (2011)” from the China State Administration of Foreign Exchange, the China Securities Regulatory Commission, and China Statistical Yearbook (2002-2012).
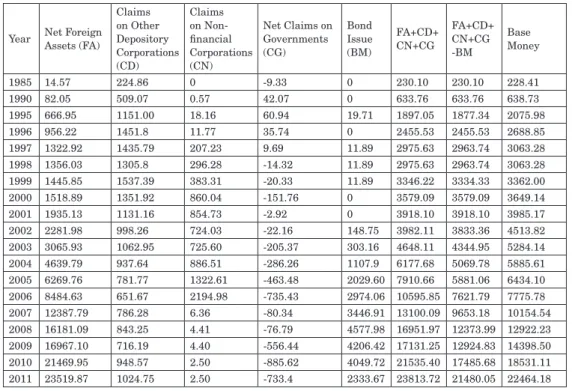
According to the balance sheet of monetary authority, to subtract the bond issued by the monetary authority from the sum of net foreign assets, claims on other depository corporations, claims on non-financial corporations and net claims on governments, and the residual is very close to the base money (Li, 2007). Table 5 shows components of base money from 1985 to 2011. Before 2000, base money was mainly from claims on other depository corporations, implying that the central bank lending to the commercial banks was the largest component of base money, with a declining proportion of 98.5% in 1985
to 46.7% in 1999. However, its proportion was lower than net foreign assets from 2002, and dropped to 5.1% in 2011. The rate of net foreign assets divided by base money was increasing sharply since 2003, from 50.6% in 2002 to 125.2% in 2008, and then slowly decreased to 115.9% in 2011. It shows that the foreign exchange reserve was the leading factor for increase in base money since 2002. To reduce increase in base money caused by foreign exchange reserves, the monetary authority started to issue an increasing number of bonds, from 148.8 billion in 2002 to 4049.7 billion in 2011. However, it was still too small compared to foreign exchange reserves to stop the increase in base money. Therefore, sharp growth in foreign exchange reserves since 2003 resulted in sharp increase in base money. This is in accord with the view of Lu and Zhu (2011), who state that increase in foreign reserves was the main reason for increase in base money from 2003 to 2011. Li (2007) also stresses that foreign exchange reserves overwhelmingly led to growth in base money in recent years. Wang (2012) finds that the People’s Bank of China (PBC) used reserve requirements from financial institutions to buy foreign assets from financial institutions, and that is why tight monetary policies issued in recent years did not decrease base money
Table 5 Components of Base Money from 1985 to 2011 (Billion RMB)
Year Net Foreign Assets (FA) Claims on Other Depository Corporations (CD) Claims on Non-financial Corporations (CN) Net Claims on Governments (CG) Bond Issue (BM) FA+CD+ CN+CG FA+CD+ CN+CG -BM Base Money 1985 14.57 224.86 0 -9.33 0 230.10 230.10 228.41 1990 82.05 509.07 0.57 42.07 0 633.76 633.76 638.73 1995 666.95 1151.00 18.16 60.94 19.71 1897.05 1877.34 2075.98 1996 956.22 1451.8 11.77 35.74 0 2455.53 2455.53 2688.85 1997 1322.92 1435.79 207.23 9.69 11.89 2975.63 2963.74 3063.28 1998 1356.03 1305.8 296.28 -14.32 11.89 2975.63 2963.74 3063.28 1999 1445.85 1537.39 383.31 -20.33 11.89 3346.22 3334.33 3362.00 2000 1518.89 1351.92 860.04 -151.76 0 3579.09 3579.09 3649.14 2001 1935.13 1131.16 854.73 -2.92 0 3918.10 3918.10 3985.17 2002 2281.98 998.26 724.03 -22.16 148.75 3982.11 3833.36 4513.82 2003 3065.93 1062.95 725.60 -205.37 303.16 4648.11 4344.95 5284.14 2004 4639.79 937.64 886.51 -286.26 1107.9 6177.68 5069.78 5885.61 2005 6269.76 781.77 1322.61 -463.48 2029.60 7910.66 5881.06 6434.10 2006 8484.63 651.67 2194.98 -735.43 2974.06 10595.85 7621.79 7775.78 2007 12387.79 786.28 6.36 -80.34 3446.91 13100.09 9653.18 10154.54 2008 16181.09 843.25 4.41 -76.79 4577.98 16951.97 12373.99 12922.23 2009 16967.10 716.19 4.40 -556.44 4206.42 17131.25 12924.83 14398.50 2010 21469.95 948.57 2.50 -885.62 4049.72 21535.40 17485.68 18531.11 2011 23519.87 1024.75 2.50 -733.4 2333.67 23813.72 21480.05 22464.18
Note: Base money in this paper is represented by the reserve money in the balance sheet, referencing to Lu and Zhu (2011) and Li (2007).
and money supply.
The growth in foreign exchange reserves could increase base money and thus multiply money supply, which could increase total funds in the economy. Figure 7 illustrates stock foreign exchange reserves, base money and M2 and their growth rates from 1997 to 2011. Stock foreign exchange reserves had been increasing sharply from 2000 to 2004, and peaked at 5048.3 billion RMB in 2004, which was close to base money (5885.6 billion RMB). Since then, it even was slightly larger than base money. Although the growth rate of M2 seemed to be stable around 20.0%, the M2/GDP since 2002 maintained in a high level of more than 150%, and even reached 180.0% since 2009. The Foreign Exchange Reserves/ GDP also reached the high level of 25.0% and the above since 2003, and even larger than 40.0% since 2007. These imply that since around 2003, both of foreign exchange reserves and money supply 2 expanded more largely than the GDP level. Interestingly, growth rates of stock foreign exchange reserves, base money and M2 had the same or very close peaking years, those are 2003 or 2004, 2007, and 2009 or 2010. This shows that growth in foreign exchange reserves greatly brought increase in base money, and the rise of base money resulted in soaring M2, especially from 2004.
Figure 7 Stock Foreign Exchange Reserves, Base Money and M2, and Their Growth Rates (billion RMB at left axis, % at right axis)
Source: China Statistical Yearbook from 1999 to 2012.
From the above analysis, financial openness reform and international trade surplus resulted in a great number of foreign funds flowing into China. This brought the sharp increase in foreign exchange reserves, and thus gave rise to upswings in base money and subsequently money supply. Although the Chinese economy was affected by the 2008 global crisis, the Chinese government implemented the expansionary monetary policies in
2009, which further increased the money supply level in China. With increase in money supply, there were a great number of funds in the economy to seek investment chance or inspective chance. Since there was a strong anticipation of house price appreciation based on the context of urbanization and huge population, a great number of funds were invested in real estate to seek profits.
4.2 Impact of Bank Restructuring Reform on Funds Invested in Real Estate 4.2.1 Bank Restructuring Reform
To improve competitiveness, the Chinese financial institutions had to be reformed. The reform on structural conversions of financial organizations and corporations were emphasized, such as conversion of four large state-owned banks into joint-stock companies; consolidation of rural credit cooperatives; restructuring of joint-stock banks and securities companies; and reform of the insurance sector.
Joint-stock reform of the four state-owned commercial banks started since December 30th, 2003 when the government invested 450 billion dollar into the Bank of China and
the China Construction Bank(CCB) by the Central Huijin Investment Company Limited1. Table 6 Reform Process of the Four Large State-owned Banks
Establishment
BOC CCB ABC ICBC
Set in 1912. Set in 1954. Set in 1955. Absorbed in the
PBC in1952. Absorbed in the PBC in 1968.
Separated from the PBC in 1979. Separated from the PBC in 1984.
Disposal of Non-performing Loans
270 billion of public funds injection in 1998.
1400 billion of non-performing loans were sold to the four financial asset management companies from 1999 to 2001.
Restructuring
Funds from Central Huijin Company
45 billion dollar in 2003. 19 billion dollar in Oct. 2008. 15 billion dollar in Apr. 2005. Government abandoned 300 billion of
their rights and interests in 2004. Subordinated Bond 60 billion issued after Jul. 2004. 40 billion issued after Jul. 2004. 50 billion issued after May, 2009. 35 billion issued after Aug. 2005. Be Joint Stock
Bank In Aug. 2004. In Sep. 2004. In Jan. 2009. In Oct. 2005. Funds from
Foreign Strategic Investors
From Aug. to Dec.
in 2005. In Aug. 2005. In Jan. 2006. List Hongkong In Jun. 2006. In Oct. 2005. In Jul. 2010. In Jan. 2006. Shanghai In Jul. 2006. In Sep. 2007. In Jul. 2010. In Jan. 2006.
This reform was implemented as follows. Firstly, because of the low capital adequacy ratio and the high non-performing loan ratio, the government injected money to state-owned commercial banks to help them found or turn into joint-stock limited companies. Secondly, the joint-stock limited companies were listed in Shanghai and Shenzhen Exchange to raise money. The reform process of the four large state-owned banks is shown in Table 6. Other commercial banks and rural credit cooperatives were also reformed and restructured, and got funds from the government or raised money from the financial market. The restructuring reform led to the improvement in the capital adequacy ratio of commercial banks (Table 7). The commercial banks whose capital adequacy ratio was larger than the standard line, increased from 8 (accounting for 0.6%) in 2003 to 239 (accounting for 100%) in 2009. Their non-performing loans were decreasing, and the non-performing loan ratio declined from 17.9% in 2003 to 1% in 2011, as shown in Table 8.
Table 7 Number and Share of the Commercial Banks with a Capital Adequacy Ratio Higher than the Standard Line (%)
Year 2003 2004 2005 2006 2007 2008 2009
Number 8 30 53 100 161 204 239
Share 0.6 47.5 75.1 77.4 79 99.9 100.0
Source: Almanac of China’s Finance and Banking of each year.
Table 8 Amount and Ratio of Non-performing Loans of Commercial Banks (Billion RMB/ %)
Year 2003 2004 2005 2006 2007 2008 2009 2010 2011
Amount 2104.46 1717.56 1219.69 1170.3 1270.19 563.54 506.68 4336 4278.7
Ratio 17.9 13.2 8.9 7.5 6.1 2.4 1.6 1.1 1.0
Source: The China Securities Regulatory Commission.
4.2.2 Bank Restructuring Reform, Monetary Multiplier, and Funds Invested in Real Estate Ye and Xiang (2011) analyze factors affecting monetary multiplier in China, and find that the improvement of capital adequacy ratio and the decline of the ratio of non-performing loans would increase monetary multiplier. As shown in Table 7 and 8, bank restructuring reform since 2003 greatly improved banks’ capitals and relieved the non-performing loan problem, which would lead to the growth in monetary multiplier.
Here we adopt the monetary multiplier between money supply 2 (M2) and base money (BM). That is, M2 = mm*BM, where mm is monetary multiplier. M2 = C+D, where C is currency in circulation, and D is deposit in banks. D=CD+QD, where CD is current deposit, and QD is quasi-money including fixed deposit, savings deposit and other deposit
contained into M2. MB = C+R, where R is reserves against deposits. Then, mm = M2/ BM = (C+D)/(C+R) =(C/D+1)/(C/D+R/D). Thus, mm is determined by C/D and R/D. Figure 8 shows monetary multiplier, C/D and R/D from 1993 to 2011. With improvement of the banking system and development of financial innovation tools, banks attracted more and more deposits, which thus lowered the currency ratio (C/D). The ratio of C/D was at a high level of 0.2 in 1993, and then decreased to smaller than 0.1 from 2003, and reached to 0.06 in 2011. Decrease in currency ratio increased monetary multiplier from 2.65 in 1993 to 4.64 in 20052. The deposit-reserve ratio (R/D) sharply rose due to the tight monetary policies
of the central bank from 2006, which led to a slight decrease in monetary multiplier from 2006. However, with the low level of C/D caused by the improvement in the banking system, the monetary multiplier maintained a fluctuation around a high level of 4.0. In fact, the upswing in deposits which led to the reduction of C/D, allowed banks to provide more loans and accelerate their credit activities, and thus increased monetary multiplier. Consequently, bank restructuring reform resulted in the improvement in the banking system, which expanded and accelerated the bank credit activities, and thus elevated monetary multiplier to over 4.0 in most of years from 2002.
Figure 8 Monetary Multiplier (at left axis), C/D and R/D (at right axis) from 1993 to 2011
Source: PBC and Almanac of China’s Finance and Banking of each year.
Bank restructuring reform had two influences on funds invested in real estate. First, it reduced equity share of the state, and increased that of foreign and private investors. This enhanced banks’ market attribution. With increase in deposits, banks had to provide loans to high profitable industries instead of aiding state-owned enterprises as conducted from
1987 to 2003 to seek profits, such as the real estate industry. Second, it promoted banks’ financing efficiency, and brought sufficient funds in the banking system, thus banks had to increase loans to gain profits with increase in savings. This could result in the growth in monetary multiplier and subsequently money supply and finally funds invested in real estate. Figure 9 shows monetary multiplier, money supply 2, total deposits and loans of the financial institutions against the GDP from 1994 to 2011. It is clear that the four series had similar fluctuations, especially M2/GDP and deposits/GDP. Monetary multiplier exceeded 4.0 from 2002, and peaked at 4.6 in 2005. M2/GDP, deposits/GDP and total loans/ GDP all peaked in 2003. Since then, M2/GDP and deposits/GDP rose to a new level of over 1.5, although there is a decrease in 2007 and 2008. Total loans/GDP also was larger than 1.0 except 2008. Therefore, increase in monetary multiplier which had close relationship with the expansion of deposits and loans in the economy, contributed to growth in money supply from 2003.
Figure 9 Monetary Multiplier, M2/GDP, Deposits/GDP and Loans/GDP from 1994 to 2011
Source: China Statistical Yearbook 2012 and Almanac of China’s Finance and Banking of each year.
Based on the above analysis, from 2003 to 2011, financial openness and bank restructuring reform increased base money and monetary multiplier respectively, and thus money supply. This resulted in increasing funds invested in real estate, as shown in Figure 10. As Liu (2013) states, based on generalize VAR models in different periods, the influence of money supply on commercialized building prices was drastically increased from 2003 because of the financial reforms.
Banking Sector
Figure 10 Characteristics of Fund Flow from 2003 to 2011
4.3 Increase in Money Supply and Funds invested in Real Estate
The above analysis shows that the financial openness reform and bank restructuring reform led to the increase in money supply. Under the background of lack of investment products due to the developing financial markets, accompanying the urbanization and anticipation of appreciation in house prices, the massive money and liquidity flowed in the real estate industry. Xiong (2007), Hu (2009), and Liu (2013) show that excessive money supply and liquidity have a significant impact on the increase in house prices.
We have to make clear how the increase in money supply was invested in real estate. First of all, since the real estate industry is capital-sensitive, banking credit is an overwhelming way for funds flowing into the real estate industry. With the excessive liquidity, the banking sector expanded their loans to the real estate industry, and real estate loans were even considered as the prime loans with the increasing housing price level. The ratio of outstanding loans to the real estate industry against the total lending of financial institutions increased from 11.6% in 2003 to 19.6 % in 20113. Zhou (2005) and
Liang and Cao (2007) also assert that there is an expansion of bank credit to real estate, which causes upswings in house prices. Both real estate development enterprises (suppliers in the housing market) and individuals (demanders) could get loans from banks. Besides, due to the national owned urban land system, local governments also get loans from banks by land mortgage. Qiu et al. (2012) stress that local governments could get funds from banks by land mortgage loans as well as revenue from direct land transfer fees and other indirect taxes. The outstanding of local government debts reached 10.7 trillion RMB, 79% of which were from bank loans (8.5 trillion RMB)4.
Second, with the increase in money supply, individuals and institutions have more money5 for investment. The Chinese financial market was still developing, and financial
investment products were not sufficient to satisfy the investment demand, thus real estate seemed to be a good choice for investment. Individuals and institutions could directly invest in real estate through purchasing houses or indirectly through the securities
market or real estate trust products. For direct investment, the Wenzhou house purchasing groups6 cited by many studies such as Tang (2006) and Yin (2011) were good examples, and
the “ghost town” also increasingly appeared in recent years. For indirect investment from individuals or institutions, the investment of real estate trust products was also sharply ascended from 1.0 billion RMB in the second quarter of 2003 to 84.5 billion RMB in the fourth quarter of 20127. As Qiu (2012) states, under the context of lacking investment
products, real estate trust products are popular among investors because of its high profit and strict risk control.
Last but not least, foreign funds could invest in real estate in the form of FDI and hot money or through the abroad securities market. The People’s Bank of China (PBC) (2004) shows that there are four ways for foreign funds to flow into the real estate market: (1) directly establish real estate development enterprises or share equity of the domestic enterprises; (2) indirectly investment by the bond market or through foreign-funded real estate intermediary enterprises by volume purchase and then resale retail; (3) foreign banks provide loans to real estate enterprises and consumers; (4) non-resident foreign exchange inflows purchase houses after exchange settlement. In fact, (1), the later part of (2), and (3) come from foreign direct investment (FDI), while (4) is from “hot money”, and the first part of (2) is through the abroad securities market. The FDI to the real estate industry accounted for an increasing ratio, from 9.8% in 2003 to 23.2% (26.9 billion dollar) in 20118. The role of FDI in the housing price appreciation is emphasized by He et al. (2011).
Liu (2008), and Zhao et al. (2011) show that hot money inflows have significant positive effects on housing prices in China.
Thus, the process of how the increase in money supply flows into real estate could be summarized as in Figure 11.
Indirect Investment Through the Securities Market and Real Estate Trusts Real Estate Development Enterprises
5 Conclusions
5.1 FindingsThis paper historically and institutionally analyzed the financial reform in China, and discussed influences of financial openness and bank restructuring reform since 2003 on money supply and thus funds invested in real estate. The main findings are as follows.
First, by the historical analysis on the characteristics of fund flow in different financial reform stages in Section 3, we found that the dependence of the banking sector on the government finance even could trace back to the planned economy period when the PBC was a subordinate unit of the Treasury. Although the reform of 1987 to 2003 made the PBC independent from the Treasury, the commercial banking sector greatly relied on the government finance and was tied in problems of non-performing loans and low capital level. There is why the bank restructuring reform started from 2003 to decrease the state-owned ownership and improve the performance of the banking sector.
Second, the institutional discussion with the related data in Section 4 suggests that financial openness reform increased foreign fund inflow and thus foreign exchange reserves, and led to growth in base money. This could explain why strict monetary policies in recent years could not decrease money supply. With increasing foreign fund inflow, foreign exchange reserves and thus base money and money supply have been rising, resulting in increasing funds invested in real estate. Moreover, foreign funds could directly invest in real estate, and around 20% of the FDI flowed into the real estate industry in 2011.
Third, bank restructuring reform greatly improved the performance of the banking sector, which promoted the efficiency of financing and money management and thus monetary multiplier. That is why there is a high monetary multiplier of around 4 and up in recent years. The high monetary multiplier is also an important reason for the expansion of money supply and thus funds invested in real estate. Additionally, with increase in deposits, the banking sector had to issue more loans to seek profit, and the high profitable real estate industry seemed to be a good choice.
5.2 Policy Implications
Since financial openness brought increase in foreign fund inflow and thus money supply and funds invested in real estate, the government is supposed to encourage the investment in other industries rather than the real estate industry. At the same time, the
speculative investment in real estate should be restricted, such as the heavy tax on the vacant houses or lands.
Moreover, we should develop more flexible instruments and ways to hedge increase in base money resulted from increase in foreign exchange reserves, and keep the number of base money and thus money supply being in balance with the economic development. This is very important to avoid the fictitious hot economy and the real estate bubble.
5.3 Contributions and Limitations
This paper is the first one to study the impact of Chinese financial reform on the real estate industry. We analyzed the impacts of financial openness and bank restructuring reform since 2003 on funds invested real estate and its implication. The study found that financial openness and bank restructuring reform brought growth in base money and monetary multiplier respectively and thus increased money supply and subsequently funds invested in real estate.
Certainly, this paper also suffers from data limitations. Future study will try to overcome the data limitation, and find indicators to evaluate the extent of financial openness and bank restructuring reform.
Acknowledgement
The author extends the heartfelt gratitude to the two anonymous referees for their excellent suggestions. The author also would like to appreciate the useful comments and suggestions of Prof. Gangzhi Fan on the 2013 Global Chinese Real Estate Congress (GCREC) Annual Conference, and Prof. Motohiro Adachi on 2013 Asian Real Estate Society (AsRES) International Conference. Moreover, the author would like to thank Prof. Shuji Matsuno, Prof. Kazuo Inaba and Prof. Jin Yu for their detailed and helpful guidance on this article. Any errors, either logical or factual, which remain in the article, are entirely the responsibility of the author. Comments are welcome to [email protected]. Notes
1 The Central Huijin Investment Company Limited is a wholly state-owned company authorized by the State Council. It represents the country to exercise investor’s rights and perform investor’s duties to the key state-owned financial enterprises. It holds controlling interest or participate equity of commercial banks, securities companies, insurance companies and other institutions.
2 Because both the C/D and the R/D are smaller than 0.22, the sum of the two is less than 1. That is, the (C/D+R/D), the denominator of mm is smaller than 1. Consequently, fixed the R/D, the decrease in C/D would cause the increase in the (C/D+1)/(C/D+R/D), the mm. Fixed the C/D, the increase in R/D would lead to the decrease in mm.
3 The data of real estate development outstanding loans and house purchasing outstanding loans are from the “Report of Chinese Monetary Policy Performance” in each quarter of each year issued by the PBC. The sum of the two is the outstanding loans to the real estate industry. The data of total outstanding loans of financial institution is from the PBC. Then, the ratio of outstanding loans to the real estate industry against the total lending of financial institutions is calculated.
4 The data is from the National Auditing Administration of China.
5 Here the money owned by the individuals, institutions and units is named as “private funds” in Figure 11.
6 Wenzhou house purchasing groups are the groups which consist of hundreds of the rich from Wenzhou and aim at house speculation. The first group came into Shanghai in August 1st, 2001 and bought more than 100 houses in 3 days with 157 members. Since then, more groups went into more cities, such as Hangzhou, Qingdao, Chongqing and Shenyang. House prices in these cities started soaring after the groups arrived.
7 The data is from the use-trust network. 8 The data is from the State Statistical Bureau.
References
Aizenman, J. & Noy, I. (2009), “Endogenous Financial and Trade Openness”, Review of Development Economics, Vol. 13, No. 2, pp. 175-189.
Bank of Japan, (2007), “Financial System Report”, Mar.
Beck T., Levine, R. & Loayza, N. (2000), “Finance and the Sources of Growth”, Journal of Financial Economics, Vol. 58, pp. 261-300.
Bell, C. & Rousseau, P. L. (2001), “Post-independence India: A case of finance-led industrialization?”, Journal of Development Economics, Vol. 65, pp. 153-175.
Cao, Y. Z.(2008), “Restrospective and Perspective of Financial System Reform in China”, China Opening Journal (kaifangdaobao), No.1, pp. 9-15. In Chinese.
Christopoulos, D. K. & Tsionas, E. G. (2004), “Financial Development and Economic Gowth: Evidence from panel unit root and cointegration tests”, Journal of Development Economics,
Vol. 73, pp. 55-74.
Davis, E.P. & Zhu, H. (2009), “Commercial Property Prices and Bank Performance”, The Quarterly Review of Economics and Finance, Vol. 49, No. 4, pp. 1341-1359.
Demirgüç-Kunt, A. & Levine, R. (1999), “Bank-Based and Market Based Financial System: Cross-country comparisons”, World Bank Working Paper, No. 2143, pp.1-89.
Ebrahim, M. S. & Hussain, S. (2010), “Financial Development and Asset Valuation: The special case of real estate”, Journal of Banking & Finance, Vol. 34, pp. 150-162.
Fan, M. T. (2004), “The Financial Structure and Its Effects on the Monetary Policy Propagation”, Journal of Economic Research (Jingjiyanjiu). No.7, pp. 27-37. In Chinese.
Fase, M. & Abma, R. (2003), “Financial Environment and Economic Growth in Selected Asian Countries”, Journal of Asian Economic, Vol. 14, pp. 11-21.
Gao, B. and Wang, X. (2009), “The Effectiveness of Real Estate Market Transmission for Monetary Policies in China: 2000-2007”, Finance & Trade economics (caimaojingji), No. 3, pp. 129-135. In Chinese.
Goldsmith, R. W. (1969), Financial Structure and Development, New Haven, CT: Yale University Press.
Gregorio, J., & Guidotti, P. E. (1995), “Financial Development and Economic Growth”, World Development, Vol. 23, pp. 433-448.
Guiso, L., Sapienza, P., & Zingales, L. (2004), “Does Local Financial Development Matter?”, Quarterly Journal of Economics, Vol. 119, No. 3, pp. 929-969.
Han, F. (2011), “Study on Interact Channels of Trade Openness and Financial Openness in China”, On Economic Problems (jingjiwenti), No. 7, pp. 39-42. In Chinese.
He, C., Wang, J. & Cheng, S. (2011), “What Attracts Foreign Direct Investment in China’s Real Estate Development?”, Ann Reg Sci, Vol. 46, pp. 267-293.
Hofmann, B. (2004), “Bank Lending and Property Prices: Some International Evidence”, Money Macro and Finance (MMF) Research Group Conference, No. 46.
Horrocks M., Ramaswamy, V. & Rupp, K. (2008), “Financial Reforms in Chinese Banking: The impact on personal lending and operational efficiency”, Business Horizons, Vol. 51, pp. 511-517.
Hu, R. (2009), “The Analysis on the Dynamic Effects of Money Supply Fluctuation on Housing Prices”, Statistics and Decision (tongjiyujuece), No. 23, pp. 131-134, Dec. In Chinese. Huang, L. (2007), “The Study on Financial Openness from Multiple Perspective”, China
Economic Quarterly(Jingjixuejikan), No. 2. In Chinese.
principles for effective banking supervision”, IMF Country Report, No. 12/78.
Kim, K.H. (2004), “Housing and the Korean Economy”, Journal of Housing Economics, Vol. 13, No. 4, pp. 321-341.
King, R. G., & Levine, R. (1993), “Finance and Growth: Schumpeter might be right”, Quarterly Journal of Economics, Vol. 108, pp. 717-737.
Kraay, A. (1998), “In Search of the Macroeconomic Effects of Capita Account Liberalization”, World Bank Working Paper.
Lane, P. R. & Milesi- Ferretti, G. M. (2001), “The External Wealth of Nations: Measures of foreign assets and liabilities for industrial and developing countries”, Journal of International Economics, Vol. 55, No. 2, pp. 263-294 .
Lane, P. R. & Milesi-Ferretti, G. M. (2002), “International Financial Integration”, IMF Working Papers, WP/02/145.
Lane, P. R. & Milesi-Ferretti, G. M. (2007), “The External Wealth of Nations Mark II: Revised and extended estimates of foreign assets and liabilities, 1970-2004”, Journal of International Economics, Vol. 73, Vol. 2, pp. 223-250.
Lastrapes, W. D. (2002), “The Real Price of Housing and Money Supply Shocks: Time series evidence and theoretical simulations”, Journal of Housing Economics, Vol. 11, No. 1, pp. 40-74.
Li, Y. & Li, X. (2012), “Fiscal Decentralization, Local Government Competition and House Price Fluctuation: An empirical analysis of 35 large and medium- sized cities in China”, Soft Science (ruankexue). Vol. 26, No.1, pp. 42-50. In Chinese.
Liang, Q. & Cao, H. (2007), “Property Prices and Bank Lending in China”, Journal of Asian Economics, Vol. 18, No.1, pp. 63-75.
Liu, F. (2013), “The Dynamic Effects of Money Supply on Commercialized Building Prices in China”, Journal of Chinese Economic Studies. Vol. 10, No. 1, pp. 20-27.
Liu, L. (2008), “Did the ‘Hot Money’ Stimulate the Increase in Housing Prices”, Journal of Financial Research (jinrongyanjiu), No. 10, pp. 48-70. In Chinese.
Liu, T. & Li, K.W. (2001), “Impact of Liberalization of Financial Resources in China’s Economic Growth: Evidence from provinces”, Journal of Asian Economics, Vol. 12, pp. 245-262. Liu, X. & Dong, Q. (2008), “Review and Analysis on Reform of China Banking System: Based
on the perspective of relationship between banks and the government”, Finance and Economics(Caijingkexue). No. 246, pp. 1-8. In Chinese.
Lewis Jr., R. E. (1955), The Theory of Economic Growth. London: George Allen and Unwin. Levine, R. (2002), “Bank-based or Market-based Financial Systems: Which is better?”, Journal
of Financial Intermediation, Vol. 11, pp. 398-428.
Levine, R. & Zervos, S. (1998), “Stock Markets, Banks, and Economic Growth”, American Economic Review, Vol. 88, pp. 537-558.
Lu, S. F. & Yao, Y. (2009), “The Effectiveness of Law, Financial Development,and Economic Growth in an Economy of Financial Repression: Evidence from China”, World Development, Vol. 37, No. 4, pp. 763-777.
Ni, K. & Zheng, P. (2004), “Trade Openness and Financial Openness”, Finance and Economics (Caijingkexue), No. 3, pp. 79-83. In Chinese.
MacKinnon, R. I. (1973), Money and Capital in Economic Development. Washington, DC: Brookings Institution.
Mizayaki, Y. (1992), A Compound Recession. Tokyo. Chuokoron-sha Inc. In Japanese.
Okina, K., Shirakawa, M., & Shiratsuka, S. (2001), “The Asset Price Bubble and Monetary Policy: Japan’s Experience in the Late 1980s and the Lessons”, Monetary and Economic Studies (special edition), pp.395-450.
Patrick, H. T. (1966), “Financial Development and Economic Growth in Undeveloped Countries”, Economic Development and Cultural Change, Vol. 14, pp. 174-189.
Qiu, F. (2012), “The Review and Prospects on Real Estate Investment Trust Industry”, Journal of Jilin Financial Research (Jilinjinrongyanjiu), No. 2, pp. 35-38. In Chinese.
Qiu, H., Fu, G. & Zhang, Y. (2012), “The Study on the Diversity of Land-based Finance”, Academic Research (xueshuyanjiu). No. 4, pp. 75-81. In Chinese.
Schumpeter, J. A. (1911), The Theory of Economic Development. Cambridge, MA: Harvard Univ. Press.
Shaw, E. S. (1973), Financial Deepening in Economic Development. New York: Oxford Univ. Press.
Shiratsuka, S. (2001), “Asset Price Bubble in Japan in the 1980s: Lessons for financial and macroeconomic stability”, Discussion Paper , No. 2003-E-15.
Tang G. (2006), ‘‘Wenzhou Group of House Speculation and the Changes of Financial Institutions in China’’, Economic Theory and Business Management(Jingjililunyujingjiguanli), No. 8, pp. 35-37. In Chinese.
Tang, Q. (2011), “Research of Financial System Reform of China by Institutional Economics”, Database of Outstanding Master’s Thesis (zhongguoyouxiushuoshilunwenshujuku). In Chinese.
Teranishi, J., Fukuda, S., Okuda, H. & Mieno, W. (2007), Asian Economic Development and Financial System: Northwest Asia Volume, Toyo Keizai Inc Press. In Japanese.
The People’s Bank of China. (2004), Chinese Real Estate Finance Report (zhongguofangdichanjinrongbaogao), China Financial Publishing House. In Chinese.
The Specialized Statistical Analysis Team of China Banking Regulatory Commission. (2005), “The Analysis Report on the Source of Capital in Chinese Real Estate Industry”, China Finance(zhongguojinrong), No. 18, pp. 32-34. In Chinese.
Wang, G. (2012), “The Operational Mechanisms of Monetary Policy Tools in China: 2001-2010”, Social Sciences in China(zhonguoshehuikexue), No. 4, pp. 62-82. In Chinese.
Wang, G. & Guo, T. (2008), The 30 Years of Chinese Economic Reform: Financial reform volume. Chongqin Univesity Press. In Chinese.
Whitman, M. V. N. (1969), “Economic Openness and International Financial Flows”, Journal of Money, Credit & Banking, Vol. 1, No. 4, pp. 727-749.
Wu, D. & Liu, H. (2008), “The Study on the Influences of the Local Governments on Real Estate Prices”, Economic Review (jingjizongheng). No. 10, pp. 41-44. In Chinese.
Xiong, W. (2007), “The Analysis and Suggestions on Liquidity Excessive Factor for Constant Housing Price Increase”, Productivity Research(shengchanliyanjiu), No. 19, pp. 87-88. In Chinese.
Yan, Y. (2008), “Influence of Bank Reform on Relationship between Banks and Enterprises”, Journal of Central University of Finance Economics (Zhongyangcaijingdaxuexuebao). No. 3, pp. 33-38. In Chinese.
Yang, Y. & Liu, R. (2011), “The Land-based Fiscal and the Management of Land Market”, Urban Problems (chengshiwenti). No. 3, pp. 87-90. In Chinese.
Yao, S., Jiang, C. & Feng, G. (2011), “Banking Reform and Efficiency in China: 1995 - 2008”, Economic Research Journal(Jingjiyanjiu), No. 8, pp. 4-14. In Chinese.
Yin, Z. (2011), ‘‘Wenzhou Phenomenon is the Signal of Housing Price Bubble Burst’’, Real Estate Biweekby(fangcichandaokan), pp. 33. In Chinese.
Ying, Z. (2008), “What is the ‘China Mode’ of Financial Reform?”, China Economist, pp. 61-71. Xiong, W. (2007), “The Analysis and Suggestions on Liquidity Excessive Factor for Constant
Housing Price Increase”, Productivity Research(shengchanliyanjiu), No. 19, pp. 87-88. In Chinese.
Yu, H. J. & Lee, S. (2010), “Government Housing Policies and Housing Market Instability in Korea”, Habitat International, Vol. 34, No. 2, pp. 145-153.
Yin, M. & Shi, Q. (2009), “The Effects of Financial Openness on the Competition Degree in Banking Industry of China”, Finance & Trade Economics(Caimaojingji), No 11, pp. 12-18. In Chinese.
Zhang, P. & Zhang, H. (2008), “1978 - 2008: The Research on Chinese Commercial Banks’ Reform and Development in the Last 30 Years - A perspective on financial function”, Finance and Economics(Caijingkexue). No. 247, pp. 36-41. In Chinese.
Zhang, Q. (2012), Chinese Financial System: Monetary Policy, Capital Market, Financial Sector. Japan Economic News Press, Tokyo. In Japanese.
Zhao, W., Zhang, Y. & Zhao, Y. (2011), “An Analysis of the Relationship of RMB Appreciation, Hot Money Inflow and House Price: Trends and fluctuations”, World Economy Study(shijiejingjiyanjiu), No. 5, pp. 15-26. In Chinese.
Zhou, J. (2005), “Monetary Policies, Bank Loans and House prices: The empirical analysis on the four municipalities”, Finance & Trade Economics(caimaojingji), No. 5, pp. 22-27. In Chinese.