1
Plasmonic Nanofabrication Through Optical Heating
Matthias Enders,
†,‡Shinya Mukai,
†Takayuki Uwada
¶and
Shuichi Hashimoto
†,*
† Department of Optical Science and Technology, University of Tokushima, 2-1 Minami-Josanjima,
Tokushima 770-8506, Japan,
‡ Department of Physics, RheinMain University of Applied Sciences, Am Brückwig 26, D-65428
Rüsselsheim, Germany,
¶ Department of Chemistry, Josai University, 1-1 Keyakidai, Sakado, Saitama 350-0295, Japan.
This document is the Accepted Manuscript version of a Published Work that appeared in final form in The Journal of Physical Chemistry C, copyright © American Chemical Society after peer review and technical editing by the publisher. To access the final edited and published work see https://doi.org/10.1021/acs.jpcc.5b11762.
2
Abstract
A temperature gradient can induce solutes to migrate from a hot to a cold region, and vice versa, in solution. This process, termed thermophoresis, has been applied to manipulate, transport, and separate various macromolecules and colloids by exploiting a microscale temperature gradient. Here we describe using a single gold nanoparticle (AuNP) as an efficient nanoscale heating source to promote thermophoresis. Moreover, on introducing a substrate with high thermal conductivity such as sapphire, a strong local temperature gradient can be shaped in the medium near the AuNP under continuous wave laser illumination. We observed molecules such as polyethylene glycol and sodium dodecyl sulfate being transported toward the AuNP and attaching to its surface, forming a gold core–organic shell structure within several tens of seconds of illumination. Spectroscopically, because of the gradual increasing encapsulation, progressive red shifts with enhanced scattering intensities were seen for the localized surface plasmon resonance bands of the AuNP with increasing cycles of illumination. Post-mortem scanning electron microscopy provided direct evidence of shell formation. Our technique is relevant to nanofabrication based upon optical heating at the nanometer scale.
3
Introduction
Currently, optically manipulating—that is, selecting, directing, and positioning—submicron objects and nanoparticles at will is being researched with great intensity. Optical trapping based on gradient forces exerted by a tightly focused laser beam has been the primary choice to achieve this objective.1–4 Very recently, however, optical manipulation with different origins has emerged. Braun
and coworkers have demonstrated that a local temperature field created by laser heating of gold nanostructures can be used to localize and control a single 200-nm polystyrene bead inside a cavity surrounded by the structure.5 It was suggested that a strong local temperature gradient can be used
to trap particles. In other studies, self-propelling motion was activated in Janus particles of 1-m silica sphere half-coated with gold under laser illumination.6 This active Brownian motion was
further used to steer and localize particles to well-defined positions by feedback-controlled switching of the illuminating laser beam.7 The mechanism underlying these relatively new types of
optical manipulation is thermophoresis or the Soret effect; in short, the transporting of mass along temperature gradients. Particles ranging from single DNA molecules to micrometer-sized colloids may be manipulated, concentrated, and fractionated in non-uniform temperature environments.8 The
handling and guiding of molecules with well-established methods such as optical tweezers and electrophoresis have specific benefits but also limitations.9–11 Thermophoresis supplements existing
techniques but offers optical measurement and nanofabrication systems with significantly improved performance in dealing with biomolecules and colloids.
To promote thermophoresis, temperature shaping is important. Spatiotemporal control over the temperature field is challenging because heat conduction prevents sustained temperature differences. Baffou and coworkers overcame this issue by optical heating of a 2D plasmonic nanostructured assembly.12 They computationally and experimentally investigated temperature
distributions obtained by various-shaped microscale assemblies. The study bolstered the idea that confinement using a temperature field can be achieved by photoexcitation of metallic nanoparticles
4
and nanostructures. Gold nanoparticles (AuNPs) under visible light illumination experience efficient heating through effective light-to-heat conversion; simultaneously, however, heat conduction into the surrounding medium produces a decay in the temperature gradient.13–15 As a
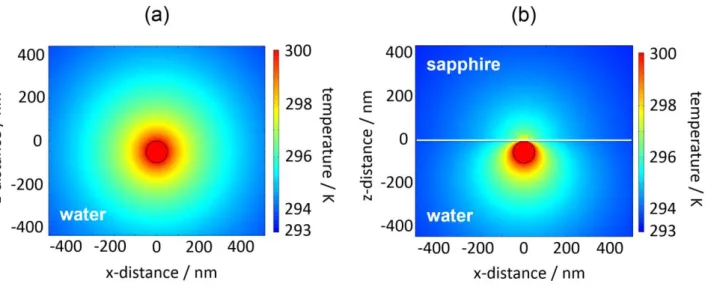
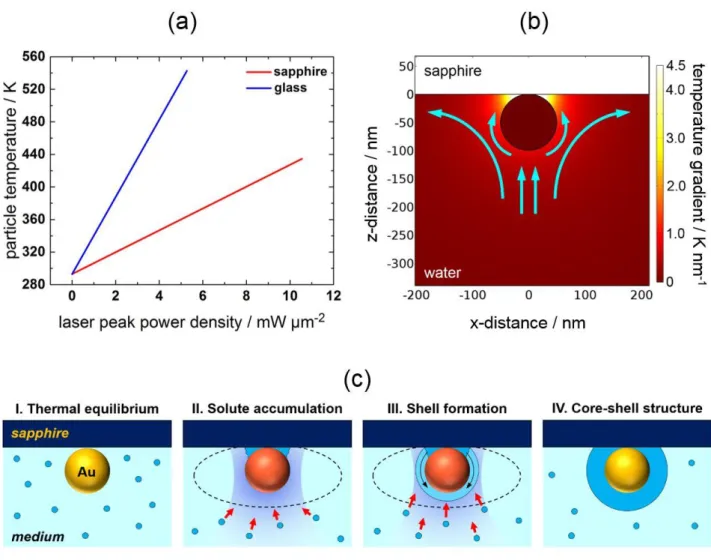
result, the temperature field is confined to a localized area of less than a micrometer. Nevertheless, the 3D radial temperature distribution in the homogeneous medium is isotropic (Figure 1a), implying that temperature shaping cannot be attained by simply scaling down. Introducing an additional interface can immensely change the 2D temperature distribution (Figure 1b) because this modifies heat conduction spatially through a difference in thermal conductivities of the medium and substrate.16 In Figure 1b, because cooling is faster in a sapphire substrate compared with water,
which retains a high temperature, water near the lower half of the gold surface heats up considerably whereas the upper half near the substrate surface cools. A strong local temperature gradient is formed in the medium near the particle under laser illumination.
Aside from thermophoresis, the temperature gradient in the medium initiated by heating an AuNP creates a thermal non-equilibrium resulting in convective flow or thermal convection. Thermal convection is driven by temperature-induced differences in the density of the fluid subject to gravitational forces.17 Previously, the trapping of DNA molecules and polystyrene beads was
found to occur through the interplay of thermophoresis and buoyancy-driven toroidal convection flow, both of which were induced by the temperature gradient.18,19 Additionally the combination of
thermodiffusion and convection in a solution of polystyrene beads was found to lead to the aggregation of two-dimensional colloid crystals or the formation of ring structures.20,21 These
studies used a flat chamber in which water was heated either directly or indirectly by illuminating with a continuous wave (CW) laser. A convective flow may also occur in the chamber when a single AuNP is heated through laser illumination.
5
Figure 1. 2D temperature distributions for a 100-nm-diameter single gold nanoparticle, (a) levitated
in water and (b) supported on sapphire and immersed in water, under optical illumination from a CW laser. The calculation was performed by solving numerically the heat conduction equation with COMSOL Multiphysics 5.0 (http://www.comsol.com).
We report observations of thermophoresis-driven fabrication of core–shell nanoparticles performed by heating a single AuNP supported on sapphire. We observed a red shift in the localized surface plasmon resonance (LSPR) scattering band as functions of the illumination period and peak power density of illuminating CW laser for the AuNP immersed in solutions of polyethylene glycol 6000 (PEG 6000) and sodium dodecyl sulfate (SDS). Scanning electron microscopy (SEM) images of the irradiated AuNPs suggested the formation of an Au core–organic shell structure. Subsequently, we investigated the driving mechanism of the solutes based on thermophoresis and convection.
6
Experimental Section
Sample description: Aqueous solutions of Au NPs with nominal diameters of 100 nm (EMGC100:
BBI Solutions, Cardiff, UK) were used for our experiment. The particles were synthesized using a variation on the Frens citrate reduction method, and were stabilized with citrate.22 Au NPs were
transformed from faceted to spherical shape by irradiating with weak-intensity nanosecond laser pulses (≈11 mJ cm–2) of 532-nm wavelength. The particle image acquired using a transmission
electron microscope and the corresponding size distribution (105±5 nm) are given in the
Supporting Information, Figure S1. PEG 6000 (Molecular biology grade: Calbiochem, Billerica,
MA) and SDS (Molecular biology grade: Wako Pure Chemicals, Osaka, Japan) were used as received. Spherical Au NPs were spin-coated onto the 0001 face of an optically polished sapphire substrate (Shinkosha, Yokohama, Japan) of size 10 mm 10 mm 0.5 mm. The Au NPs were washed twice with double-distilled water by placing 0.5 mL of water on a spin coater and spun. AuNPs were immersed in solutions of PEG 6000 and SDS in an 11-µL chamber consisting of a sapphire substrate, a 0.3-mm-thick silicon rubber spacer, and a 24 mm 24 mm 0.5 mm microscope cover slip (borosilicate glass: Schott D263T). The substrates were cleansed just before use in a boiling mixture of 1:1 30% H2O2 - 28% ammonia mixture for 90 min.
Description of setup: The single particle scattering spectra were measured by dark-field
microscopy-spectroscopy at a wavelength resolution of 0.5 nm (Supporting Information, S2). The particles were heated by illuminating a focused 488-nm CW laser, OBIS-488-LX-150 (Coherent, Santa Clara, CA) beam through a microscope objective (60, NA = 0.70) on an inverted microscope, IX-71 (Olympus, Tokyo, Japan; with dark-field condenser NA = 0.8 to 0.92). We used a 488-nm wavelength laser because this excitation wavelength is slightly off-set from the LSPR peak position and the absorption cross-section, Cabs, is then unaffected by temperature changes. In contrast, the
LSPR peak intensity is strongly dependent on particle temperature and changes in medium refractive index.23 The excitation of the LSPR band causes the value of C
abs for NPs to decrease
7
particle temperature difficult. At the excitation wavelength of 488 nm, no light absorption and subsequent temperature increase are expected for sapphire, PEG, and SDS. The irradiation periods were regulated using an F77 mechanical shutter (SURUGA SEIKI, Tokyo, Japan). The temperature of an AuNP immediately rises and falls with the shutter opening and closing, respectively. The microscope has two ports. One leads to a SP-2300i polychromator (Acton Research Co. MA with a grating of 150 grooves/mm blazed at 500 nm) with a DU401-BR-DD CCD camera (Andor Technology, UK; operating at −60°C) through a 300-μm diameter pinhole (view area: 5-μm-diameter). The other is used for particle imaging with a DS-5M digital camera (Nikon Digital Sight, Kanagawa, Japan). A PD 300-UV photodiode power meter (Ophir, Israel) was used to measure the laser intensity. The spatial laser profile was determined from scattering-signal intensity measurements from the laser spot while rastering the stage at 100-nm intervals. The laser beam diameter thus determined was 1.2 m although a calculated 1/e2 diameter of 0.5 m was obtained
assuming a Gaussian beam profile and using experimental optical parameters (NA = 0.70, = 488 nm, n = 1.33). The laser peak power density Ip (mW µm−2) was estimated assuming a Gaussian
spatial profile. To ensure that the spectral measurements were always taken under the same conditions and to control the shape of the focal spot, the laser beam was brought into focus on the substrate surface at a distance 3−5 µm from the particle of interest before being positioned to illuminate the particle (Supporting Information, Figure S3).
A field-emission scanning electron microscope (SEM S4700, Hitachi, Tokyo, Japan) was used for imaging the particles on which Au was sputter-deposited. A thickness was determined to be 2–3 nm by measuring the thickness of the film at various locations on the glass substrate. For post-mortem SEM imaging, each single Au NP irradiated was located using marks patterned on the substrates (for details, see Supporting Information, S4)
8
Results and Discussion
1. Heating-induced LSPR shifts in PEG and SDS solutions
The LSPR bands are highly sensitive to particle diameter, shape, and the surrounding environment, specifically the medium refractive index.24–26 In this study, we used spherical AuNPs with diameters within a narrow distribution (Supporting Information, S1) to ensure reproducibility of the spectra to be described below. At ambient temperature, the experimental LSPR scattering spectra in 5% PEG and in 0.05 M SDS exhibited a peak position at 5826 nm, which was slightly shifted from that in water, 5764 nm. To observe spectroscopically the plasmonic heating effects, we used a focused laser illumination to a single AuNP in which a steady-state temperature is reached in less than several hundred nanoseconds.27
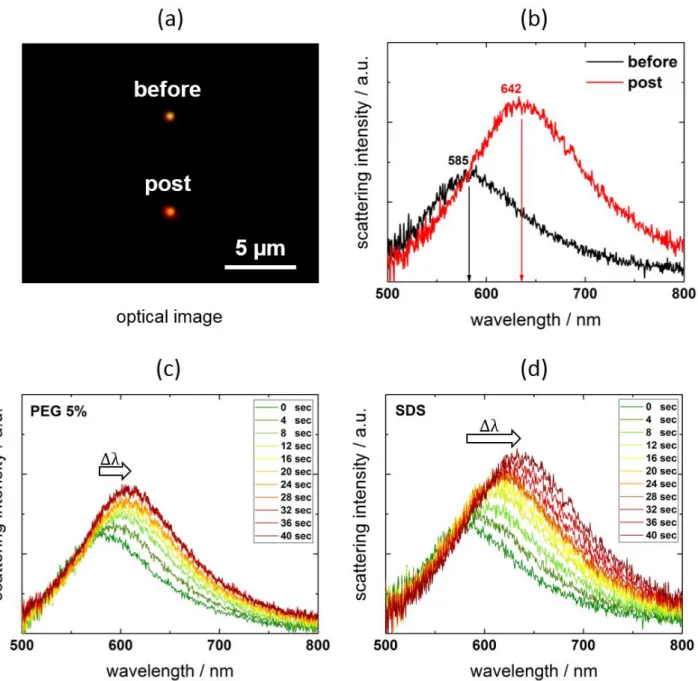
Figure 2a and b shows the color change and corresponding Rayleigh scattering spectra of
a 100-nm-diameter AuNP in a 0.05-M SDS solution supported on a sapphire substrate. The spectra were collected before and after 488 nm CW laser irradiation. After a total irradiation period of 40 s, the color changed from yellow-orange to red resulting from a significant permanent red shift of the LSPR band represented by a peak shift of 57 nm (Supporting Information, S5). Figure 2c and d shows the laser irradiation period-dependent spectral changes for 5% PEG 6000 and for 0.05 M SDS solutions. Progressive red shifts are accompanied by enhanced scattering intensities under a constant excitation laser intensity. The steady red shift and scattering intensity increase from laser irradiation hampered the observation of spectral changes during laser illumination. The red shifts and intensity enhancement are consistent with increased refractive indices of the surrounding medium for AuNPs (Supporting Information, S6).24–26
9
Figure 2. Dark-field microscopy image (a) and corresponding scattering spectral change (b) of a
single 100-nm-diameter AuNP supported on a sapphire substrate pre- and post-laser irradiation (Ip :
8.8 mW µm−2, t = 10 4 s) in 0.05 M (mol L−1) SDS solution. Post-laser irradiation, a permanent
LSPR shift of 57 nm is observable. Time-dependent LSPR red shifts with enhanced scattering spectral intensities for a single 100-nm-diameter AuNP at 4-s irradiation intervals in (c) 5% PEG 6000 solution, and (d) in 0.05 M SDS solution on a sapphire substrate (Ip: 8.8 mW µm−2).
10
To exclude shifts originating from melting-induced particle shape deformations, we compared the LSPRs pre- and post-laser irradiation in medium water for the maximum laser peak power density that was used in the experiments (8.8 mW µm−2 for 4 s). At this intensity, the
scattering spectral shape and measured LSPR peak positions obtained from Lorentzian fits after irradiation coincided with that before irradiation, suggesting negligible shape changes caused by laser heating (Supporting Information, S7). Note that the particle temperatures, TP = 364 – 411 K
(laser peak power densities: 5.3 − 8.8 mW µm−2), calculated with COMSOL Multiphysics 5.0 (see
Section 3) are below the onset of surface melting and bubble generation.28,29 We remark that when
we used a substrate of glass instead of sapphire, the LSPR scattering peak shift observed was 3 nm after illumination for 40 s at 4 mW µm−2, suggesting that thesapphire substrate is essential for
the observation.
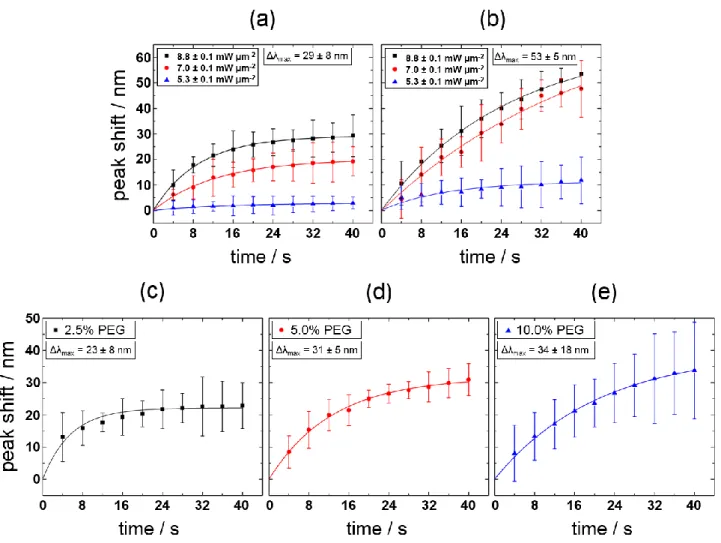
Clarifying the systematic effects of laser intensity and illumination period as well as the concentration of solutes is imperative. Figure 3a and b shows the time-evolution of the spectral shift with respect to the initial LSPR position at various laser intensities. The spectra were taken before and after laser illumination cycles of t = 4 s. Depending on the illumination period, we found that the LSPR peak position underwent a greater red shift at higher laser peak power densities. For a density of 8.8 mW μm−2, we observed a maximum red shift of Δλ = 29±8 nm for the PEG 6000
solution and Δλ = 53±5 nm for the SDS solution (original max = 582±6 nm). Both solutions show
an asymptotic trend that depends on the laser fluence applied. The threshold laser fluence for spectral shifts was observed approximately at 5 mW μm−2 for PEG and 4 mW μm−2 for SDS,
suggesting the nonlinear nature of the event. After turning off the laser, no further shifts were observed from the specimen left at ambient temperature. This suggests that the spectral shift occurs solely during illumination. Overall, we found that the particle temperature resulting from laser heating was decisive in controlling the observed spectral shifts.
11
Figure 3. Time dependence of the scattering spectral peak shifts for 100-nm-diameter AuNPs at
varying laser peak power densities for (a) 5% (weight/volume) PEG 6000 solution and (b) 0.05 M (> cmc 8 10−3 M) SDS solution under the illumination of 488-nm CW laser light. Each data point
represents measurements from five different particles that were illuminated at 4-s intervals (initial scattering peaks at 582±6 nm). The error bar represents the standard deviation for the measurements. The error for the laser peak power densities applied is estimated for uncertainties in intensity losses, originating from the objective lens and substrate interfaces. Scattering spectral peak shifts for 100-nm-diameter AuNPs as a function of time at varying PEG concentrations for (c) 2.5% PEG (d) 5% PEG and (e) 10% PEG solutions at constant laser peak power density (8.8±0.1 mW μm−2). Each
data point represents measurements from 10 different particles (initial scattering peaks at 584±3 nm). The error bar represents the standard deviation. Three 490-nm cutoff long-pass sharp-edge filters were used for the spectral measurement. The solid lines represent fits to the experimental data points.
12
Moderate errors in shifts observed may arise from particle-to-particle differences in positioning the focal point of the laser, small NP size variation, and possibly the varying nature of the particle surface. The higher peak shift observed for SDS than for PEG at the same laser peak power density is ascribed to the varying refractive index of a formed shell material given that the shell thickness of PEG is analogous to that of SDS (see Section 2 for detail).
With constant laser peak power density (8.8 mW μm−2) for AuNPs of similar sizes, the effects
of varying the concentration of PEG were investigated (Figure 3c−e). Aside from the laser intensity, the LSPR peak red shifts are strongly PEG concentration-dependent; we observed a greater peak shift for higher PEG concentrations. Moreover, the higher the PEG concentration, the longer it took to reach saturation. The 2.5% PEG solution gave a nearly constant level after five illumination cycles (in total 20 s) but 5% and 10% PEG solutions took longer to achieve saturation. The saturation seen in the 2.5% PEG can be ascribed to a deficit of polymers, originating from the low concentration. For 10 % PEG, we obtained a relatively large error because of particle-to-particle variations in shifts. Hence we observed an optimum concentration of 5% PEG for reproducible red shifts. To explain the red shifts along with the intensity enhancements, we assume the aggregation of PEG 6000 or SDS on the AuNP surface, which can result in an increase in refractive index sensed via LSPR. Importantly, the amount of shift observed here is remarkable considering the LSPR shifts observed for Au spheres submerged in media of high refractive index.24
2. Au core–organic shell structure
To find out the cause of the observed red shifts, we took SEM images of non-irradiated and irradiated AuNP samples (Figure 4). A notable increase in particle sizes occurs after irradiation. The SEM images clearly show the formation of a shell covering the AuNP core both for PEG (Figure
4b) and SDS (Figure 4c) as a result of laser heating. The images also suggest that shell surfaces are
13
Figure 4. SEM images of (a) a bare AuNP, (b) an AuNP irradiated in the presence of 5% PEG, and (c) an AuNP irradiated in the presence of 0.05 M SDS. The shells were formed with 10 illumination
cycles of 4 s (total 40 s) and a laser peak power density of Ip : 8.8 mW µm−2. (d) Calculated
scattering spectral peak wavelength as a function of shell thickness of a coated 100-nm-diameter AuNP. The calculation uses the Mie theory (red line: PEG 6000 (n = 1.47); black line: SDS (n = 1.461)). For the calculation, the refractive index of the surrounding medium was set to that of water (n = 1.33); the contribution of the sapphire substrate is neglected. With increasing shell thickness, the curve saturates for both shell materials. (e) Experimental scattering spectral peak shifts of nine AuNPs vs. corresponding shell thickness determined for PEG 6000 with an averaged shell thickness: 21±4 nm, peak shift: 35±4, initial scattering peak: 582±3 nm, scattering peak post-laser illumination: 617±4 nm, initial size: 102±3 nm and (f) Scattering spectral peak shifts vs. shell thickness for SDS with an averaged shell thickness: 22±6 nm, shift: 52±5, initial scattering peak: 585±5 nm, scattering peak of post-laser illumination: 637±7 nm, initial size: 105±5 nm. The error in the spectral peak position is set using a wavelength resolution of 0.5 nm. For shell thicknesses, an error of 5 nm is estimated that includes the uncertainty obtained from the size analysis.
14
In SEM studies, we observed no attachment of PEG or SDS after leaving AuNPs in solutions for 2 h without laser illumination; this is consistent with the absence of LSPR spectral shifts (Supporting
Information, S 8). Moreover, without AuNP, no accumulation was likely. This was confirmed as
follows: when we focused a laser spot for 10 s on the substrate surface, no spectral changes were observed for the background scattering signals from those in the absence of laser illumination.
We applied a simple core–shell model based on the Mie formalism to simulate the observed shifts (Figure 4d).30,31 The LSPR peak shifts as a function of shell thickness can be calculated based
on the refractive indices of the shell material and medium.The refractive index of the medium is assumed to be that of water (n = 1.33)(Supporting Information, S9); the refractive indices of PEG and SDS are given in the key legend of Figure 4d. For simplicity, the contribution from the sapphire substrate was neglected. The model suggests that a shell thickness of 80 nm is required for the observed shifts for PEG, which contrasts with the SEM measurements. Moreover, the model cannot explain the large red shifts observed for SDS using a refractive index for the material of 1.461. Therefore, we adjusted the refractive index of the shell material to the measured scattering spectral shift and particle size. Note that the calculated particle temperature is above the melting point of PEG 6000 of 333–336 K(32 and the Krafft point of SDS of 306 K,(33 so that a phase change
in the material is possible. To estimate the shell thickness using the Mie calculation, the initial scattering peak position gives us information about the exact size of the AuNP (Supporting
Information, S10). Using the peak positions after laser irradiation and the diameters of the core–
shell particles determined by SEM, we find the correlation between scattering shift and shell thickness (Figure 4e and f). Based on this data, we adjusted the refractive index for the shells using an averaged initial particle size of 102 nm with a shell thickness of 21 nm for PEG; similarly, an averaged initial particle size of 105 nm with a shell thickness of 22 nm was used for the SDS adjustment (Supporting Information, Figure S11a and b). After plotting the scattering spectral peak position as a function of shell refractive index calculated for PEG and SDS, we then
15
performed a linear fit to the calculated data (Supporting Information, Figure S11c and d). This leads to an adjusted refractive index of n = 1.65 for the 617-nm scattering peak of PEG and n = 1.76 for the 637-nm peak of SDS, both after laser illumination. Note that the scattering spectral shift is unaffected by small changes in the initial particle size for a fixed shell thickness (Supporting
Information, S12).
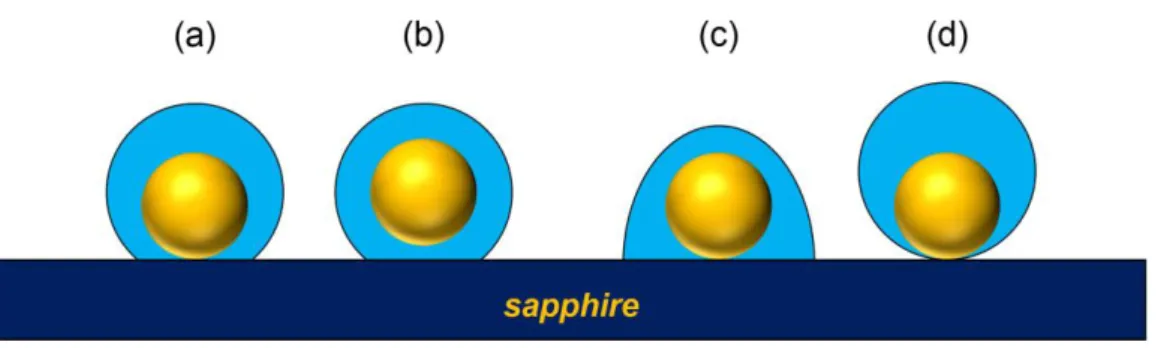
To reveal the significance of the adjusted refractive index, we need to examine the geometry of the Au core–organic shell structure. Figure 5 illustrates four cross-sectional views of the possible core–shell structures. We propose that the most probable geometry is the concentric spherical cap for which the Au core lies on the substrate and the shell grows from the substrate around it (Figure
5a). Within the same category is the formation for which a particle has a lifted Au core because of
inflowing polymers (Figure 5b). This configuration cannot be ignored while not knowing the interior of the core–shell structure; nevertheless, we believe that a core–substrate contact is the more probable. We provide reasons why the non-concentric structures of Figure 5c and d is less likely.
Figure 5.Pictorial representation of the possible cross-sectional geometries for the Au core–organic shell structures: (a) concentric spherical cap with AuNP on sapphire substrate, (b) concentric spherical cap with lifted AuNP, (c) a non-concentric spherical cap, and (d) AuNP on a sapphire substrate with non-concentric spherical shell.
16
The SEM images taken at a tilt angle of 30° did not show a precise boundary between the substrate surface and the organic shell, suggesting a nearly spherical geometry (Supporting Information,
S13). The side view is limited to low tilt angles because of the need to reference the particle
position, hence preventing the imaging of the contact of the particle with the substrate. Nevertheless, the formation of an upward-shift non-concentric spherical shell (Figure 5d) appears unfavorable because the attachment of polymers at pointlike contacts near the substrate would indicate an uneven growth of the shell.
Concerning the refractive index of n = 1.65 adjusted for PEG and n = 1.76 for SDS, the values are higher than those of ordinary polymers with n = 1.4 – 1.5. Moreover, the calculated particle temperatures during laser illumination are above the melting point for PEG 6000 and above the Krafft point for SDS. This may mean that during irradiation both species are liquid-like states on the AuNP surface. The phase transition may cause densification,leading to an increased refractive index of PEG and SDS. Additionally, the drying and the vacuum treatments of the samples for SEM imaging could densify the shell layer by removing water molecules. Nevertheless, our simulation has drawbacks.Because the Mie formalism assumes ideal core–shell structures and does not include effects of the substrate, numerical methods to solve the Maxwell equations should be implemented to perform an accurate spectral simulation including the shell geometry and the effect of the sapphire substrate. The applied model and the adjusted refractive index for PEG and SDS represent an initial step toward understanding the origin of the strong red shifts observed. It should be noted, however, that carbonization of PEG or SDS to form a graphite (refractive index: n + ik = 1.5 + 0.007i)34 shell is unlikely because the temperature increase of AuNP is restricted for short periods of
17
3. Driving mechanism
In this study, we used PEG 6000 and SDSas key materials for the nanofabrication initiated by laser heating of an AuNP. PEG is a nonionic coiled polymer frequently used as a capping agent for AuNPs. Through physical adsorption on the surface of metallic nanoparticles, steric stabilization of the PEG molecules is attained.35 The ionic surfactant SDS, which forms micelles at concentrations
above the critical micellar concentration (cmc) in aqueous solution, can attach to the AuNP surface, stabilizing the particle electrostatically.36 In aqueous solution, the aggregation number and cmc of
SDS are both functions of temperature; the aggregation number decreases with temperature from 65 at 293 K to 36 at 360 K, whereas the cmc slightly increases from 8 10−3 M at 298 K to 1.3 10−2
M at 353 K.37,38 In the absence of laser illumination, the numbers of adsorbed species are governed
by the adsorption equilibrium.
On exposure to laser illumination, we observed the aggregation and fixation of both PEG 6000 and SDS on the AuNP surface (Figure 4b and c). Here we present a discussion of the mechanism leading to the core–shell structure formation. In the present case, the optical trapping mechanism may not operate because a simple calculation suggests that the photon pressure potential exerted on a single PEG 6000 molecule (diameter: ~1 nm) or a SDS micelle (diameter: ~3 nm) is far smaller than their thermal energy, kBT (Supporting Information, S14).39 Although laser heating
of a single AuNP in a homogeneous medium generates a radial temperature distribution such as that given in Figure 1a, an AuNP supported on a high heat-conducting sapphire substrate can develop a strong directional temperature distribution (Figure 1b) because of the rapid cooling within the substrate.16 The anisotropic temperature distribution and resulting temperature gradient can drive
thermophoresis and convection. Previously, and on a much larger scale than our study, thermophoresis assisted by convection in a flat chamber enabled DNA molecules to accumulate within the cold region on a glass substrate when water molecules were heated by near-IR laser illumination.18 The temperature distribution in Figure 1b in which an AuNP under illumination is
18
lying on a sapphire substrate and surrounded by water medium in a chamber can be described by the heat conduction equation:15
( , ) ( ( , )) ( ) T r t c k T r t Q t t = + (1)
Here, ρ is the mass density, c the specific heat capacity, k the thermal conductivity of the system at the position r, and Q(t)the energy deposition term. Eq. 1 was solved in the steady-state regime. The numerical solution was obtained using COMSOL Multiphysics 5.0. The calculation was validated previously by a comparison of results with experimental particle temperatures.16
Particle temperatures in our experiment ranged up to 411 K for a laser peak power density of 8.8 mW µm−2 (Figure 6a). Temperature gradients as high as ~K nm−1 were estimated from
simulations of the interface between the particle and the sapphire substrate (Figure 6b). Previous studies of thermophoresis were performed with temperatures slightly higher than ambient temperature with temperature gradients of ~K m−1.8,9,18−21 Here, because of the Laplace pressure,
the onset of bubble generation on heating AuNP occurs at ~570 K, well above the boiling point of water at ambient pressure.40 With the temperature gradient driving thermophoresis,8,9 its basic
equations are given by:9
v= − DT T (2) c r( )=c0exp[−ST T] (3) T T D S D = (4) J = −cDT − T D c (5)
19
Figure 6. (a) Calculated particle temperature as a function of applied laser peak power density for a
100-nm-AuNP supported on sapphire (red line) and glass (blue line) substrates submerged in water. Note that the water temperature is the same as the particle temperature at the NP surface. To calculate temperature, we used the thermal conductivity of water because the contribution of PEG or that of SDS is minor. (b) Illustration of the magnitude of the temperature gradient (up to 4.5 K nm−1 (Tp = 411K)) at the interface between the particle and the sapphire substrateand the expected
solute flow. Note that the values of the temperature gradient scale with particle temperature whereas the shape of the temperature gradient is unaffected as long as the temperature distribution scales linearly with temperature. (c) Schematic illustration of a postulated core-shell formation. I. Before laser irradiation, the system is in thermal equilibrium. II. Diffusional flow (thermophoresis and Marangoni convection) of the solutes towards the AuNP, leading to solute depletion in solution in the area between the NP and substrate simultaneously with an accumulation arising from the capillary effect. III. Phase transition of solutes around a hot NP builds up a liquid layer over the particle surface, forming a shell of high density. IV. After terminating the laser irradiation, the solutes solidify, encapsulating the AuNP.
20
where v is the drift velocity, DT the thermophoretic mobility, T the temperature gradient, J the flux
of molecular drift, D the diffusion coefficient, c the concentration, and ST the Soret coefficient. Note
that a positive DT occurs for thermophobic solutes that move from hot to cold whereas a negative
DT is assigned to thermophilic ones that tend to move from cold to hot. According to the literature,41, 42 the D
T values for PEG 6000 and SDS are both positive and not directly compatible with the
migration of solute to a hot region.
Figure 6c illustrates a scheme for the postulated solute migration, aggregation and shell
formation. Here we provide a qualitative explanation of the core–shell observation. This is because a detailed analysis is not possible as parameter values for calculations using Eqs. 2−5 are lacking at high temperatures with strong temperature gradients. In Eq. 5, the first term on the right-hand side represents the thermophoretic flow, which is directed away from the hot NP assuming that DT is
positive. We start from thermal equilibrium given in step I. On heating, the anisotropic temperature gradient is induced in the areas of a strong temperature gradient represented by lighter colors (see Figure 6b), especially near the NP/substrate/solution interface. Thermophoretic flow caused by the temperature gradient allows the migration of solutes, causing a strong solute depletion whereas only a weak solute depletion occurs in the areas of a lower temperature gradient (step II). Here the solute depletion can be maintained, aided at the interface by the capillary effect.43 This effect is
responsible for the initial aggregation of solutes on the surfaces of AuNP and substrate by depriving of PEG or SDS from solution because the capillary force can induce a phase separation. 43,44 Then,
represented by the second term on the right-hand side of Eq. 5, diffusional flow sets in and is directed towards the areas of low solute concentration caused by c. With thermal non-equilibrium, the balance of the two competing terms is no longer held and a directional solute migration results (step III). Thus a vertical flow occurs from the lower side of the particle to the area of high temperature gradients and high solute depletion (see Figure 6b). The detailed account of this vertical flow is given in Supporting Information S15.
21
The initial aggregation at the step IIis followed by fluid-like state formation because of the high temperature of the AuNP. The fluid-like state formed for SDS adsorbed on surfaces can be understood in analogy with the state resulting from melting transition or gel-fluid phase transition observed in liquid membranes.45 Given that the equilibrium adsorption can no longer occur under
these circumstances, accumulation without detachment may continue under laser illumination. The SEM images in Figure 4 showed well-covered particles so that the liquid solute builds up along the hot AuNP surface. Because the fluid-like state formation of PEG and SDS can be achieved in the area of high temperature, their dense shells form only on the NP surfaces. When laser illumination terminates, the temperature equilibrates rapidly and the solutes solidify, encapsulating the AuNP with a shell of high density (step IV). The possible mechanism discussed here is consistent with the core-shell structure postulated in Section 2.
From a mass transfer point of view, the convective flow of solutes and solvents as well as the thermophoresis of solutes should be considered. The strong temperature gradient induced by laser heating of an AuNP can induce both Marangoni and thermal convections simultaneously. The Marangoni convection is driven by interfacial tension gradient of solution, which is caused by the temperature gradient.46 In our case, the laser heating of an AuNP decreases the tension of solution
near the NP/substrate/solution interface resulting in convective flow. Hence the Marangoni convection flow directed towards the interface supplementary contributes to the mass transfer to induce solute aggregation on the AuNP. The interplay between thermophoretic and Marangoni convection flows has been reported recently.47,48 Of these, Seidel and coworkers48 suggested that
thermophoresis prevails over convection. Nonetheless, thermal convective flow is generated because of fluid density change according to temperature gradient. To model heat conduction and convection through a fluid, the heat equation including a convection term was used:49
( , ) ( ( , ) ( , ) ( , )) ( ) T r t c k T r t cT r t v r t Q t t = − + (6)
22
where v r t( , ) is the fluid velocity. The calculation was performed using COMSOL Multiphysics;
the steady state was reached in a few hundred milliseconds (Supporting Information, S16a–d).
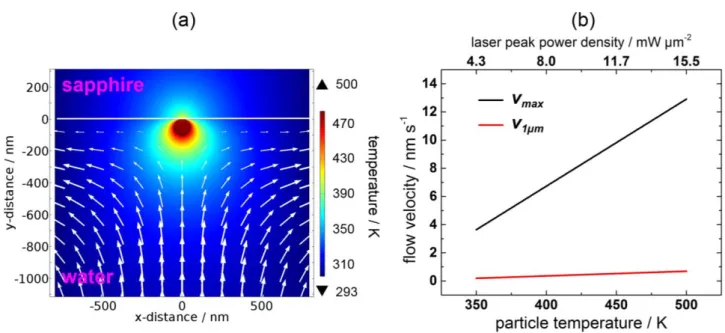
Figure 7a shows the overview of the convection flow near the AuNP and Figure 7b shows the
magnitude of the flow velocity as a function of particle temperature. The peak velocity of 12.9 nm s−1 in the middle of the chamber is slow even for high particle temperatures of up to 500 K. The
corresponding calculations are given in Supporting Information, S16e–h. A small velocity of 0.7 nm s−1 was obtained 1 µm distant from the AuNP. Accordingly, thermal convection appears not to
contribute greatly in the solute aggregation observed here. In this regard, the Baffou group has demonstrated a negligible role for convective heat transfer and flow velocity around nanometer-sized plasmonic structures.49
Figure 7. (a) Simulation of the 2D temperature distribution and the emerging thermal convective
flow (white arrows) from optical heating of a 100-nm-diameter AuNP. The particle temperature was set to 500 K and generated a flow velocity of 0.7 nm s−1 obtained 1 µm in front of the AuNP. (b)
Flow velocity as a function of particle temperature and the corresponding laser peak power density. The solid black line gives the peak velocity of the emerging flow in the chamber and the solid red line gives the velocity calculated 1 µm in front of the AuNP. The calculations were performed by numerically solving Eq. 6 under the steady-state condition with COMSOL Multiphysics 5.0 (http://www.comsol.com).
23
According to the literature, at least two groups experimentally investigated trapping phenomena based on optical heating of an AuNP or an Au nanostructure. Tsuboi and coworkers demonstrated a 2D closely packed assembly of polystyrene nanospheres on the Au nanostructure, triggered by gap-mode LSPR excitation.50 They ascribed the trapping mechanism to the interplay of forces from radiation (optical trapping), thermophoresis, and thermal convection induced by laser irradiation. Orlishausen and Köhler observed the formation of aggregates of the thermoresponsive polymer poly(N-isopropylacrylamide) (PNIPAM) that formed around laser heated AuNPs.51 They
concluded that the increasing polymer concentration around the heated AuNP is quite unusual because the Soret effect or thermophoresis should drive the polymer in the opposite direction, away from the hot center. These observations are in accord with the present finding. Although the theoretical background for understanding these phenomena is still insufficient, thermally driven accumulation phenomena are gaining more and more credibility.
24
Conclusion
In this study, we achieved fabrication of an Au core−organic shell structure through optical heating of a single AuNP supported on a sapphire substrate in aqueous PEG and SDS solutions. The finding was evidenced by SEM images and supported by optical spectroscopic measurements at the single particle level. Thermophoresis at the nanoscale is responsible for the nanofabrication of these core−shell particles. The result demonstrates a significant scale-down in the thermophoretic manipulation because the previous studies were limited to the micrometer scale. Nanoscale thermophoresis is challenging because of extremely high temperature gradients created by thermal confinement, in which the combination of a nanoscale heating source and a substrate with remarkable cooling capability is prerequisite to attain temperature gradient shaping. Although previous experiments revealed that trapping macromolecules and colloids resulted from the interplay of thermophoresis and thermal convection, our current study showed that thermophoresis and capillary-induced phase separation, assisted by Marangoni convective flow, are responsible for aggregation and confinement. The present technique of nanofabrication needs to be extended to other species such as small molecules, bio- and thermosensitive-polymers, and inorganic and organic colloids to examine its applicability. For such experiments, particular attention must be given to the sign of DT to reveal mechanistic aspects more precisely.
25
ASSOCIATED CONTENT Supporting Information
The Supporting Information is available free of charge on the ACS Publications website at DOI: 10.1021/acs.jpcc.
Particle image and the corresponding histogram, experimental setup, Mie spectral calculations, additional SEM images, estimated optical trapping potential, 2D temperature distributions in water/glass, supplement to driving mechanism, and convective flow simulation.
AUTHOR INFORMATION Corresponding Author
* Phone: 81-88-656-7389, Fax: 81-88-656-7598, E-mail: [email protected]
Author Contributions
M.E. carried out optical measurements. M.E. and S.M. analyzed the data and performed the simulation. T.U. calculated optical-trapping forces and contributed to constructing a mechanism. S.H. designed the experiment. M.E and S.H. wrote the manuscript with contributions from all authors. All authors have given approval to the final version of the manuscript.
Notes
The authors declare no competing financial interest.
ACKNOWLEDGMENTS
Financial support from JSPS KAKENHI (Grant No. 26286004) is gratefully acknowledged. We thank Satoshi Sugano for their technical support in SEM imaging.
26
References
1. Ashkin, A. Acceleration and Trapping of Particles by RadiationPressure. Phys. Rev. Lett. 1970, 24, 156−159.
2. Jonas, A.; Zemanek, P. Light at Work: The Use of Optical Forces for Particle Manipulation, Sorting, and Analysis. Electrophoresis 2008, 29, 4813–4851.
3. Quidant, R.; Girard, C. Surface-Plasmon-Based Optical Manipulation. Laser Photon. Rev. 2008, 2, 47−57.
4. Shoji, T.; Tsuboi, Y. Plasmonic Optical Tweezers toward Molecular Manipulation: Tailoring Plasmonic Nanostructure, Light Source, and Resonant Trapping. J. Phys. Chem. Lett. 2014, 5, 2957−2967.
5. Braun, M.; Cichos, F. Optically Controlled Thermophoretic Trapping of Single Nano-Objects. ACS Nano, 2013, 7, 11200–11208.
6. Jiang, H-R.; Yoshinaga, N.; Sano, M. Active Motion of Janus Particle by Self-thermophoresis in Defocused Laser Beam. Phys. Rev. Lett. 2010, 105, 268302.
7. Bregulla, A. P.; Yang, H; Cichos, F. Stochastic Localization of Microswimmers by Photon Nudging. ACS Nano 2014, 8, 6542–6550.
8. Duhr, S.; D. Braun, D. Why Molecules Move along a Temperature Gradient. Proc. Natl. Acad. Sci. USA, 2006, 103, 19678–19682.
9. Würger A. Thermal Non-equilibrium Transport in Colloids. Rep. Prog. Phys, 2010, 73, 126601.
10. Landers J. P.; Handbook of Capillary and Microchip Electrophoresis and Associated Microtechniques, 3rd Ed. CRC Press: Boca Raton, FL, 2009.
11. Rabilloud T.; Vaezzadeh A.R.; Potier N.; Lelong C.; Leize-Wagner E.; Chevallet M.; Power and Limitations of Electrophoretic Separations in Proteomics Strategies. Mass Spectrom. Rev.
27
12. Baffou, G; Ureña E. B.; Berto, P; Monneret, S.; Quidant, R.; Rigneault, H. .Deterministic Temperature Shaping using Plasmonic Nanoparticle Assemblies. Nanoscale 2014, 6, 8984– 8989.
13. Qin, Z.; Bischof, J. C. Thermophysical and Biological Responses of Gold Nanoparticle Laser Heating. Chem. Soc. Rev. 2012, 41, 1191–1217.
14. Hashimoto, S.; Werner, D.; Uwada, T. Studies on the Interaction of Pulsed Lasers with Plasmonic Gold Nanoparticles toward Light Manipulation, Heat Management, and Nanofabrication. J. Photochem. Photobiol. C: Rev. 2012, 13, 28−54.
15. Baffou, G.; Quidant, R. Thermo-plasmonics: using Metallic Nanostructures as Nano-sources of Heat. Laser Photonics Rev. 2013, 7, 171–187.
16. Setoura, K.; Okada, Y.; Werner, D.; Hashimoto, S. Observation of Nanoscale Cooling Effects by Substrates and the Surrounding Media for Single Gold Nanoparticles under CW-Laser Illumination. ACS Nano, 2013, 7, 7874–7885.
17. Ramachandran P. A.; Advanced Transport Phenomena: Analysis, Modeling, and Computations. Cambridge University Press: Cambridge, UK, 2014.
18. Braun, D; Libchaber, A. Trapping of DNA by Thermophoretic Depletion and Convection. Phys. Rev. Lett. 2002, 89,188103.
19. Duhr, S; Braun, D. Thermophoretic Depletion Follows Boltzmann Distribution. Phys. Rev. Lett.
2006, 96, 168301.
20. Duhr, S.; Braun, D. Two-dimensional Colloidal Crystals Formed by Thermophoresis and Convection. Appl. Phys. Lett. 2005, 86, 131921.
21. E. Flores-Flores, S. A. Torres-Hurtado, R. Páez, U. Ruiz, G. Beltrán-Pérez, S. L. Neale, J. C. Ramirez-San-Juan, R. Ramos-García Trapping and Manipulation of Microparticles using Llaser-induced Convection Currents and Photophoresis. Biomed. Opt. Express 2015, 6, 4079−4087.
28
22. Frens, G. Controlled Nucleation for the Regulation of the Particle Size in Monodisperse Gold Suspensions. Nature Phys. Sci. 1973, 241, 20–22.
23. Strasser, M.; Setoura, K.; Langbein, U.; Hashimoto, S. Computational Modeling of Pulsed Laser-Induced Heating and Evaporation of Gold Nanoparticles. J. Phys. Chem. C, 2014, 118, 25748–25755.
24. Underwood, S.; Mulvaney, P. Effect of the Solution Refractive Index on the Color of Gold Colloids. Langmuir, 1994, 10, 3427–3430.
25. Mayer, K. M.; Hafner, J. H. Localized Surface Plasmon Sensors. Chem. Rev. 2011, 111, 3828– 3857.
26. Truong, P. L.; Ma, X.; Sim, S. J.; Resonant Rayleigh Light Scattering of Single Au Nanoparticles with Different Sizes and Shapes. Nanoscale, 2014, 6, 2307–2315.
27. Keblinski, P.; Cahill, D. G.; Bodapati, A.; Sullivan, C. R.; Taton, T. A. Limits of Localized Heating by Electromagnetically Excited Nanoparticles. J. Appl. Phys., 2006, 100, 054305. 28. Setoura, K.; Okada, Y.; Hashimoto, S. CW-laser-induced Morphological Changes of a Single
Gold Nanoparticle on Glass: Observation of Surface Evaporation. Phys. Chem. Chem. Phys.
2014, 16, 26938–26945.
29. Setoura, K.; Werner, D; Hashimoto, S Optical Scattering Spectral Thermometry and Refractometry of a Single Gold Nanoparticle under CW Laser Excitation. J. Phys. Chem. C,
2012, 116, 15458−15466.
30. Mie, G. Beiträge zur Optik trüber Medien, Speziell Kolloidaler Metallösungen Ann. Phys. 1908, 25, 377−445.
31. Bohren, C. F.; Huffman, D. R. Absorption and Scattering of Light by Small Particles; Wiley: New York, 1983.
29
32. Van den Mooter, G.; Augustijns, Blaton, P.; N.; Kinget, R. Physico-chemical Characterization of Solid Dispersions of Temazepam with Polyethylene Glycol 6000 and PVP K30. Int. J. Pharmaceutics 1998, 164, 67–80.
33. Shinoda, K.; Yamaguchi, N.; Carlsson, A.; Physical Meaning of the Krafft Point: Observation of Melting Phenomenon of Hydrated Solid Surfactant and the Krafft Point. J. Phys. Chem.
1989, 93, 7216−7218.
34. Djurišić, A. B.; Li, E. H. Optical Properties of Graphite.J. Appl. Phys. 1999, 85, 7404−7410. 35. Seol, S. K.; Kim, D.; Jung, S.; Chang, W. S.; Kim, J. T. One-Step Synthesis of PEG-Coated
Gold Nanoparticles by Rapid Microwave Heating. J. Nanomater. 2013, 2013, 531760.
36. Mafune, F.; Kohno, J.; Takeda, Y.; Kondow, T.; Sawabe, H. Formation of Gold Nanoparticles by Laser Ablation in Aqueous Solution of Surfactant. J. Phys. Chem. B 2001, 105, 5114–5120. 37. Paula, S.; Sus, W.; Tuchtenhagen, J.; Dlume, A. Thermodynamics of Micelle Formation as a
Function of Temperature: A High Sensitivity Titration Calorimetry Study. J. Phys. Chem. 1995, 99, 11742–11751.
38. Hammouda, B. Temperature Effect on the Nanostructure of SDS Micelles in Water. J. Nat. Inst. Stand. Technol. 2013, 118, 151–167.
39. Uwada, T.; Sugiyama, T.; Masuhara, H. Wide-field Rayleigh Scattering Imaging and Spectroscopy of Gold Nanoparticles in Heavy Water under Laser Trapping. J. Photochem. Photobiol. A: Chem. 2011, 221, 187– 193.
40. Hou, L.; Yorulmaz, M.; Verhart, N. R.; Orrit, M. Explosive Formation and Dynamics of Vapor Nanobubbles around a Continuously Heated Gold Nanosphere. New. J. Phys. 2015, 17, 013050.
41. Chan J.; Popov J. J.; Kolisnek-Kehl S.; Leaist D.G.; Soret Coefficients for Aqueous Polyethylene Glycol Solutions and Some Tests of the Segmental Model of Polymer Thermal Diffusion. J. Solution Chem. 2003, 32, 197–214.
30
42. Vigolo D.; Buzzaccaro S.; Piazza R.; Thermophoresis and Thermoelectricity in Surfactant Solutions. Langmuir, 2010, 26, 7792–7801.
43. Olsson, M.; Per Linse, P.; Piculell, L. Capillary-Induced Phase Separation in Binary and Quasi-Binary Polymer Solutions. A Mean-Field Lattice Study. Langmuir 2004, 20, 1611-1619. 44. Wennerström, H.; Thuresson, K.; Linse, P.; Freyssingeas, E.; Long Range Attractive Surface
Forces Due to Capillary-Induced Polymer Incompatibility. Langmuir 1998, 14, 5664-5666. 45. Urban, A. S.; Fedoruk, M.; Horton, M. R.; Radler, J. O.; Stefani, F. D.; Feldmann, J. Controlled
Nanometric Phase Transitions of Phospholipid Membranes by Plasmonic Heating of Single Gold Nanoparticles. Nano Lett. 2009, 9, 2903−2908.
46. Uwada, T.; Fujii, S.; Sugiyama, T.; Usman, A.; Miura, A.; Masuhara, H.; Kanaizuka, K.; Haga, M. Glycine Crystallization in Solution by CW Laser-Induced Microbubble on Gold Thin Film Surface. ACS Appl. Mater. Interfaces 2012, 4, 1158−1163.
47. Vélez-Cordero, J. R.; Hernández-Cordero, J. On the Motion of Carbon Nanotube Clusters near Optical Fiber Tips: Thermophoresis, Radiative Pressure, and Convection Effects. Langmuir
2015, 31, 10066−10075.
48. Seidel, S. A. I.; Markwardt, N. A.; Lanzmich, S. A.; Braun, D. Thermophoresis in Nanoliter Droplets to Quantify Aptamer Binding. Angew. Chem. Int. Ed. 2014, 53, 7948 –7951.
49. Donner, J. S.; Baffou, G.; McCloskey, D; Quidant, R. Plasmon-Assisted Optofluidics. ACS Nano, 2011, 5, 5457–5462.
50. Shoji, T.; Shibata, M.; Kitamura, N.; Nagasawa, F.; Takase, M.; Murakoshi; K.; Nobuhiro, A.; Mizumoto, Y.; Ishihara, H.; Tsuboi, Y. Reversible Photoinduced Formation and Manipulation of a Two-Dimensional Closely Packed Assembly of Polystyrene Nanospheres on a Metallic Nanostructure. J. Phys. Chem. C 2013, 117, 2500−2506.
31
51. Orlishausen, M.; Köhler, W. Forced Phase Separation by Laser-Heated Gold Nanoparticles in Thermoresponsive Aqueous PNIPAM Polymer Solutions. J. Phys. Chem. B 2015, 119, 8217−8222.
32 TOC Graphical Abstract (8×4 cm)