The effect of different motivations for physical activity on the amount
of physical activity among the elderly who need nursing home care
Masaya Tanabe, MHS 1), Mikiya Tajima, MHS 2) and Akira Kimura, Ph.D.3)
Abstract: BACKGROUND: An attempt was made to categorize the motivations for physical activity and to investigate the frequency of physical activity motivations by proposing an objective method of assessing the initiation of physical activity based on physiological and non-physiological demands using a method actually named the wearable camera method. There are few reports on the effect of those frequencies on the actual amount of physical activity. Therefore, we investigated the effects of different motivations for physical activity on the amount of physical activity among elderly people who needed institutionalized care.
Objective: To investigate the effects of different reasons for physical activity on the amount of physical activity among elderly people who need institutionalized care.
SUBJECTS AND METHODS: The subjects were eight people living in a long-term care facility with a history of cerebrovascular disease and three with a diagnosis of dementia. There were 11 subjects, 2 males and 9 females, with an average age of 84 years and 90 years. The methods included behavioral recording and sequential interviewing of the subjects' reasons for their 24-hour activities using a stationary chest-mounted timed imaging device (recolo IR7; King Jim) and an IC recorder (ICD-PX440; SONY) to classify the motivation for each individual's physical activity, and to determine the motivation for activities based on physiological demands, The effects on the mean amount of physical activity divided into two groups by the median of the total time of activities based on non-physiological needs and preference and non-preference were evaluated by an unpaired t-test.
RESULTS: In the activity groups categorized by motivation for physical activity, there was a significant mean difference in the amount of physical activity by the amount of total time of the activity based on the person's non-physiological needs between the groups where the total time of the activity based on non-physiological needs was greater than 198.5 minutes and the group where the total time of the activity based on non-physiological needs was less than 198.5 minutes.
Conclusion: the amount of activity based on non-physiological needs had a significant effect on the amount of physical activity. Utilization of activities based on non-physiological needs is expected to be an effective method for the prevention of the syndrome of physical inactivity. Keywords: Institutionalized older adults requiring care, Physical activity level, Motivation
1)Akebono-en, a health care facility for the elderly; 2)Ichiyo-kan, a health care facility for the elderly; 3)Graduate School of Health Sciences, Gunma Paz University Corresponding Author:1) [email protected]
1. Backgrounds
Therefore, it is important to maintain physical activity (PA) during institutionalization to prevent recurrence of cerebral infarction and disuse to prevent further deterioration from vascular lesions. There is Kimura et al. reported that advice to increase physical activity based on the person's preferences by 10% of the amount of physical activity per day in free time, with a significant improvement in double product 1). We attempted to categorize physical activity motivations and examined their frequency by proposing an objective method of assessing the initiation of physical activity based on physiological and non-physiological demands, which we actually named the wearable camera method. There are few reports on the effect of those frequencies on the actual amount of physical activity. Therefore, we investigated the effects of different motivations for physical activity on the amount of physical activity among elderly people who needed institutionalized care.
2. Purpose
The purpose of this study was to determine the effect of different reasons for physically active behaviors on the amount of physical activity in institutionalized living.
3. Subjects and Methods
1. Subjects
Attributes of the subjects Out of 27 candidates, 11 subjects, 2 males and 9 females, were found to be cooperative. The mean (SD) of age was 84 (0) years for males and 90 years (5) for females; the height was 138.7(1.5) cm for males and 138.2 (4.3) cm for females; the weight was 48.3 (3.3) kg for males and 42.6(5.8) kg for females. Eight of them had a history of cerebrovascular disease and three had a diagnosis of dementia.
Selection criteria for the subjects
Criteria for selecting data capture: Data capture selection
1. late stage elderly persons who were 75 years of age or older and residing in a long-term care health care facility for the elderly. Sex conditions: the elderly
was considered to have cerebrovascular disease or motor organ diseases.
2. a minimum of 1 year and more than 5 days per day in which the amount of time spent in the supine and seated positions exceeds the amount of time spent in the standing position; that disorientation is maintained; that the patient is able to stand; and
3. be able to move the lower extremities (hip and knee joints) in isolation (Br. stage III or higher) if the patient is hemiplegic; and
4. They was assumed to be able to turn over.
The exclusion criteria were those who scored less than 10 on the revised Hasegawa Simplified Intelligence Rating Scale, those who could not speak, and those who could not turn over.
2. Research design
The research design was a cross-sectional and observational study.
1. participant recruitment methods.
About 20 participants who met the screening criteria were randomly selected based on the time frame of the study and the limitations of the measurement capability, and those who agreed to participate were selected as subjects.
The reasons for the subject's 24-hour behavior were recorded and interviewed sequentially using a chest-mounted, timed imaging device (recolo IR7; King Jim) (Figure 2) and an IC recorder (ICD-PX440; SONY).
A stationary chest-mounted imaging device was attached to the subject's chest to record the subject's behavior for 24 hours. In addition, the amount of physical activity for 24 hours was calculated based on the physical activity measurement method using a narrative camera using the time-lapse method (hereinafter referred to as the Capture Physical Activity (CPA) method), in which the subject's posture and continuous Time was estimated by applying the algorithm of the Position and Intensity Physical Activity (PIPA) method developed by Kimura et al.
2. Capture Physical Activity (CPA) determined from image analysis using narrative cameras.
In accordance with the methods of previous studies, the amount of physical activity over 24 hours was calculated by image analysis13).
A camera with time-lapse function (recolo IR7; King Jim's), which takes pictures once every 30 seconds, was used to record 24 hours of physical activity. In order to add to the camera body, elastic straps were attached to the upper and lower parts of the camera body with adhesive tape. Fixed to.
In the supine position, for example, the subject's view was the ceiling, the bed fence, the bedding, or a sideways man, etc. In the seated position, the subject's own upper extremities on a desk or armrest were in front of him. This was confirmed by the change in the image between when the shutter was pressed once and when it was pressed again. The strength of the posture was then classified into three categories of supine, seated and upright postures performed by Kimura et al. 3), which were low, medium and strong, and a combination of nine groups that could be adopted in the same way was used.
Estimation of physical activity (PA) (calories burned in 24 hours, posture and its intensity) using the Postural Intensity Physical Activity (PIPA) method of the Time of Living Structure Survey
The PIPA sheet was used to estimate the amount of physical activity. We used the PIPA spreadsheet developed by Kimura to input all the observation data into a 30-second macro software time series. The algorithm for estimating energy consumption had a large error in estimating PA for people with cerebrovascular disease, because it was the only method validated as a method for estimating physical activity in accordance with the movement characteristics of paralyzed people that reflected their activity content. The physical activity using the CPA method was applied to PIPA using the above method The PA was estimated by applying the measured data and the age, gender, and weight of the subjects to the PIPA sheet.
1. research period and location
The measurement period was from September 1, 2016 to November 31, 2016. The place of measurement was the Ichiyoukan nursing home for the elderly, Ichiyoukai Medical Corporation.
2. statistical analysis
Behavioral data were grouped by median and mean according to different reasons for physical activity
motivation, and the impact on outcomes was subjected to an unresponsive t-test for physical activity (PA). Statistical analysis was performed using SPSS.ver16 (SPSS, USA).
Ethical considerations.
Ethical considerations: in 2016, the work underwent a Gunma Perth Graduate School Ethics Review (PAZ16-18) and was approved.
4.Results
4-1. Life Time Structure and Life Space
The daily schedule of the facility users (living time structure) was 7:30 a.m. for breakfast, 10:00 a.m. for recreation and snack, 11:30 a.m. for lunch, 3:00 p.m. for recreation and snack, and 5:50 p.m. for dinner, and there was no major deviation from this schedule. In terms of living space, the living room was about 25 square meters, the hall (dining room) was about 100 square meters, and the average distance from the bed to the hall (dining room) was about 25 square meters ± 1.5 meters.
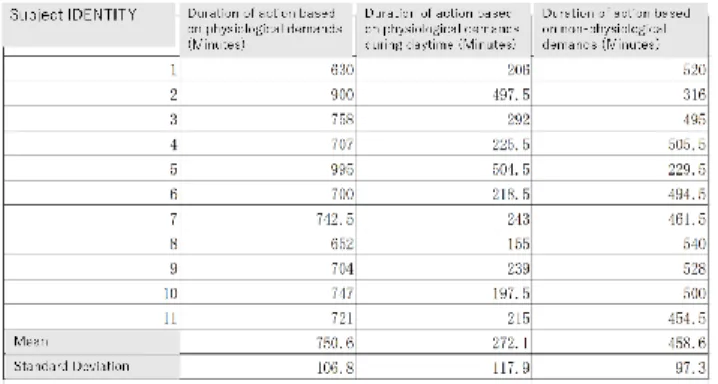
4-2. Actual quantity of physical activity by motive Reasons for physical activity were categorized based on the duration of activity obtained from camera images and reasons for behavior obtained by the listening method, and the total duration of each activity was determined.
We defined the time of action based on physiological needs, excluding the time of sleep at night, as the time of action based on physiological needs during the day. The mean and median duration of daytime physiological need-based behavior was 272.1 ± 112.5 minutes and 225.5 minutes, respectively, and the mean and median duration of non-physiological need-based behavior was 207.4 ± 128.0 minutes and 198.5 minutes, respectively. Non-physiological need-based behaviors were categorized into preferred activities (favorite activities) and activities that were unavoidable (disliked activities). The mean and median duration of the preferred activity was 174.8±132.0 minutes and 146 minutes, respectively, and the mean and median duration of the disliked activity was 21.1±24.4 minutes and 18.5 minutes, respectively.
4-3. Physical Activity Results 9
The mean amount of physical activity of the 11 subjects was 1078.0±194.7 kcal.
4-3-1. Physical activity by motive
The impact of physical activity types on outcomes The total time (minutes) of physiological need-based activities during the day is shown in Table 1 and the total time (minutes) of preference and non-preference activities is shown in Table 2.
Table 1 Total time (minutes) for physiological and non-physiological demand-based activities during the day
Table 2: Total time for preference and non-preference activities (minutes)
Figure 1 The relationship between the amount of physical activity and the amount of physical activity in groups divided by non-physiological need-based activities during the day.
4-4. the relationship between the amount of physical activity and the amount of physical activity of the group divided by the activities based on physiological needs during the day
Taking 225.5 minutes, the median of the total time of activity based on physiological needs during the day, as the representative value, and dividing it into groups in which the total time of activity based on physiological needs during the day is greater than 225.5 minutes and groups in which the total time of activity based on physiological needs during the day is less than 225.5 minutes, the mean amount of physical activity in the group in which the total time of activity based on physiological needs during the day is greater than 225.5 minutes 1046(124)kcal, and the mean physical activity in the group of 225.5 minutes or less was 1104(248) kcal. The results of the unpaired t-test showed no significant difference.
When the median total time of nonphysiologically activity, 198.5 minutes, was used as the representative value and the group was divided into two groups, one with a total time of nonphysiologically activity greater than 198.5 minutes and the other with a total time of 198.5 minutes or less, the mean physical activity of the group with a total time of nonphysiologically activity greater than 198.5 minutes was 2029.1(202.9) kcal and 198.5 minutes or less The mean amount of physical activity in the group with the highest physical activity was 984.5(140.6)kcal (Figure 1). The group with more non-physiological activity had a significant increase in physical activity compared to the group with less physical activity. (P=0.047) (95% CI: 4.09 to 449.96)
4-5. the relationship between the amount of physical activity and the amount of physical activity in groups divided by preference-based activities
When the median total time of preference activity (146 minutes) was taken as the representative value and divided into two groups: those whose total time of preference activity was more than 146 minutes and those whose total time of preference activity was less than 146 minutes, the mean physical activity in the group whose total time of preference activity was more than 146 minutes was 1201(196) kcal and the mean physical activity in the group whose total time of preference activity was less than 146 minutes was 974(52) kcal. No significant differences were found between the two groups as a result of unpaired t-tests. 10
When the median of the total time of non-preference activity (18.5 minutes) was used as the representative value and the total time of non-preference activity was divided into two groups: those whose total time of non-preference activity was greater than 18.5 minutes and those whose total time of non-preference activity was less than or equal to 18.5 minutes, the mean amount of physical activity in the group whose total time of non-preference activity was greater than 18.5 minutes was 1057(172) kcal, and the mean amount of physical activity in the group whose total time of non-preference activity was less than or equal to 18.5 minutes was 974(52) kcal. The mean activity level was 1095(226) kcal. The results of the unpaired t-test showed no significant difference between the two groups. The results of the unpaired t-test did not show a significant difference between the two groups.
5. Discussions
5-1. Physical Activity Results
The mean physical activity of the 11 subjects was 1078(194)Compared with the reported cut-off point of physical activity level of 1250kcal4), which indicates low activity in elderly people with hemiplegia, and the reported basal metabolic rate of over 70 years old (1290 kcal for men and 1020 kcal for women5), the subjects in this study are considered to be a low activity group. can be.
5-2. the impact of physical activity classification and typology
Physical activity as a function of the total time spent in activities based on physiological needs during the day Physical activity did not differ significantly between groups in which the total time spent in activities based on physiological needs during the day was greater than 225.5 minutes and groups in which the total time spent in activities based on physiological needs during the day was less than 225.5 minutes. The null hypothesis that there was no difference in the mean amount of physical activity between the groups with more and less total time for physiological need-based activities during the day was not rejected. It is unlikely that the variance in activity time based on physiological needs is itself an inherent range within this population. If the degree of variance in activity time based on nonphysiologically demands is greater due to the degree of variance in activity time based on
nonphysiologically demands, such as exhibiting frequent urination if it is in the influence of an underlying disease, e.g., diabetes, than the specificity of the movement disorder, then this would be a confounding factor, as it would affect both the motivation for physical activity and the amount of physical activity There may be a possibility that.
5-3. Effects of Preferred Activity on Physical Activity
There was a significant difference in the amount of physical activity between the groups with a total time of more than 146 minutes of preference activity and the groups with less than 146 minutes of preference activity. The null hypothesis that there was no difference in the mean amount of physical activity between the groups with more and less total time of preference activity was rejected.
Some of the subjects said, "I sleep because I have nothing to do. This suggests that those who are unable to perform their preferred activities spend their time in compensatory activities such as sleeping and napping, which are non-physiological needs. Those who were able to perform their own preferred activities were thought to have higher physical activity because the amount of physical activity in the sitting position was added to that of those who could perform their preferred activities.
5-4. Effects of non-preference activities on the amount of physical activity
There was no significant difference in the amount of physical activity between the groups in which the total time of non-preference activities was greater than 18.5 minutes and the groups in which the total time of non-preference activities was less than 18.5 minutes. The null hypothesis that there was no difference in the mean amount of physical activity between the groups with more and less total time for non-preference activities was not rejected. At the facility where the subject resided, the staff actively encouraged the subject to leave the bed and to spend time in a sitting position, in addition to mealtime. This ensured that the subject was able to spend time away from bed rather than constantly lying down. Since the favorite activities were also mainly activities that kept the subjects in a sitting position, it is possible that the group with less time for non-preferred activities was complementary with more time for preferred activities. However, there are some intermediate factors and 11
environmental-dependent motivations that are not completely antithetical to preference and non-preference motivations. The influence of those motivational factors may have an effect beyond the margin of error. It will be necessary to adjust for these factors and proceed with the analysis in the future.
Limitations of this study
A limitation of the present study is extrapolation in cases that do not meet the inclusion criteria for participants established in the present study, because the study was conducted under conditions that were relatively limited to elderly people over 75 years of age living in an institution with a relatively limited range of activities of daily living.
Physical activity by motivation by preference and non-preference includes intermediate and environmental-dependent motives that are not completely antithetical factors. The influence of those motivational factors may have an effect beyond the margin of error. The present study did not adjust for these factors, and it will be necessary to adjust for them in the future to further analyze them.
Looking ahead, new questions are emerging, such as whether paying more attention to the reasons for the individual's behavior, finding out what they really want to do, and providing an enabling environment will affect their health status. Research is needed on methods and means to naturally integrate physical activity into daily life in institutions and to provide health care for the elderly with indicators such as vascular function while ensuring quality of life.
6. Conclusion
In the activity groups that typified the motivation for physical activity, the amount of physical activity based on the individual's non-physiological needs showed a significant mean difference in the amount of physical activity for the groups whose total time of activity based on non-physiological needs was more than 198.5 minutes and for the groups whose total time of activity based on non-physiological needs was less than 198.5 minutes. It is hoped that encouraging physical activity through the setting up of the environment at the facility, including the individual's preferences, will be an effective method for preventing the syndrome of physical inactivity.
Acknowledgements
The authors would like to express their deepest gratitude to the elderly health care facility Ichiyokan, the residents of the facility, their families, and the staff for their cooperation in the data measurement of this study.
References
1.Kimura A, Miyagi S: A Pilot Study of Advice on Physical Activity in Senior Disabled Individuals in Rural Japan. 128-33.
2. Kimura, A.: Development of a Quantitative Evaluation Method for Daily Life Behavior. Public Health (Japanese). 1992.56(6):432-437
3.Kimura, Akira: Development of a method for estimating daily physical activity based on a combination of posture, work intensity and time and its validity in an adolescent population. Japanese Physical Therapy, 2004, 31(3): 147-154
4. Kimura R: Cut-off point for physical activity indicating low activity in elderly hemiplegic patients. JPTS, 2008,23(3):375-382
5. Ministry of Health, Labour and Welfare: Outline of Dietary Intake Standards for Japanese (2015). http://www.mhlw.go.jp/file/04-Houdouhappyou-10904 750-Kenkoukyoku- Gantaisakukenkouzoushinka/0000041955.pdf (viewed 15 March 2019) (Received 2019.3.26; Accepted 2020.8.15) 12