Electrochemical Quartz Crystal Microbalance
Analysis of Fuel Cell Reactions on Pt-Based
Electrocatalysts
A Doctoral Thesis Presented to the Interdisciplinary Graduate
School of Medicine and Engineering University of Yamanashi
March 2014
Contents
Chapter 1 : General Introduction
1-1. Background 1
1-2. Problems for developing anode and cathode catalysts in polymer
electrolyte fuel cells (PEFCs) 4
1-2-1. Anode catalysts 4
1-2-2. Cathode catalysts 4
1-2. Objective of the present research 5
1-3. References 7
Chapter 2 : Analysis of the CO oxidation reaction at Pt alloy
electrodes
2-1. Introduction 10
2-2. Experimental 12
2-3. Results and discussion 14
2-3-1. Mass changes at pure Pt with and without COad during the
potential sweep 14
2-3-2. Mass changes at Pt–Fe, Pt–Co, Pt–Ru alloys and pure Ru
with COad during potential sweep 17
2-3-3. Double-potential-step chronoamperometry (DPS-CA) combined with electrochemical quartz crystal microbalance (EQCM)
measurements at pure Pt, Pt–Fe and Pt–Co alloys with COad 21
2-3-4. DPS-CA combined with EQCM at pure Ru and Pt–Ru alloy with COad 27
2-4. Conclusion 31
2-5. References 32
Chapter 3 : Effect of adsorbed anions on the oxygen
reduction activities of Pt
3-1. Introduction 35
3-2-1. EQCM measurements 37 3-2-2. Rotating disk electrode (RDE) measurements 37
3-3. Results and discussion 39
3-3-1. Effect of HClO4 concentration on the EQCM response of Pt electrode 39
3-3-2. Effect of adsorbed anions on the ORR activities at the Pt-RDE 43 3-3-3. Mass changes of the Pt-EQCM during the ORR
in HF and HClO4 solution 47
3-3-4. Oxygen reduction reaction (ORR) mechanism on the Pt electrode
in HF, H2SO4 and HClO4 solutions 53
3-4. Conclusion 54
3-5. References 55
Chapter 4 : Analysis of the mechanism of enhanced oxygen
reduction reaction activity on Pt−Co electrode
4-1. Introduction 56
4-2. Experimental 57
4-3. Results and discussion 58
4-3-1. Effect of HClO4 concentration on the EQCM response of Pt
and Pt3Co alloy Electrodes 58
4-3-2. Effect of adsorbed anions on the ORR activities at the Pt3Co-RDE 62
4-3-3. Coverages of oxygen-containing species on the Pt3Co-EQCM 66
4-4. Conclusion 69
4-5. References 70
Chapter 5 : Analysis of the degradation reaction of
carbon-supported Pt cathode catalysts by potential cycling
5-1. Introduction 71
5-2. Experimental 72
5-2-1. EQCM cell and electrode preparation 72
5-2-2. Protocol of the ADT of Pt/carbon black (CB) and
Pt/graphitized carbon black (GCB) 72
5-3. Results and discussion 74
5-3-2. Effect of lower limit potential on the degradation of Pt/CB 76 5-3-3. Analysis of the viscosity on the Pt/GCB surface
by admittance measurements 79
5-4. Conclusion 82
5-5. References 84
Chapter 6 : General conclusions
86List of publications
88Meeting abstracts
89-1-
Chapter 1
General Introduction
1-1. Background
Energy utilization in modern societies is based on combustion of carbonaceous fuels, which are dominated by fossil fuels, such as coal, petroleum, and natural gas. However, a large amount of carbon dioxide, CO2, has been exhausted by
the direct combustion of fossil fuels from industry, transportation, households, and thermal power generation, resulting in the greenhouse effect.
At present, thermal power generation and nuclear power generation have been mainly used for the large-scale electric power supply. Nuclear power generation has a large risk of radioactive contamination. Because the energy conversion efficiency is usually lower than 40 % due to the limitation by the Carnot efficiency, the amount of CO2 emission is increasing after the severe accident at the Fukushima nuclear power
plant in 2011. Thus, we need alternative power generation systems, with higher energy conversion efficiency from fossil fuels and/or those based on renewable energy sources.
Power generation systems using renewable energy technologies such as photovoltaic cells and wind power have received considerable attention in recent years. Solar energy could also be used in endothermic chemical processes. The issues of concerns for renewable energy in general are low energy density, irregular availability, low energy efficiency, and high capital cost. Because the power output strongly depends on weather conditions, which may not always meet the demand, they cannot become the main basic power source. Thus, a large-scale, long-term storage system for renewable energy is necessary, in addition to that provided by batteries (small-scale & short-term). Hydrogen production by use of renewable power is a good option for such energy storage.
The fuel cell is expected to be one of the key technologies for effective energy conversion from a primary energy (reformed fossil fuel or hydrogen produced by renewable energy) into electricity, with co-generation of heat. The theoretical energy conversion efficiency of the electrochemical reaction of hydrogen with oxygen to generate liquid water is as high as 83 %. Even if hydrogen is generated by the reforming of a fossil fuel such as natural gas, the consumption of as fuel is reduced, in
-2-
principle, to half. This leads, of course, to a reduction of CO2 emissions by a factor of
two. Eventually, when hydrogen is produced by water electrolysis with the use of renewable energy, the fuel cell will become a completely clean system.
Polymer electrolyte fuel cells (PEFCs) have been developed as the primary power source for electric vehicles (FCEVs) and residential co-generation systems (CG-FCs), because they are operated at relatively low temperatures (from ambient temperature to ca. 100 oC). 1-3 The operation principle of PEFC is schematically shown in Figure 1-1. The single cell consists of the anode, cathode and the polymer electrolyte membrane (proton exchange membrane, PEM). Pure H2 or
reformed gas (H2 + CO2) is fed to the anode, and oxygen or air is fed to the cathode.
Protons (hydronium ions) and electrons are generated by the hydrogen oxidation reaction (HOR) at the anode. Protons move to the cathode through the PEM. The electrons move to the cathode through an external circuit. Protons and electrons react with oxygen at the cathode, and water is generated by the oxygen reduction reaction (ORR). These reactions are shown below.
Anode :H2 → 2H+ + 2e-
Cathode :1/2O2 + 2H+ + 2e -
→ H2O
Cell reaction :H2 + 1/2O2 → H2O
In the following section, I will describe several issues that must be solved for the widespread commercialization of PEFCs.
-3-
-4-
1-2. Problems for developing anode and cathode catalysts in polymer electrolyte fuel cells (PEFCs)
1-2-1. Anode catalysts
Platinum (Pt) and Pt-alloy catalysts have been employed as the anode catalyst for PEFCs. When pure hydrogen is used as the fuel gas in fuel cell vehicles (FCVs), the overpotential for the HOR at the Pt anode is negligibly small even at current densities as high as 1 A cm−2. In contrast, reformate fuels, produced by the reforming of hydrocarbon (city gas, propane, and kerosene), are mainly used in stationary uses such as residential cogeneration fuel cells. When such a reformate is directly supplied to the Pt anode, the performance decreases rapidly, because the Pt anode catalyst is seriously poisoned by trace amounts of CO.4,5 Thus, anode catalysts with higher CO tolerance are necessary for stationary PEFCs.
An enhanced CO-tolerance has been found at Pt electrodes with adatoms such as Ru, Sn and As6-11 and Pt-M alloys (M = Ru, Rh, Sn, Mo, etc.).12-17 Among these, only the Pt-Ru alloy has been used as a practical anode catalyst for reformate-fuel cells or direct methanol fuel cells, in which CO is generated as a reaction intermediate. Considering the cost and resources of Ru, it is necessary to develop anode catalysts with higher CO-tolerance with lower cost. Watanabe et al. have reported that the Pt-M (M = Fe, Co, Ni, etc.) catalysts exhibited high CO-tolerant HOR activity at the same level as that of the PtRu alloy.18-23 In order to obtain a clue for designing for anode catalysts with higher CO-tolerance than conventional ones, further understanding of the CO-tolerant mechanism at these Pt-alloy electrodes is very important.
1-2-2. Cathode catalysts
Because precious metals such as Pt exhibit high electrocatalytic activity and corrosion resistance at high potentials in the highly acidic polymer electrolyte, they are mainly used as the cathode catalyst in polymer electrolyte fuel cells. The amount of expensive Pt must be reduced for cost reduction and also due to the limited availability. Recently, the non-precious-group metal (NPGM) catalysts have been investigated. However, the ORR activity of NPGM catalysts is very low compared with Pt, and the durability under practical operating conditions is still questionable. Thus, in the early commecialization stage, it is more realistic to increase the ORR activity of the Pt cathode catalyst and to reduce the amount of Pt. Additionally, since the PEFCs are generally operated at low temperature (<100 oC), the overpotential for the ORR at the
-5-
Pt cathode usually exceeds 100 mV at current densities as low as several mA cm−2. Recently, it has been reported for planar electrodes in acid electrolyte solutions that the ORR activity is enhanced at Pt alloyed with nonprecious metal elements such as Fe,24-29 Co,24,26,28-33 Ni,24,26,27,29-32,34-36 Mn,24 Cr,29-31,33,37,38 and V.39 Watanabe et al. have examined the enhanced ORR activity mechanism of these alloys by X-ray photoelectron spectroscopy combined with an electrochemical cell (EC-XPS), and suggested the reaction mechanism shown in Figure 1-2.40 However, the EC-XPS analysis is not in-situ, because the working electrode was taken out from the electrolyte solution into ultrahigh vacuum. Thus, in order to obtain a clue for designing cathode catalysts with higher performance than conventional ones, further understanding of the mechanism of the enhanced ORR activity at Pt-alloy electrodes is very important.
Furthermore, the durability of the electrocatalysts during the PEFC operation is insufficient. In addition to the electrolyte membrane, it has been reported that the degradation of Pt-based cathode catalysts is dominant, rather than the anode catalyst.41-48 To increase the electrochemically active surface area (ECSA) for fuel cell reactions at minimum Pt loading, the cathode catalyst employed so far consists of Pt nanoparticles dispersed on high-surface-area carbon black (CB) supports. However, commercial Pt/CB cathode catalysts are severely degraded by carbon corrosion at high potentials caused by start/stop cycles or fuel starvation.49-56 Thus, in order to improve the durability of Pt/C catalysts, the analysis of the degradation mechanism of the Pt/C catalyst is required as soon as possible.
1-2. Objective of the present research
In order to improve fuel cell performance and durability, further understanding of the reaction mechanism at the anode and cathode catalyst is very important. For the study of the fundamental properties of catalysts, it is necessary to analyze the electrode surface structure at the atomic or molecular level. In our group, the reaction mechanism of catalysts has been analyzed by EC-XPS, electrochemical scanning tunneling microscopy (EC-STM), and in-situ attenuated total reflection
O
2O
2,ad2
O
ad2
OH
adH
2O
(dissociation equilibrium)
(adsorption equilibrium) 2 H++ 2 e−
2 H++ 2 e−
(r.d.s)
-6-
Fourier transform infrared spectroscopy (ATR-FTIR), etc. The EC-XPS, EC-STM, and ATR-FTIR techniques, respectively, provide information on the electronic states, atomic-scale structure, and the nature and configuration of the adsorbed species. In contrast, the electrochemical quartz crystal microbalance (EQCM) sensitively detects nanogram-level (atomic or molecular-level) mass changes during the electrode process. This is a powerful tool to study the reaction mechanism on the electrode surface, and can complement the results obtained by the other methods described above. In the present research, the CO oxidation reaction at Pt alloy electrodes and the mechanism of enhanced ORR activity on Pt alloys were investigated by using the EQCM. Additionally, the degradation of commercial Pt catalyst during potential cycles was analyzed. These results have a large influence for the improvement of PEFC performance.
In Chapter 2, using EQCM combined with chronoamperometry (CA) and cyclic voltammogrammetry (CV), the CO adsorption/oxidation reactions on Pt, Pt-Co, Pt-Fe and Pt-Ru electrodes surface were analyzed quantitatively. The elementary steps for the initial process of CO oxidization have been clarified.
In Chapter 3, the effect of the adsorption of various anions on the ORR activity at the Pt electrode is investigated quantitatively. It was found that perchlorate anions adsorb specifically on Pt with a Frumkin-Temkin type adsorption isotherm. A reversible mass change for one or more adsorbed oxygen species on the Pt-EQCM has been detected, for the first time, in O2-saturated and He-purged HF and HClO4
solutions.
In Chapter 4, I also clarified the anion adsorption on a Pt-Co alloy electrode, and analyzed the mechanism of enhanced ORR activity. The coverages of oxygen species θOx on the Pt-skin/Pt3Co in the potential range from 0.86 to 0.96 V in
the O2-saturated 0.01 M HClO4 solution were found to be larger than those on pure Pt,
providing strong evidence that the higher O2 reduction activity on the Pt3Co is
correlated with higher θOx, contrary to the conventional view.
In Chapter 5, in order to clarify the degradation process of Pt/C, the degradation of Pt/CB and Pt/graphitized carbon black (GCB) during potential cycling was investigated by using the EQCM. It was found that CB was degraded in the low potential region of hydrogen adsorption/desorption, after a high potential was applied to Pt/CB, simulating the start/stop cycles in FCVs.
-7-
1-3. References
(1)Dhar, H. P. J. Electroanal. Chem. 1993, 357, 237-250. (2)Steele, B. C. H.; Heinzel, A. Nature 2001, 414, 345-352.
(3)Carrette, L.; Friedrich, K. A.; Stimming, U. Fuel Cells 2001, 1, 5-39. (4)Lemons, R. A. J. Power Sources 1990, 29, 251-264.
(5)Igarashi, H.; Fujino, T.; Watanabe, M. J. Electroanal.Chem. 1995, 391, 119‒123. (6)Watanabe, M.; Motoo, S. J. Electroanal. Chem. 1975, 60, 267.
(7)Watanabe, M.; Motoo, S. J. Electroanal. Chem. 1976, 69, 429. (8)Watanabe, M.; Motoo, S. J. Electroanal. Chem. 1980, 110, 103. (9)Watanabe, M.; Motoo, S. J. Electroanal. Chem. 1980, 110, 261. (10)Watanabe, M.; Motoo, S. J. Electroanal. Chem. 1985, 187, 161. (11)Watanabe, M.; Motoo, S. J. Electroanal. Chem. 1985, 194, 275.
(12)Gasteiger, H.A.; Markovic, N.; Ross Jr. P.N.; Cairns E.J. J. Phys. Chem. 1994, 98, 617–625.
(13)Gasteiger, H.A.; Markovic, N.; Ross Jr., P.N. J. Phys. Chem. 1995, 99, 8945–8949.
(14)Grgur, B.N.; Zhuang, G.; Markovic, N.; Ross Jr., P.N. J. Phys. Chem. B 1997, 101, 3910–3913.
(15)Ross, P. N.; Kinoshita, K.; Scarpellino, A. J.; Stonehart, P. J. Electroanal. Chem.
1975, 59, 177.
(16)Ross, P. N.; Kinoshita, K.; Scarpellino, A. J.; Stonehart, P. J. Electroanal. Chem.
1975, 63, 97.
(17)Mukerjee, S.; Urian, R. C.; Lee, S.J.; Ticianelli, E. A.; McBreen, J. J. Electrochem. Soc. 2004, 151, A1094.
(18)Watanabe, M.; Igarashi, H.; Fujino, T. Electrochemistry 1999, 67, 1194–1196. (19)Watanabe, M.; Zhu, Y.; Uchida, H. J. Phys. Chem. B 2000, 104, 1762–1768. (20)Watanabe, M.; Zhu, Y.; Igarashi, H.; Uchida, H. Electrochemistry 2000, 68, 244–251.
(21)Igarashi, H.; Fujino, T.; Zhu, Y.; Uchida, H.; Watanabe, M. Phys. Chem. Chem. Phys. 2001, 3, 306–314.
(22)Wan, L.J.; Moriyama, T.; Ito, M.; Uchida, H.; Watanabe, M. Chem. Commun.
2002, 58–59.
(23)Uchida, H.; Ozuka, H.; Watanabe, M. Electrochim. Acta 2002, 39, 3629–3636. (24)Mukerjee, S.; Srinivasan, S.; Soriaga, M. P.; McBreen, J. J. Electrochem. Soc.
-8-
(25)Toda, T.; Igarashi, H.; Watanabe, M. J. Electroanal. Chem. 1999, 460, 258‒262. (26)Toda, T.; Igarashi, H.; Uchida, H.; Watanabe, M. J. Electrochem. Soc. 1999, 146, 3750‒3756.
(27)Toda, T.; Honma, I. Trans. Mater. Res. Soc. Jpn. 2003, 28, 215‒220. (28)Xiong, L.; Manthiram, A. Electrochim. Acta 2005, 50, 2323‒2329. (29)Mukerjee, S.; Srinivasan, S. J. Electroanal.Chem. 1993, 357, 201‒224.
(30)Min, M. K.; Cho, J.; Cho, K.; Kim, H. Electrochem. Acta 2000, 45, 4211‒4217. (31)Neergat, M.; Shukla, A. K.; Gandhi, K. S. J. Appl. Electrochem. 2001, 31, 373‒378.
(32)Stamenkovic, V.; Schmidt, T. J.; Ross, P. N.; Markovic, N. M. J. Phys. Chem. B
2002, 106, 11970‒11979.
(33)Rao, C. V.; Reddy, A. L. M.; Ishikawa, Y.; Ajayan, P. M. CARBON 2011, 49, 931‒936.
(34)Drillet, J. F.; Ee, A.; Friedemann, J.; Kotz, R.; Schnyder, B.; Schmidt, V. M. Electrochim. Acta 2002, 47, 1983‒1988.
(35)Stamenkovic, V.; Schmidt, T. J.; Ross, P. N.; Markovic, N. M. J. Electroanal.Chem. 2003, 554, 191‒199.
(36)Yang, H.; Vogel, W.; Lamy, C.; Alonso-Vante, N. J. Phys. Chem. B 2004, 108, 11024‒11034.
(37)Tamizhmani, G.; Capuano, G. A. J. Electrochem. Soc. 1994, 141, 968‒975.
(38)Paffett, M. T.; Beery, J. G.; Gottesfeld, S. J. Electrochem. Soc. 1988, 135, 1431‒1436.
(39)Antolini, E.; Passos, R. R.; Ticianelli, E. A. Electrochim. Acta 2002, 48, 263‒270. (40)Watanabe, M.; Wakisaka, M.; Yano, H.; Uchida, H. ECS Transactions, 2008, 16, 199
(41)Ferreira, P. J.; LaO’, G. J.; Shao-Horn, Y.; Morgan, D.; Makharia, R.; Kocha, S.; Gasteiger, H. A. J. Electrochem. Soc. 2005, 152, A2256.
(42)Darling, R.; Meyers, J. J. Electrochem. Soc. 2003, 150, A1523.
(43)Xie, J.; Wood, D. L.; Wayne, D. M.; Zawodinski, T. A.; Atannassov, P.; Borup, R. L. J. Electrochem. Soc. 2005, 152, A104.
(44)Xie, J.; Wood, D. L.; More, K. L.; Atannassov, P.; Borup, R. L. J. Electrochem. Soc. 2005, 152, A1011.
(45)Stevens, D. A.; Hicks, M. T.; Haugen, G. M.; Dahn, J. R. J. Electrochem. Soc.
2005, 152, A2309.
-9-
(47)Yoda, T.; Uchida, H.; Watanabe, M. Electrochim. Acta 2007, 52, 5997. (48)Ryu, Y. G.; Pyun, Su-ll.; Kim, C. S.; Shin, D.-R. Carbon 1998, 36, 293.
(49)Maass, S.; Finsterwalder, F.; Frank, G.; Hartmann, R.; Merten, C. J. Power Sources 2008, 176, 444.
(50)Wilson, M. S.; Garzon, F. H.; Sickafus, K. E.; Gottesfeld, S. J. Electrochem. Soc.
1993, 140, 2872.
(51)Willsaw, J.; Heitbaum, J. J. Electroanal. Chem. 1984, 161, 93. (52)Yu, X.; Ye, S. J. Power Sources 2007, 172, 145.
(53)Tang, H.; Qi, G.; Ramani, M.; Elter, J. F. J. Power Sources 2006, 158, 1306. (54)Meyers, J. P.; Darling, R. M. J. Electrochem. Soc. 2006, 153, A1432.
(55)Reiser, C. A.; Bregoli, L.; Patterson, T. W.; Yi, J. S.; Yang, D.; Perry, M. L.; Jarvi, T. D. Electrochem. Solid-State Lett. 2005, 8, A273.
(56)Kinoshita, K. Carbon: Electrochemical and Physicochemical Properties, Wiley, New York, 1998, p.319.
-10-
Chapter 2
Analysis of the CO oxidation reaction
at Pt alloy electrodes
2-1. Introduction
Recently, Watanabe et al. found new CO-tolerant catalysts by alloying Pt with a second, non-precious metal (Pt-Fe, Pt-Co, Pt-Ni, etc.).1-8 While the Ru component in conventional CO-tolerant Pt-Ru alloys is not dissolved in acidic media, a spontaneous formation of a Pt-skin layer has been found on Pt-Fe, Pt-Co, and Pt-Ni alloy electrodes by a dissolution of the second, non-precious metal component, followed by a reconstruction of the surface, which was analyzed by multiple analyses, such as X-ray photoelectron spectroscopy combined with an electrochemical cell (EC-XPS),4,6 electrochemical scanning tunneling microscopy (EC-STM)7, Electrochemical quartz crystal microbalance (EQCM),8 and in-situ attenuated total reflection Fourier transform infrared spectroscopy (ATR-FTIR).5 The CO-tolerant HOR activity at Pt-Fe, Pt-Co, and Pt-Ni alloy electrodes was ascribed to a weakened CO adsorption on the surface, maintaining active pair-sites for the HOR. Furthermore, using a channel flow electrode cell, it was also found for both bulk and supported catalysts that the CO adsorption rate at PtRu or PtCo alloys in the practical temperature range for PEFCs from 30 to 90 oC was much slower than those at pure Pt.9
On the other hand, in direct methanol fuel cells (DMFCs), CO is formed by the dehydrogenation step in the methanol oxidation reaction at Pt-based electrodes. A practical current cannot be obtained until CO molecules adsorbed on Pt sites are oxidized by water molecules co-adsorbed with CO.10 Thus, the analysis of the mechanism of CO adsorption and oxidation is very important for both fundamental surface science and the development of novel anode catalysts for PEFCs or DMFCs.
In this chapter, the mechanism of the COad oxidation reaction has been
analyzed at pure Pt, pure Ru, Pt–Ru alloy, and Pt skin layers formed on Pt–Co and Pt–Fe alloy electrodes in 0.1 M HClO4 electrolyte solution. The adsorption and
oxidation of CO and small organic molecules have been examined with the EQCM technique.11-16 However, these results are not always quantitative. One of the reasons is that the oxidation reactions of COad certainly consist of multiple reaction steps, which
-11-
makes the EQCM analysis complicated. In addition, many species such as CO (linear, bridged, or other variants), CHO, COOH, water, OH, or electrolyte anions may be included in these steps. Here, I focus on the elementary reaction step at the onset of COad oxidation. By using double-potential-step chronoamperometry (DPS-CA)
combined with EQCM, I have succeeded in clarifying the elementary steps of the COad
oxidation reaction on the various electrodes mentioned above. The differences in their reaction steps will be discussed.
-12-
2-2. Experimental
Planar AT-cut quartz crystals (Elchema, QC-10-Au, 1.4 cm in diameter) with a fundamental frequency of 10 MHz were used. The resolution and stability of the 10 MHz-EQCM operated with EQCN-900 (Elchema) was ±0.1 Hz, i.e., ±0.443 ng cm−2 without any signal averaging.
Thin film electrodes of Pt alloys (Pt–Fe, Pt–Co, and Pt–Ru) were prepared on one face of the quartz crystal by Ar–sputtering Pt together with Fe, Co and Ru targets at room temperature. For comparison purposes, thin film electrodes of pure Pt and Ru were also prepared in the same manner. The compositions of the alloys were determined by X-ray fluorescence analysis (XRF): Pt64Fe36, Pt53Co47, and Pt40Ru60.
The crystallographic structures of the resulting films were examined by grazing incidence (θ = 1 o) X-ray diffraction (GIRD). The GIRD pattern of each alloy indicated the formation of a solid solution with a face-centered cubic (fcc) crystal structure, similar to the cases of our previous works.17-19 The thicknesses of the resulting films were evaluated to be from 40 to 100 nm based on the mass, the composition, and the lattice constant determined from the GIRD pattern.
Each resulting 10 MHz-EQCM electrode was mounted into the bottom of a three-compartment cell.8 The projected surface area of the working electrode on 10 MHz-EQCM was 0.24 cm2. A platinized platinum gauze was used as a counter electrode. The working and counter electrode compartments were separated by an ion-exchange membrane (NafionⓇ117). RHE was used as a reference electrode. All the electrode potentials will be referenced to the RHE in this paper. The 0.1 M HClO4
electrolyte solution was prepared from a reagent grade HClO4 (Kanto Chemical Co.,
Japan) and Millipore-Q water, and was purified with conventional pre-electrolysis methods.20,21 The EQCM system has been calibrated by a galvanostatic electrodeposition of silver with −100 µA for several time intervals up to 40 s on a smooth Au working electrode in He-purged 0.1 M HClO4 containing 40 mM AgClO4,
based on our EQCM studies.22,23 The mass sensitivity thus calibrated was 4.43 ng cm−2 Hz−1, which agrees well with the calculated one based on Sauerbrey’s equation.24 All experiments were carried out at constant temperature of 25 oC.
For the Pt–Fe and Pt–Co alloys-EQCM, an electrochemical stabilization of the electrode was first performed in the same manner as described in our previous paper.8 The electrode potential was repeatedly swept from 0.05 V to 1.00 V at a sweep rate of 20 mV s−1. The EQCM responses [∆m and CV] during repetitive sweeps were recorded simultaneously until the CV reached approximately a steady state, together
-13- with the ∆m being negligibly small.
The electrooxidation of COad was examined as follows. After bubbling high
purity He in the 0.1 M HClO4 electrolyte solution for 1 h, the electrode was cleaned by
10 potential sweep cycles between 0.05 V and 1.00 V at a sweep rate of 1.00 V s−1 for the pure Pt, Pt–Fe and Pt–Co, or one cycle between 0.05 V and 0.80 V at 0.10 V s−1 for the pure Ru and Pt–Ru (to minimize the formation of ruthenium oxide and the dissolution). Next, CO was adsorbed on the electrode by bubbling 1% CO (He balance) for 1 h while maintaining the potential at 50 mV. After removing CO gas dissolved in the solution by bubbling high purity He gas for 30 min again, the CV and DPS-CA were performed at the CO-adsorbed electrodes during recording of the simultaneous mass changes. The EQCM data with the identical electrode were measured two or three times and also with different electrodes in a similar manner. Good reproducibility has been confirmed for the EQCM data shown below.
The electrochemically active surface area (ECSA) of Pt and Pt skin layers formed on Pt–Co and Pt–Fe electrodes was determined with conventional CV methods, assuming the hydrogen desorption charge ∆Q°H = 0.21 mC cm−2 observed in the
positive-going potential scan from 0.05 V to ca. 0.40 V for smooth polycrystalline Pt.20,25,26 The roughness factor Rf was defined as Rf = ECSA/geometric area.
-14-
2-3. Results and discussion
2-3-1. Mass changes at pure Pt with and without COad during the potential sweep
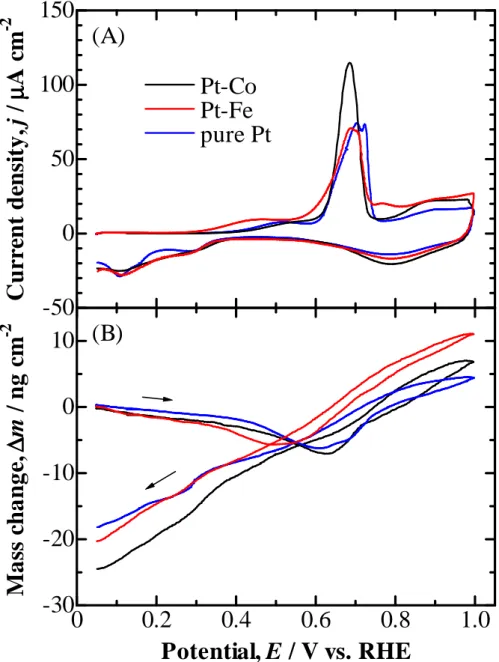
Figure 2-1 shows the CVs (A) and the concomitant mass changes ∆m (B) at a pure Pt-EQCM electrode with and without COad in the 0.1 M HClO4 solution. For the
positive-going potential scan at pure Pt without COad, the CV and the ∆m showed
typical features of polycrystalline Pt.16,27-29 Hereinafter, the values of the current density j (the integrated electric charge density ∆Q) and ∆m will be shown as those divided by the ECSA to compare the behaviors among various electrodes with different roughness factors. The Rf of the pure Pt electrode surface was evaluated to be 12.4.
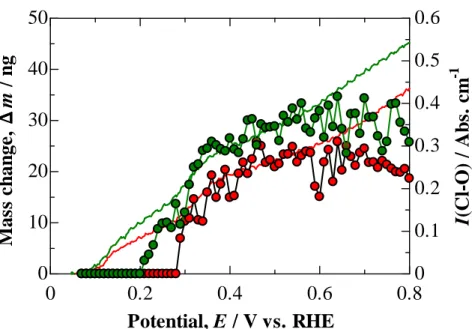
In spite of the desorption of hydrogen atoms from the Pt surface, the mass increased gradually up to 0.3 V, which can be ascribed to the adsorption of water molecules. A subsequent mass increase from 0.3 V to 0.7 V is ascribed with certainty to the specific adsorption of ClO4− anions, which has been demonstrated by in situ
Fourier-transform infrared spectroscopy (FTIR).30-33 In the more positive potential region (E = 0.7–1.0 V), the mass increased significantly due to oxide (or hydroxide) formation.34-36
When 1% CO was bubbled in the solution, the coverage of COad on the
Pt-EQCM electrode became high within a short time. The COad coverage (θCO) was
defined as the Pt site occupation by the following equation, regardless of the type of COad, e.g., linear (on-top), bridged, or other variants,20,25
θCO = 1 − (∆QH /∆Q°H) (1)
where ∆QH and ∆Q°H are the hydrogen-desorption charges with and without COad,
respectively.
The value of θCO at a pure Pt-EQCM, shown in Fig. 2-1, was approximately
unity (full coverage). A pre-oxidation peak (P1) was seen at 0.5 V before a major COad
oxidation peak (P2) at 0.7 V in the positive-going potential scan. Such a pre-peak has
often been observed at CO-adsorbed Pt polycrystalline electrodes.37-39 The steep decrease at P1 in the mass is ascribed to the oxidative removal of weakly adsorbed CO
or CO-related species. In contrast, the mass increased at P2, in spite of the current for
the oxidative desorption of COad being much larger than that for the pre-peak. This
indicates that the COad oxidation at P2 was accompanied by the adsorption of another
species, and a hydrated ClO4− anion as the dominant adsorbing species has been
-15-
contributed to the mass increase in the potential region more positive than 0.7 V. The adsorption of hydrated ClO4− anions is also supported by the monotonic mass decrease
in the electric double layer region during the negative-going potential scan, as shown in Fig. 2-1B. Such CV and mass responses are similar to those reported previously.10 However, in the present research, I have found for the first time the very interesting EQCM response of the mass decreasing with increasing potential in the less positive potential region from 0.05 V to 0.25 V, where oxidation current was hardly observed. When the potential scan was reversed at 0.25 V toward 0.05 V, the mass increased reversibly and returned to the original value at 0.05 V. Because θCO was unity and only
a small capacitive current was observed, we conclude that such ∆m is not due to any Faradaic process. The EQCM responses for various electrodes with COad have been
-16-
-50
0
50
100
C
u
rr
en
t
d
en
si
ty
, j
/
µµµµ
A
c
m
-20
0.2
0.4
0.6
0.8
1.0
-30
-20
-10
0
10
20
M
a
ss
c
h
a
n
g
e,
∆∆∆∆
m
/
n
g
c
m
-2Potential, E / V vs. RHE
with CO
adwithout CO
adP
1(A)
(B)
P
2Figure 2-1 (A) CVs and (B) simultaneous mass changes (per ECSA) at pure Pt electrodes with and without COad in 0.1 M HClO4. Sweep rate: 20 mV s-1.
-17-
2-3-2. Mass changes at Pt–Fe, Pt–Co, Pt–Ru alloys and pure Ru with COad during
potential sweep
Figure 2-2 shows the CVs (A) and the concomitant mass changes (B) at Pt–Co and Pt–Fe electrodes with COad in 0.1 M HClO4 solution. The response at the
pure Pt-EQCM shown in Fig. 2-1 is also shown as a blue line for comparison purposes. The values of ECSA and Rf were calculated from ∆Q°H at Pt skin layers formed on
Pt–Co and Pt–Fe alloys in the same manner as that for the pure Pt; the values of Rf of
the Pt–Co and Pt–Fe electrodes were evaluated to be 6.4 and 4.6, respectively. The values of θCO were nearly unity at these two electrodes. Both of the COad oxidation
peaks, P1 and P2, were observed at the Pt–Co and Pt–Fe alloy electrodes, similar to the
case of the pure Pt electrode. Thus, a pre-peak followed by a main oxidation peak is a characteristic of COad oxidation reaction at both pure Pt and the Pt skin formed on Pt
alloys. However, it should be noted that the onset potentials for both P1 and P2 at the
Pt–Fe alloy electrode were less positive than those at the other two electrodes. This may be ascribed to a weakening of CO adsorption at the Pt skin on the Pt–Fe alloy surface, due to a relatively large effect of the modified electronic structure.5,35,40
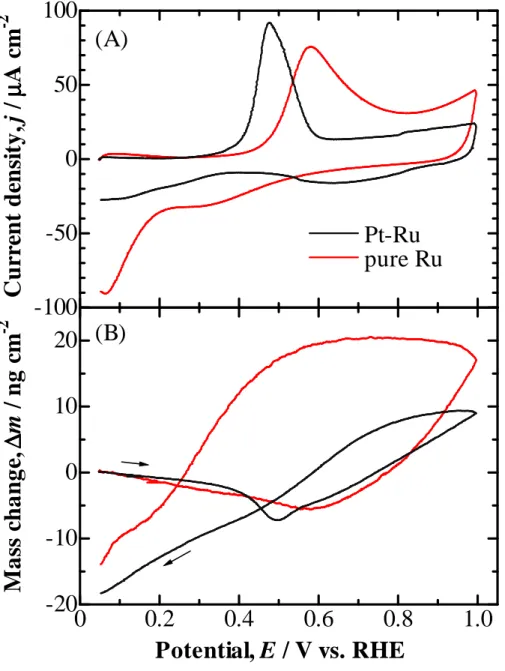
Figure 2-3 shows CVs (A) and concomitant mass changes (B) at pure Ru and Pt–Ru electrodes in 0.1 M HClO4 solution. For these two electrodes, j and ∆m
were normalized to the ECSA calculated from the CO-oxidation charge ∆QCO at each
electrode, since the correlation between the ECSA and ∆Q°H has not yet been well
clarified unlike the case for pure Pt. Since the value of θCO calculated from Eq. (1) was
nearly unity at the Pt–Ru electrode, the Rf value was evaluated to be 15.3 from ∆QCO,
assuming that all CO was linearly adsorbed on the surface. The Rf value for the pure
Ru electrode was also calculated to be 11.5, assuming full coverage with linear COad
on a close-packed Ru surface. For the positive-going potential scan at these electrodes, only one oxidation peak was observed in the CVs, with the onset potentials less positive than those for pure Pt, Pt skin/Pt–Co, or Pt skin/Pt–Fe, shown in Fig. 2-2. At the pure Ru electrode, the oxidation of COad commenced at ca. 0.4 V. The mass
decreased gradually up to 0.6 V (oxidation peak potential), followed by an increase, similar to the case of pure Pt. Beyond 0.8 V, this electrode showed a steep increase in the j and ∆m values, probably due to Ru oxide formation, which was reduced in the negative-going potential scan at a very low potential compared to that for pure Pt. At the Pt–Ru alloy electrode, such a formation of an inert oxide did not occur, similar to the case of the other electrodes. The Pt–Ru alloy electrode exhibited the lowest onset potential of ca. 0.3 V for COad oxidation, i.e., the highest activity for COad oxidation
-18-
among the electrodes examined, which is consistent with many results reported so far.18,19,41-44
It should be noted that the reversible mass change between 0.05 V and 0.25 V at pure Pt as described above [Fig. 2-1B] was also observed at all electrodes examined (Pt skin/Pt–Co, Pt skin/Pt–Fe, pure Ru, and Pt–Ru). By in situ FTIR study at CO-adsorbed Pt/C, PtCo/C, and PtRu/C electrodes in 0.1 M HClO4 in our laboratory, it
has been indicated that hydrogen-bonded H2O molecules of the second layer of the
well-known bilayer water45-47 are reversibly desorbed and adsorbed in the positive-going and negative- going potential scan, respectively, between 0.05 V and 0.30 V. Hence, the reversible mass change based on the non-Faradaic process, as mentioned above, is ascribed to the potential-dependent change in the amount of H2O
molecules co-adsorbed with COad. Corresponding in situ FTIR results will be
-19-
-50
0
50
100
150
C
u
rr
en
t
d
en
si
ty
, j
/
µµµµ
A
c
m
-20
0.2
0.4
0.6
0.8
1.0
-30
-20
-10
0
10
M
a
ss
c
h
a
n
g
e,
∆∆∆∆
m
/
n
g
c
m
-2Potential, E / V vs. RHE
Pt-Co
Pt-Fe
pure Pt
(A)
(B)
Figure 2-2 (A) CVs and (B) simultaneous mass changes (per ECSA) at pure Pt, Pt-Co, and Pt-Fe electrodes with COad in 0.1 M HClO4. Sweep rate: 20 mV s-1.
-20-
-100
-50
0
50
100
C
u
rr
en
t
d
en
si
ty
, j
/
µµµµ
A
c
m
-2(A)
(B)
0
0.2
0.4
0.6
0.8
1.0
-20
-10
0
10
20
M
a
ss
c
h
a
n
g
e,
∆∆∆∆
m
/
n
g
c
m
-2Potential, E / V vs. RHE
Pt-Ru
pure Ru
Figure 2-3 (A) CVs and (B) simultaneous mass changes (per ECSA) at pure Ru and Pt-Ru electrodes with COad in 0.1 M HClO4. Sweep rate: 20 mV s-1.
-21-
2-3-3. DPS-CA combined with EQCM measurements at pure Pt, Pt–Fe and Pt–Co alloys with COad
In order to analyze the elementary steps for the COad oxidation reaction at
all of the electrodes examined, the DPS-CA (current response) combined with the EQCM (∆m) has been employed. For the analysis of the reaction at P1 on pure Pt,
Pt–Co, and Pt–Fe, the potential of each electrode with COad was stepped from 0.05 V
to a potential EI just before the onset of P1, and held for 0.3 s. By the first potential step
(EI = 0.25–0.35 V), I can exclude the contribution of the capacitive charging current to
the oxidation charge for the adsorbed species and the contribution of the H2O mass
change to the corresponding mass change in the P1 potential region. Then, the second
potential step was performed from EI to an EII within P1. For the analysis of the
reaction at P2, the EI and EII values were chosen to be in the potential region just after
P1 and within P2, respectively. As seen in Figs. 2-1–3, anodic current was hardly
observed in the potential region less positive than the onset potential of COad oxidation
at all electrodes examined during the positive-going potential scan. This is due to a significant reduction of the capacitance in the potential region on Pt or Pt skin, probably because the adsorption of H2O and ClO4− anions is blocked by COad with θCO
of nearly unity. Thus, at potentials less positive than the onset of COad oxidation, the
effect of capacitive charging on the total electric charge is negligibly small.
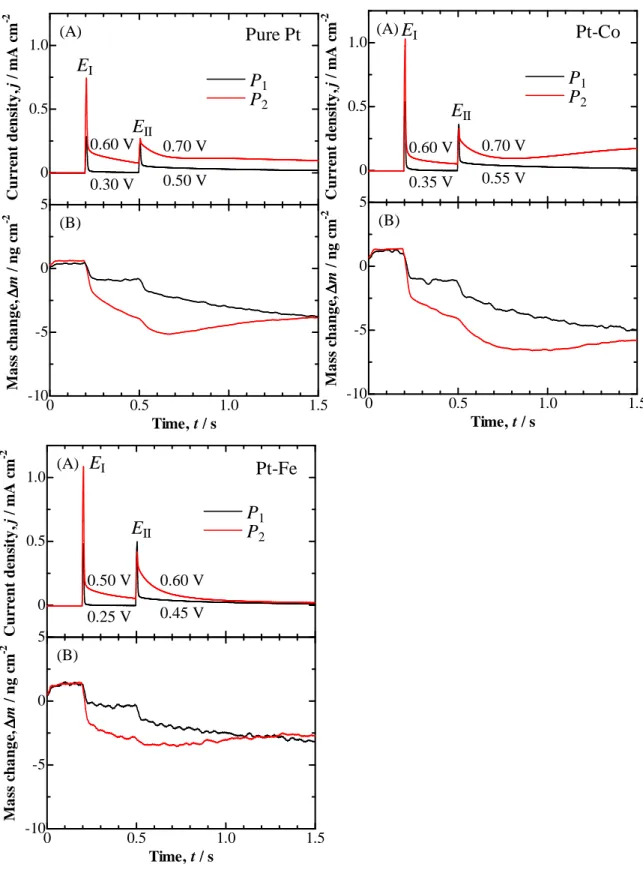
Figure 2-4 shows the current responses and the concomitant mass changes by the DPS-CA at the pure Pt, Pt–Co, and Pt–Fe electrodes with θCO = 1 in 0.1 M
HClO4 solution. For the measurement of transient responses of j and ∆m, the noise
level of EQCM increased up to ±0.3 Hz due to an additional noise from a rapid-mode AD converter in the computer. At the first potential step from 0.05 V to EI of 0.30 V for
pure Pt, 0.35 V for Pt–Co, and 0.25 V for Pt–Fe, a current spike was observed, followed by a sharp decrease to a negligibly small value. Corresponding to the transient current, the mass decreased quickly to a constant value. If the COad or related
molecules were oxidized at EI, the ∆m should decrease gradually. These responses
support our proposal of a decrease in the amount of adsorbed H2O, without any
oxidation of COad in this step. After 0.3 s, the potential was stepped to 0.50, 0.55 and
0.45 V at the pure Pt, Pt–Co, and Pt–Fe electrodes, respectively. The ∆m first decreased abruptly responding to the current spike, followed by a continuous decrease with time.
For the analysis of the elementary step in P1, the values of ∆m were plotted
as a function of the electric charge density ∆Q (per ECSA) in Fig. 2-5. From the slope of each curve, the equivalent mass (M/n) of adsorbed/desorbed species can be
-22- evaluated by the following equation.
M/n = F(∆m / ∆Q) (2)
where M, n, and F are the molar mass of the species (g mol−1), the number of electrons transferred, and the Faraday constant (C mol−1), respectively. For all of the electrodes, pure Pt, Pt–Co, and Pt–Fe, the relationship is approximately separated into two parts. A steep slope was seen at the initial ∆Q < 4 µC cm−2, providing an M/n value close to −45. This can probably be attributed to the oxidation of a carboxyl species (COOHad),
which was observed by our in situ FTIR.39
Pt−COOHad → Pt + CO2 + H+ + e− M/n = −45 (3)
The COOHad may be formed as shown in Eq. (4),32
Pt−(OH2)ad + Pt−COad → Pt−COOHad + Pt−H (4)
where Pt in Eqs. (3) and (4) denotes the surface sites at both pure Pt and the Pt skin layer on the alloys, and Pt–(OH2)ad in Eq. (4) denotes the adsorbed water. In previous
work in our laboratory,8 by using a normal potential sweep, Uchida et al. concluded that the identical reaction [Eq. (3)] occurs at the pure Pt-EQCM in the P1 region, as in
the present work, but they did not find such a step at the Pt–Fe-EQCM due to the insufficient amount of adsorbate coverage. Assuming that all of the adsorbates other than COOHad on the surface sites were linear CO, the surface fraction of COOHad
oxidized in the first step was estimated to be as small as 2% based on ∆Q at each electrode. Thus, the contribution of the capacitive charging at such vacant sites to the
∆Q, if any, was very small. Hence, we have confirmed an identical elementary reaction
for the COad oxidation at pure Pt, Pt–Co and Pt–Fe electrodes by DPS-CA combined
with EQCM in the present work.
In the latter part of the plots in Fig. 2-5, a nearly identical slope was seen for all of the electrodes. The M/n value close to −10 suggests the oxidation of COad
with H2O.
-23-
This is consistent with our previous result at the Pt–Fe-EQCM by the use of a normal potential sweep.8
Here, based on these results, the total COad oxidation reaction at P1 on pure
Pt and the Pt skin formed on the alloys has been proposed as follows. The initial step is the oxidation of COOHad, as shown in Eq. (3), where neither adsorbed H2O nor bulk
H2O from the electrolyte solution is necessary for the oxidation process. A few percent
of surface sites become available as vacant sites after this step. Then, H2O molecules
can be supplied from the solution to the neighbor sites of COad, participating in the
oxidation of COad, as in Eq. (5). The somewhat smaller value of M/n (−10) observed at
each electrode compared to that predicted by Eq. (5) (M/n = −14) may be due to a very small amount of H2O and/or hydrated ClO4− anions supplied from the solution11 to the
vacant sites formed by the removal of COad.
Next, the COad oxidation reaction at P2 in a similar manner to that described
for the case of P1 has been analyzed. The potentials were stepped from 0.05 V to EI =
0.60, 0.60, and 0.50 V, followed by the second step at EII = 0.70, 0.70, and 0.60 V at
the pure Pt, Pt–Co, and Pt–Fe electrodes, respectively. The responses of the current and
∆m are shown by dashed lines in Fig. 2-4. The relationships between ∆m and ∆Q at EII
in the P2 region are plotted in Fig. 2-6. The ∆m first decreased and then began to
increase. For the initial decrease in the ∆m, the values of M/n were calculated to be −8, −7, and −5 at the pure Pt, Pt–Co, and Pt–Fe electrodes, respectively. These values are smaller than that for COad oxidation (M/n = −14 for Eq. (5)), but close to those
obtained at the latter part of the plots in Fig. 2-5 for P1. Hence, the major initial
reaction in P2 proceeds via Eq. (5), i.e., the oxidation of COad by H2O supplied from
the solution, accompanied by the adsorption of H2O and/or hydrated ClO4− anions at
the vacant sites.
The increase in the ∆m (positive slopes) during the oxidative removal of COad in the latter part of the plots in Fig. 2-6 is essentially similar to that observed in
the potential sweep experiments.8 This is ascribed to the fact that the mass increase by the adsorption of hydrated ClO4− anions is larger than the mass loss by the removal of
COad. Hence, the oxidation of COad at P2 on this group of electrodes consists of the
elementary steps of the oxidative removal of COad with H2O supplied to neighboring
sites and the adsorption of hydrated ClO4− anions at the vacant sites formed during the
-24- 0 0.5 1.0 C u rr en t d en si ty , j / m A c m -2 P1 P2 Pt-Co EI EII 0.60 V 0.35 V 0.70 V 0.55 V 0 0.5 1.0 1.5 -10 -5 0 5 M a ss c h a n g e, ∆∆∆∆ m / n g c m -2 Time, t / s (A) (B) 0 0.5 1.0 C u rr en t d en si ty , j / m A c m -2 P1 P2 Pt-Fe EI EII 0.50 V 0.25 V 0.60 V 0.45 V 0 0.5 1.0 1.5 -10 -5 0 5 M a ss c h a n g e,∆∆∆∆ m / n g c m -2 Time, t / s (A) (B) 0 0.5 1.0 C u rr en t d en si ty , j / m A c m -2 P1 P2 (A) (B) EI EII Pure Pt 0.60 V 0.30 V 0.70 V 0.50 V 0 0.5 1.0 1.5 -10 -5 0 5 M a ss c h a n g e, ∆∆∆∆ m / n g c m -2 Time, t / s
Figure 2-4 Time courses of (A) current density and (B) simultaneous mass changes in DPS-CA for P1 and P2 at pure Pt, Pt-Co, and Pt-Fe electrodes with COad in 0.1 M
-25-
-4
-2
0
Electric charge density,
∆∆∆∆
Q /
µµµµ
C cm
-2M
a
ss
c
h
a
n
g
e,
∆∆∆∆
m
/
n
g
c
m
-2pure Pt
Pt-Co
Pt-Fe
M/n = -45
M/n = -10
-4
-2
0
0
10
20
-4
-2
0
Figure 2-5 Relationship between the mass change and electric charge density after potential steps to EII for P1 at pure Pt, Pt-Co, and Pt-Fe electrodes with COad.
-26-
Figure 2-6 Relationship between the mass change and electric charge density after potential steps to EII for P2 at pure Pt, Pt-Co, and Pt-Fe electrodes with COad.
0
20
40
60
80
100
-2
0
2
Electric charge density,
∆∆∆∆
Q /
µµµµ
C cm
-2M
a
ss
c
h
a
n
g
e,
∆∆∆∆
m
/
n
g
c
m
-2Pt-Fe
pure Pt
Pt-Co
M/n = -5
M/n = -7
M/n = -8
-2
0
2
-2
0
2
-27-
2-3-4. DPS-CA combined with EQCM at pure Ru and Pt–Ru alloy with COad
In order to analyze the COad oxidation reaction at the pure Ru and Pt–Ru
electrodes, the DPS-CA combined with EQCM experiments were also carried out in a similar manner, as described above. First, the potential was stepped from 0.05 V to EI
= 0.30 V (less positive than the onset potential for the COad oxidation) and held for 0.3
s. Then, the second potential step was performed to EII = 0.65 or 0.60 V. Fig. 2-7 shows
the current responses (A) and the concomitant mass changes (B) at these electrodes with COad in 0.1 M HClO4 solution. The mass decrease due to the decrease in the
amount of adsorbed H2O by the first potential step to EI was very similar to those for
Pt and the Pt skin/alloys, i.e., responding to the current spike, the mass decreased quickly to a nearly constant value. In contrast, for the second potential step to EII in the
main oxidation peak, pure Ru and Pt–Ru exhibited characteristic behaviors, which were different from those observed for pure Pt and the Pt skin/alloys. First, a very large current spike was observed just after the potential step at both pure Ru and Pt–Ru alloy electrodes. We do not discuss the ∆m and ∆Q in such a spike region for the following reasons. A small hydrogen desorption wave in Fig. 2-3 suggests that the θCO at Ru and
Pt–Ru was less than unity. This is because the adsorption of CO is suppressed, especially at Pt–Ru electrodes.48 As is known well, the current densities at pure Ru and Pt–Ru alloy electrodes without COad are relatively large in the potential region from
0.3 to 0.5 V, compared with those at pure Pt and Pt skin/alloy electrodes. This is certainly ascribed to the formation of Ru–OH on the surface, which also exhibits a capacitive property. Hence, a fraction of the current spike may be ascribed to the formation of Ru–OH. Therefore, it is not meaningful to discuss the ∆m and ∆Q values in the initial spike region of ∆Q < ca. 2 µC cm−2.
Second, the decrease in the current at pure Ru was very small after the spike, and ∆m reached a nearly constant value within ca. 0.2 s after the potential step to 0.65 V. The current at Pt–Ru initially increased after the spike and decreased gradually. Corresponding to the current transient, ∆m showed a minimum at the Pt–Ru electrode.
Figure 2-8 shows the relationships between ∆m and ∆Q at EII for these
electrodes. The first linear portion observed at 2 µC cm−2 < ∆Q < 20 µC cm−2 for pure Ru and at 2 µC cm−2 < ∆Q < 10 µC cm−2 for Pt–Ru provided an M/n value of around −23, which is close to that expected for the oxidation of COad by pre-adsorbed H2Oad.
At the pure Ru electrode, the overall reaction can be written as
-28- At the Pt–Ru alloy electrode,
Pt−COad + Ru−(OH2)ad → Pt + Ru + CO2 + 2H+ + 2e− M/n = −23 (7)
The COad oxidation reaction via Eq. (7) at the Pt–Ru alloy electrode is the
so-called ‘‘bifunctional mechanism’’ proposed by Watanabe and Motoo.49 The H2Oad
molecules, which promote the oxidation of COad, have been clearly observed by in situ
FTIR spectroscopy at the Pt–Ru alloy and pure Ru electrodes.18,19 It must be noted that the oxidation of COad cannot occur at a potential less positive than 0.3 V, even though
such H2Oad are already adsorbed together with COad at the Pt–Ru or Ru surface. This
indicates that the H2Oad molecules cannot directly oxidize the COad molecules. As
indicated by the decrease in ν(OH) and δ(HOH) bands,19 however, the H2Oad on Ru
sites disappear, presumably due to their discharge at about 0.3–0.4 V, and form an active species, e.g., Ru–OH, as previously proposed in the literature.44,49
Ru−(OH2)ad → Ru−OH + H+ + e− (8)
Once the Ru–OH is formed, the COad is easily oxidized to CO2, as in Eqs.
(6), (7). Hence, the value of M/n observed in the initial region strongly supports this mechanism. Such an elementary step of the COad oxidation reaction at pure Ru and
Pt–Ru with H2Oad is quite distinct from that described for pure Pt and the Pt skin/alloys
without any Ru atoms on the top surface.
The surface fraction of COad oxidized in the first step (initial linear portion
with M/n of around −23) was as small as a few percent of the total ∆QCO in the main
oxidation peak at the two electrodes. In the latter portion of the plots in Fig. 2-8, the slope (M/n) decreased gradually, and reached zero when ∆Q reached around 200 µC cm−2 at each electrode, i.e., around 40% and 50% of the total ∆QCO at the pure Ru and
Pt–Ru electrodes, respectively, and thereafter became positive (data not shown in Fig. 2-8). Such behavior can be explained in a manner similar to that described for Fig. 2-6 (P2 at pure Pt or Pt skin-type alloys). When the vacant sites are formed by the
oxidation of COad, H2O and/or hydrated ClO4− can adsorb. The increase in the current
at the Pt–Ru alloy up to 0.2 s after the potential step to EII in Fig. 2-7 suggests that the
rate of COad oxidation was promoted further by the formation of vacant sites, resulting
-29-
The positive slope (M/n) observed in the last stage of COad oxidation reaction is mainly
due to hydrated ClO4− anions.
Figure 2-7 Time courses of (A) current density and (B) simultaneous mass changes in DPS-CA for the COad oxidation peak at pure Ru and Pt-Ru electrodes with COad in
0.1 M HClO4.
0
0.5
1.0
C
u
rr
en
t
d
en
si
ty
, j
/
m
A
c
m
-20.65 V
0.60 V
0
0.5
1.0
1.5
-10
-5
0
5
M
a
ss
c
h
a
n
g
e,
∆∆∆∆
m
/
n
g
c
m
-2Time, t / s
Pt-Ru
pure Ru
(A)
(B)
E
IE
II0.30 V
0.30 V
-30-
Figure 2-8 Relationship between the mass change and electric charge density after potential steps to EII at pure Ru and Pt-Ru electrodes with COad.
-4
-2
0
Electric charge density,
∆∆∆∆
Q /
µµµµ
C cm
-2M
a
ss
c
h
a
n
g
e,
∆∆∆∆
m
/
n
g
c
m
-2M/n = -23
pure Ru
Pt-Ru
0
20
40
60
80
100
-4
-2
0
-31-
2-4. Conclusion
By the DPS-CA technique combined with EQCM, the elementary steps of the COad oxidation reaction were examined at pure Pt, Ru, and Pt alloy electrodes. At
pure Pt and the Pt skin-type alloys (such as Pt–Fe and Pt–Co), both a pre-peak (P1) and
a main peak (P2) of COad oxidation were observed in the positive-going scan of the
CVs. In contrast, pure Ru and a Pt–Ru alloy showed only one distinctive peak of COad
oxidation in the CVs at a potential less positive than that for the pure Pt or Pt skin-type alloys. It was indicated that the elementary steps of COad oxidation reaction at the pure
Pt and Pt skin-type alloys were identical, i.e., a small amount of COOHad is initially
oxidized at P1, followed by the oxidation of weakly adsorbed CO. At the major peak P2,
water molecules and/or hydrated ClO4− anions are adsorbed at vacant sites formed by
the oxidation of strongly adsorbed CO. At pure Ru and the Pt–Ru alloy, it was clarified that the oxidation of COad was triggered by Ru–OH formed by the discharge of H2O
adsorbed on Ru sites. For the Pt–Ru alloy, the so-called bifunctional mechanism is clearly supported by the present results. The oxidation of a few percent of COad
occurred in the first step, leading to the major COad oxidation reaction, together with
the adsorption of water molecules and/or hydrated ClO4− anions at the vacant sites. The
present results indicate the importance of the initial reaction step for the COad
-32-
2-5. References
(1)Fujino, T.; Thesis, M. Eng., Yamanashi University, 1996.
(2)Watanabe, M.; Igarashi, H.; Fujino, T. Electrochemistry, 1999, 67, 1194. (3)Watanabe, M.; Zhu, Y.; Uchida, H. J. Phys. Chem. B, 2000, 104, 1762.
(4)Watanabe, M.; Zhu, Y.; Igarashi, H.; Uchida, H. Electrochemistry, 2000, 68, 244. (5)Igarashi, H.; Fujino, T.; Zhu, Y.; Uchida, H.; Watanabe, M. Phys. Chem. Chem. Phys., 2001, 3, 306.
(6)Wakisaka, M.; Mitsui, S.; Hirose, Y.; Kawashima, K.; Uchida, H.; Watanabe, M. J. Phys. Chem. B, 2006, 110, 23489.
(7)Wan, L. J.; Moriyama, T.; Ito, M.; Uchida, H.; Watanabe, M. Chem. Commun.,
2002, 58.
(8)Uchida, H.; Ozuka, H.; Watanabe, M. Electrochim. Acta, 2002, 47, 3629.
(9)Uchida, H.; Izumi, K.; Aoki, K.; Watanabe, M. Phys. Chem. Chem. Phys., 2009, 11, 1771.
(10)Kunimatsu, K.; Hanawa, H.; Uchida, H.; Watanabe, M. J. Electroanal. Chem.
2009, 632, 109-119.
(11)Wilde, C.P.; Zhang, M. J. Chem. Soc. Faraday Trans. 1993, 89, 385–389. (12)Wilde, C.P.; Zhang, M. J. Chem. Soc. Faraday Trans. 1994, 90, 1233–1240 (13)Wilde, C.P.; Zhang, M. Electrochim. Acta 1993, 38, 2725–2732.
(14)Wilde, C.P.; Zhang, M. Electrochim. Acta 1994, 39, 347–354.
(15)Hachkar, M.; Napporn, T.; Léger, J.M.; Beden, B.; Lamy, C. Electrochim. Acta
1996, 41, 2721–2730.
(16)Frelink, T.; Visscher, W. van Veen, J.A.R. Langmuir 1996, 12, 3702–3708.
(17)Toda, T.; Igarashi, H.; Uchida, H.; Watanabe, M. J. Electrochem. Soc. 1999, 146, 3750–3756.
(18)Yajima, T.; Wakabayashi, N.; Uchida, H.; Watanabe, M. Chem. Commun. 2003, 828–829.
(19)Yajima, T.; Uchida, H.; Watanabe, M. J. Phys. Chem. B 2004, 108, 2654–2659.3629–3636.
(20)Watanabe, M. Denki Kagaku (presently Electrochemistry) 1985, 53, 671–674. (21)Uchida, H.; Ikeda, N.; Watanabe, M. J. Electroanal. Chem. 1997, 424, 5–12. (22)Uchida, H.; Miura, M.; Watanabe, M. J. Electroanal. Chem. 1995, 386, 261–265. (23)Watanabe, M.; Uchida, H.; Hiei, M. in: 212th American Chemical Society National Meeting, COLL 171, Orlando, USA, 1996.
-33-
(25)Watanabe, M.; Motoo, S. J. Electroanal. Chem. 1975, 60, 259–266. (26)Watanabe, M.; Motoo, S. J. Electroanal. Chem. 1975, 60, 267–273. (27)Shimazu, K.; Kita, H. J. Electroanal. Chem. 1992, 341, 361–367.
(28)Watanabe, M.; Uchida, H.; Ikeda, N. J. Electroanal. Chem. 1995, 380, 255–260. (29)Visscher, W.; Gootzen, J.F.E.; Cox, A.P.; Van Veen, J.A.R. Electrochim. Acta 1997, 43, 533–547.
(30)Sawatari, Y.; Inukai, J.; Ito, M. J. Electron. Spectrosc. 1993, 64/65, 515–522. (31)Shingaya, Y.; Ito, M. J. Electroanal. Chem. 1994, 372, 283–288.
(32)Shiroishi, H.; Ayato, Y.; Kunimatsu, K.; Okada, T. J. Electroanal. Chem. 2005, 581, 132–138.
(33)Kunimatsu, K.; Sato, T.; Uchida, H.; Watanabe, M. Langmuir 2008, 24, 3590–3601.
(34)Jerkiewicz, G.; Vatankhah, G.; Lessard, J.; Soriaga, M.P.; Park, Y.-S. Electrochim. Acta 2004, 49, 1451–1459.
(35)Wakisaka, M.; Suzuki, H.; Mitsui, S.; Uchida, H.; Watanabe, M. J. Phys. Chem. C
2008, 112, 2750–2755.
(36)Wakisaka, M.; Suzuki, H.; Mitsui, S.; Uchida, H.; Watanabe, M. Langmuir 2009, 25, 1897–1900.
(37)Kabbabi, A.; Faure, R.; Durand, R.; Beden, B.; Hahn, F.; Léger, J.-M.; Lamy, C. J. Electroanal. Chem. 1998, 444, 41–53.
(38)Zhu, Y.; Uchida, H.; Watanabe, M. Langmuir 1999, 15, 8757–8764.
(39)Rush, B.M.; Reimer, J.A.; Cairns, E.J. J. Electrochem. Soc. 2001, 148, A137–A148.
(40)Wakisaka, M.; Uchida, H.; Watanabe, M. in: A. Wieckowski, J.K. Nørskov (Eds.), Fuel Cell Science: Theory, Fundamentals, and Biocatalysis, Wiley, New Jersey, 2010, p. 147.
(41)Gutiérrez, C.; Caram, J.A.; Beden, B. J. Electroanal. Chem. 1991, 305, 289–299. (42)Krausa, M.; Vielstich, W. J. Electroanal. Chem. 1994, 379, 307–314.
(43)Friedrich, K.A.; Geyzers, K.-P.; Linke, U.; Stimming, U.; Stumper, J. J. Electroanal. Chem. 1996, 402, 123–128.
(44)Lin, W.F.; Iwasita, T.; Vielstich, W. J. Phys. Chem. B 1999, 103, 3250–3257. (45)Thiel, P.A.; Madey, T.E. Surf. Sci. Rep. 1987, 7, 211–385.
(46)Thiel, P.A.; Depaola, R.A.; Hoffman, F.M. J. Chem. Phys. 1984, 80, 5326–5331. (47)Watanabe, M.; Sato, T.; Kunimatsu, K.; Uchida, H. Electrochim. Acta 2008, 53, 6928–6937.
-34-
(48)Uchida, H.; Izumi, K.; Watanabe, M. J. Phys. Chem. B 2006, 110, 21924–21930. (49)Watanabe, M.; Motoo, S. J. Electroanal. Chem. 1975, 60, 275–283.
(50)Kunimatsu, K.; Sato, T.; Uchida, H.; Watanabe, M. Electrochim. Acta 2008, 53, 6104–6110.
-35-
Chapter 3
Effect of adsorbed anions on the oxygen reduction
activities of Pt
3-1. Introduction
The practical operating potential of the PEFC cathode is usually higher than 0.7 V vs. RHE. However, in such a potential range, one must take into account the effects of specific anion adsorption on the ORR activities. The catalyst layer in the gas diffusion electrode (GDE) of PEFCs consists of Pt nanoparticle catalysts supported on carbon black (Pt/C), together with the electrolyte binder or ionomer. The specific adsorption of a conventional perfluorinated sulfonic acid (PFSA) ionomer such as Nafion® was observed by in situ FTIR.1 Recently, Yoda et al. in our laboratory found that a sulfonated poly (arylene ether) ionomer (SPAE) adsorbed strongly on Pt/C catalysts, leading to decreased ORR activity, particularly at low humidities, compared with the conventional Nafion®-GDE, while the electrochemically active surface area (ECA) for the SPAE-GDE, which was measured by cyclic voltammetry at 100%-RH, was nearly identical with that for Nafion-GDE.2 They also clarified that the performances of SPAE-GDEs were indeed improved by suppressing the specific adsorption of the SPAE on the Pt catalyst, even at low humidities.3
It was found in rotating ring disk electrode (RRDE) experiments in HClO4
aqueous solution that the H2O2 production on Pt was induced in the presence of
strongly adsorbed species such as organic adsorbates or halide anions,4-6 which may block the dissociation of adsorbed O2. It has also been reported for bulk Pt-RDEs that
the specifically adsorbed sulfate anions SO42− block the active sites on Pt [particularly
the Pt(111)] surface, resulting in the reduction of the ORR activity.7 In practical PEFCs, it is well known that SO42− anions are generated by the decomposition of PFSA
electrolyte membranes during operation. The mass activity (MA) for the ORR on pristine Pt/C in a single cell at 0.85 V was found to decrease remarkably when H2SO4
aqueous solution was injected into the cell under constant current operation at 80oC.8 The MA decreased with increasing H2SO4 concentration, whereas the values of ECA
measured at E < 0.4 V changed to a negligible extent.
-36-
Pt catalysts in the potential range of practical PEFC operation. So far, for screening tests of ORR catalysts, HClO4 electrolyte solutions have been widely used, because
many researchers undoubtedly believe the effect of the adsorption of ClO4− anions to
be negligible. However, by using in situ attenuated total reflection FTIR (ATR-FTIR) in our group, it was found that ClO4− anions do adsorb on a polycrystalline Pt film
electrode and affect the methanol oxidation rate.9
In our ongoing research program, we have analyzed the ORR mechanism of Pt and Pt alloy electrodes quantitatively by using the EQCM method. This research complements the results obtained by EC-XPS10 and ATR-FTIR.11 In this chapter, I have shown the effects of electrolyte solutions (HClO4 and HF at various
concentrations) on the ORR activities of a Pt film electrode prepared on an EQCM and on an RDE. Frumkin-Temkin-type specific adsorption of ClO4− on Pt is clearly shown.
The highlight is a detection of reversible mass changes due to the adsorption of one or more oxygen species on a Pt-EQCM in O2-saturated and He-purged HF and HClO4
solutions, for the first time. An important role of protons in controlling the ORR rates is also demonstrated.


![Figure 3-4 shows plots of ∆m on Pt-EQCM as a function of the logarithm of [HClO 4 ] on the Pt electrode at 0.55 and 0.60 V](https://thumb-ap.123doks.com/thumbv2/123deta/7696034.1217044/45.892.235.614.640.1037/figure-shows-plots-eqcm-function-logarithm-hclo-electrode.webp)