MOLECULAR DYNAMICS
SIMULATIONS OF DNA DIMERS
BASED ON
REPLICA-EXCHANGE
UMBRELLA SAMPLING
A Thesis
Presented to the Department of Functional Molecular Science
School of Physical Science
The Graduate University for Advanced Studies
for the Degree of Doctor of Science
by
Katsumi Murata
March 2005
To my parents, Kenji and Ayako Murata
Acknowledgments
My most heartfelt thanks go to my thesis advisor, Professor Yuko Okamoto, for his
patient guidance and constant encouragement. I would like to thank Dr Yuji Sugita for
valuable and helpful discussions. I wish to express my gratitude to all the members of
the Okamoto Groups for stimulating discussions and encouragement. I am grateful to the
members of the IMS theory groups for their generous support. I wish to thank the faculty
and staff members of the Graduate University for Advanced Studies for their kindness. I
am most thankful to my parents Kenji and Ayako Murata and my wife Jun Murata for
their constant encouragement and support.
Contents
1 General Introduction 6
2 Test of Sampling Efficiency in Replica-Exchange Umbrella Sampling
Simulations of DNA Dimers 15
2.1 Introduction . . . 16
2.2 Methods . . . 17
2.2.1 Replica-exchange umbrella sampling . . . 17
2.2.2 Sugar puckering modes and torsion angles in nucleotides . . . 21
2.3 Results and Discussion . . . 23
2.4 Conclusions . . . 50
3 Free Energy Analysis for DNA Base Stacking 55 3.1 Introduction . . . 56
3.2 Methods . . . 57
3.3 Results and Discussion . . . 60
3.4 Conclusions . . . 78
4 Summary and Outlook 81
Chapter 1
General Introduction
The three-dimensional structure of DNA is stabilized mainly by the base stacking in-
teractions, and these interactions depend on the base sequence. The relationship between
DNA sequence and structure has therefore been a subject of much interest in recent years
[1-6]. However, DNA structure is also strongly influenced by the environment, e.g., the
solvent and ionic concentration, and crystallization in trigonal versus monoclinic space
groups [7]. These effects lead to local helix parameter changes or global structural changes
among the A-, B-, and Z-DNA. Therefore, it is important to evaluate the base stacking
interactions in the biologically relevant B-DNA. X-ray crystallography has allowed us to
understand the molecular basis for the structural properties of DNA, but suffers from
limitations in the number of the structures that can be crystallized and diffract to precise
resolution, and interference from crystal packing effects [7-9].
Molecular dynamics (MD) simulations have also given many insights into the structural
properties of DNA. For example, a spontaneous A-DNA to B-DNA transition in aqueous
solution was observed on 500 ps to ca. 1.5 ns simulation time scale [10]. Two kinds
of simulations (one starting from the canonical A-DNA structure and the other starting
from the canonical B-DNA) converged to yield the common B-DNA structure, which was
in good agreement with the data from X-ray crystallography and NMR. The generation
of DNA bending was also a subject of MD simulations. The results for a poly-adenine
stretch (A-tract) reproduced a number of experimentally measured properties of the DNA
including a helical bend of ∼17◦ per A-tract [11].
Despite many successes in MD simulations, there are still a number of issues. For
instance, the sampling issue is particularly important. In biological systems composed
of nucleic acids and/or proteins, there exist a huge number of local-minimum states in
the potential energy surface and the MD simulations tend to get trapped in a few of
the local-minimum states. However, this multiple-minimum problem can be overcome
by, for instance, generalized-ensemble algorithms [12-14], in which each state is weighted
by a non-Boltzmann probability weight factor so that a random walk in potential energy
space may be realized. The random walk allows the simulation to escape from any energy
barrier and to sample much wider configurational space than by conventional methods.
The stacking free energies of nucleic acid bases, nucleosides, nucleotides in aqueous
solution have been determined by a number of experimental measurements [15-20]. These
experimental values measured by different groups are considerably at variance. However,
there exist qualitative trends in order of the stability (purine-purine > purine-pyrimidine
> pyrimidine-purine > pyrimidine-pyrimidine).
Ab initio calculations have been used to investigate the base-base interactions without
the sugar or phosphate backbone [21-23]. Sponer et al. performed ab initio calculations
and elucidated the relative stability among various stacked dimers [22]. From recent ab
initio studies, the backbone appears to be indispensable for studying the stable structure
and electronic properties of the stacked DNA base pairs [24, 25]. For example, Kurita
and Kobayashi claimed that the PO4 parts might play a role as a reaction site in chemical
processes concerning DNA [25].
Free energy calculations have also been performed to study the conformational proper-
ties of the nucleic acid bases. The free energy perturbation/molecular dynamics (FEP/MD)
method has been employed to evaluate the solvation effects on the association of the nu-
cleic acid bases in vacuo and in water solution [26]. Friedman and Honig analyzed the free
energy contributions to the base stacking and indicated that the electrostatic contributions
oppose binding and that the Lennard-Jones (LJ) and nonpolar solvation contributions fa-
vor stacking [27]. In Refs. 28 and 29, potential of mean force (PMF) calculations have
been used to investigate the free energy of the stacking process of DNA and RNA dimers
using the conventional umbrella sampling (US) [30]. In these studies, good stacking was
observed for almost all dimers, but poor stacking was also observed for some dimers.
In this thesis, we employ one of the recently developed generalized-ensemble algo-
rithms, replica-exchange umbrella sampling (REUS) [31], which is a multidimensional
extension of the replica-exchange molecular dynamics method (REMD) [32]. We per-
form the potential of mean force calculations (PMF) of DNA dimers in aqueous solu-
tion using REUS. In Chapter 2, we address the sampling issues of the REUS simula-
tions, examining the results of four DNA dimers (dApdA, dApdT, dTpdA, and dTpdT).
The dApdA, dApdT, dTpdA, and dTpdT dimers correspond to purine-purine, purine-
pyrimidine, pyrimidine-purine, and pyrimidine-pyrimidine dimers, respectively. In Chap-
ter 3, we give more quantitative arguments based on free energy analysis. Chapter 4 is
devoted to summary and outlook.
Bibliography
[1] M. A. Young, G. Ravishanker, and D. L. Beveridge, Biophys. J. 68, 2454 (1995)
[2] A. A. Gorin, V. B. Zhurkin, and W. K. Olson, J. Mol. Biol. 247, 34 (1995)
[3] C. A. Hunter and X. J. Lu, J. Mol. Biol. 265, 603 (1997)
[4] U. Dornberger, N. Spackovj, A. Walter, F. A. Gollmick, J. Sponer, and H. Fritzsche,
J. Biomol. Struct. Dyn. 19, 159 (2001)
[5] A. Scipioni, G. Zuccheri, C. Anselmi, A. Bergia, B. Samori, and P. D. Santis, Chem.
Biol. 9, 1315 (2002)
[6] D. Strahs, D. Barash, X. Qian, and T. Schlick, Biopolymers, 69, 216 (2003)
[7] A. Lipanov, M. L. Kopka, M. K. Grzeskowiak, M. Quintana, and R. E. Dickerson,
Biochemistry. 32, 1373 (1993)
[8] R. E. Dickerson, D. S. Goodshell, M. L. Kopka, and P. E. Pjura, J. Biomol. Struct.
Dyn 5, 159 (1987)
[9] R. E. Dickerson, D. S. Goodshell, and S. Neile, Proc. Natl. Acad. Sci. USA, 91,
3579 (1994)
[10] T. E. Cheatham III and P. A. Kollman, J. Mol. Biol. 259, 434 (1996)
[11] M. A. Young and D. L. Beveridge, J. Mol. Biol. 281, 675 (1998)
[12] U. H. E. Hansmann and Y. Okamoto, in Annual Reviews of Computational Physics
VI, ed. D. Stauffer (World Scientific, Singapore, 1999) pp. 129-157.
[13] A. Mitsutake, Y. Sugita, and Y. Okamoto, Biopolymers (Pept. Sci.) 60, 96 (2001).
[14] Y. Sugita and Y. Okamoto, in Lecture Notes in Computational Science and Engi-
neering, eds. T. Schlick and H. H. Gan (Springer-Verlag, New York, 2002) pp.304-
332; cond-mat/0102296
[15] P. O. P. Ts’o, I. S. Melvin, and A.C. Olson, J. Am. Chem. Soc. 85, 1289 (1962).
[16] T. N. Sollie and J. A. Schellman, J. Mol. Biol. 33, 61 (1968).
[17] N. I. Nakano and S. J. Igarashi, Biochemistry 9, 577 (1970).
[18] P. R. Mitchell and H. Sigel, Eur. J. Biochem. 88, 149 (1978).
[19] W. Saenger,Principles of Nucleic Acid Structure, Springer-Verlag, New York,
(1984).
[20] J. Morcillo, E. Gallego, and F. Peral, J. Mol. Struct. 157, 353 (1987).
[21] M. Aida, J. Theor. Biol. 130, 327 (1988).
[22] J. Sponer, J. Leszczynski, and P. Hobza, J. Phys. Chem. 100, 5590 (1996).
[23] H. Sugiyama and I. Saito, J. Am. Chem. Soc. 118, 7063 (1996).
[24] T. Shinoda, N.Shima, and M. Tsukada, Int. J. Quantum Chem. 49, 849 (1994).
[25] N. Kurita and K. Kobayashi, Comput. Chem. 24, 351 (2000).
[26] P. Cieplak and P. A. Kollman, J. Am. Chem. Soc. 110, 3734 (1988).
[27] R. A. Friedman and B. Honig, Biophys. J. 69, 1528 (1995).
[28] J. Norberg, and L. Nilsson, J. Am. Chem. Soc. 117, 10832 (1995).
[29] J. Norberg and L. Nilsson, Biophys. J. 69, 2277 (1995).
[30] G.M. Torrie,andP. Valleau, J. Comput. Phys. 23, 187 (1977).
[31] Y. Sugita, A. Kitao, and Y. Okamoto, J. Chem. Phys. 113, 6042 (2000).
[32] Y. Sugita, Y. Okamoto, Chem. Phys. Lett. 314, 141 (1999).
Chapter 2
Test of Sampling Efficiency in
Replica-Exchange Umbrella
Sampling Simulations of DNA
Dimers
Katsumi Murata, Yuji Sugita, and Yuko Okamoto, “Free energy
calculations for DNA base stacking by replica-exchange umbrella
sampling,” Chemical Physics Letters 85, 1-7 (2004).
Katsumi Murata, Yuji Sugita, and Yuko Okamoto, “Molecular
dynamics simulations of DNA dimers based on replica-exchange
umbrella sampling. I. Test of sampling efficiency,” Journal of
Theoretical and Computational Chemistry, in press.
2.1 Introduction
We have performed the molecular dynamics simulation based on replica-exchange umbrella
sampling for all the 16 DNA dimers. All the REUS simulations have been performed
including explicit water molecules. In this respect, the present study is different from Ref.
1 where an alanine trimer in vacuum was studied. Therefore, we have to examine the
sampling efficiency of the reaction (biased) coordinate and other (unbiased) parameters in
the REUS simulation in detail. Here in this Chapter we address the sampling issues of the
REUS simulations, examining the results of four DNA dimers (dApdA, dApdT, dTpdA,
and dTpdT). Note that the dApdA, dApdT, dTpdA, and dTpdT dimers correspond to
purine-purine, purine-pyrimidine, pyrimidine-purine, and pyrimidine-pyrimidine dimers,
respectively. In Chapter 3 we will present the results of free energy analysis for all the 16
DNA dimers.
2.2 Methods
2.2.1 Replica-exchange umbrella sampling
We briefly review the algorithm of the replica-exchange umbrella sampling (REUS) [1].
The system for REUS consists of M noninteracting replicas with M different values of the
parameters λm (m= 1 ,. . . , M ). We arrange the replicas so that replica i and parameter
λm are in one-to-one correspondence. Although the multiple values of temperature can
be introduced into the replica-exchange process [1,2], we use only one temperature value
(T =300 K) in the present study. Let us consider the Hamiltonian for the i-th replica with
parameter value λm, which can be written as
Hm(q[i], p[i]) = K(p[i]) + Eλm(q[i]). (2.1)
where q[i] and p[i] respectively stand for coordinates and momenta of N atoms in replica
i, K(p[i]) is the kinetic energy, Eλm(q[i]) is the potential energy that depends on the
parameter λm. Because the replicas are noninteracting, the weight factor for a state X in
REUS (with the fixed inverse temperature=1/300kβ, where kβ is the Boltzmann constant)
is given by the product of Boltzmann factors for each replica:
WREU S = exp{−
M
X
i=1
βHm(q[i], p[i])}. (2.2)
The state X = {..., x[i]m ,...} is specified by M sets of coordinates q[i] and momenta p[i] in
replica i at parameter λm:
x[i]m ≡ (q[i], p[i]). (2.3)
We consider exchanging a pair of replicas in REUS. Suppose we exchange replicas i and
j, which take parameter values λm and λn, respectively :
X = {..., x[i]m, ..., x[j]n, ...} → X′ = {..., x[j]m, ..., x[i]n, ...}. (2.4)
In order for this exchange process to converge towards the equilibrium distribution, it is
sufficient to impose the detailed balance condition on the transition probability w(X →
X′):
WREU S(X)w(X → X′) = WREU S(X′)w(X′ → X). (2.5)
From Eqs. (2.1), (2.2), and (2.5), we have
w(X → X′)
w(X′ → X) = exp(−∆), (2.6)
where,
∆ = β(Em(q[j]) − Em(q[i]) − En(q[j]) + En(q[i])). (2.7)
This can be satisfied, for instance, by the usual Metropolis criterion [3]:
w(X → X′) = w(x[i]m | x[j]n ) =
( 1, for ∆ ≤ 0,
exp(−∆), for ∆ > 0. (2.8)
A simulation of REUS is then realized by alternately performing the following two steps:
(1) Each replica of the fixed parameter is simulated simultaneously and independently
for a certain MD steps.
(2) A pair of replicas, say x[i]m and x[j]n , are exchanged with the probability w(x[i]m | x[j]n) in
Eq. (2.8).
We can generalize Eq. (2.1) and write
Eλ(q) = E0(q) +
L
X
l=1
λ(l)Vl(q), (2.9)
where E0(q) is the original unbiased potential, Vl(q) (l=1,… ,L) are the biasing (umbrella)
potentials, and λ(l) are the corresponding coupling constants [λ = (λ(1) , … , λ(L) )]. A
harmonic restraining potential is usually used for umbrella potential along the ”reaction
coordinate” R:
Vl(q) = kl[R(q) − Rl]2,(l = 1, ..., L), (2.10)
where Rl are the midpoints and kl are the strengths of the restraining potentials.
We prepare replicas so that the potential energy for each replica includes exactly one
umbrella potential (here, we have M = L). Namely, in Eq. (2.9) for λ = λm we set
λ(l)m = δl,m, (2.11)
where δl,m is Kronecker’s delta function and we have
Eλm(q[i]) = E0(q[i]) + Vm(q[i]). (2.12)
The acceptance criterion for each replica exchange is given by Eq. (2.8), where Eq. (2.7)
now reads
∆ = β(Vm(q[j]) − Vm(q[i]) − Vn(q[j]) + Vn(q[i])). (2.13)
2.2.2 Sugar puckering modes and torsion angles in nucleotides
The sugar ring of nucleotides consists of five atoms (C1’, C2’, C3’, C4’, and O4’). These
atoms are generally not in a plane, and the ring can be puckered in two forms (an envelope
form (E) and a twist form (T)) [4]. While four atoms are in a plane and the fifth atom
is out by 0.5 A in an E form, two adjacent atoms are on opposite sides of a plane (that
is defined by the other three atoms) in a T form. Atoms which are not in the plane are
called endo when they are on the same side of C5’, and those on the opposite side of C5’
are called exo.
In nucleotides, the pseudorotation phase angle p is calculated from [5]
tan p = (ν4+ ν1) − (ν3+ ν0)
2ν2(sin36◦+ sin72◦). (2.14)
where ν0, ν1, ν2, ν3, and ν4 are the endocyclic torsion angles:
ν0, C4’-O4’-C1’-C2’; ν1, O4’-C1’-C2’-C3’; ν2, C1’-C2’-C3’-C4’; ν3, C2’-C3’-C4’-O4’; ν4,
C3’-C4’-O4’-C1’.
The backbone and glycosidic torsion angles are defined as follows [4]:
α, O3’-P-O5’-C5’; β, P-O5’-C5’-O4’; γ, O5’-C5’-C4’-C3’; δ, C5’-C4’-C3’-O3’; ǫ, C4’-C3’-
O3’-P; ζ, C3’-O3’-P-O5’; χ, O4’-C1’-N1-C2 (pyrimidines) or O4’-C1’-N9-C4 (purines).
We calculated the pseudorotation phase angles and these torsion angles using the program
Curves [6].
2.3 Results and Discussion
In order to examine the conformations of the DNA dimers at the stacked and unstacked
states, we calculated the pseudorotation phase angles of the DNA dimers of the trajecto-
ries, which were generated from the MD simulations based on REUS. Four DNA dimers
composed of the purine-purine (dApdA), purine-pyrimidine (dApdT), pyrimidine-purine
(dTpdA), and pyrimidine-pyrimidine (dTpdT) were studied. The computer code devel-
oped in Refs. 7 and 8, which is based on Version 2 of PRESTO [9], was used. The
temperature during MD simulations was controlled by the constraint method [10, 11] and
was set to 300 K. The force-field parameters were taken from the parm99 of AMBER [12].
The initial conformation of each DNA dimer was generated as the single-stranded canon-
ical B-DNA using the nucgen module in the AMBER program package [13]. A sodium
counterion was placed on the bisector of the phosphate oxygens to produce an electrically
neutral system. Each of DNA dimer was immersed in a sphere of radius 18.0 ˚A of TIP3P
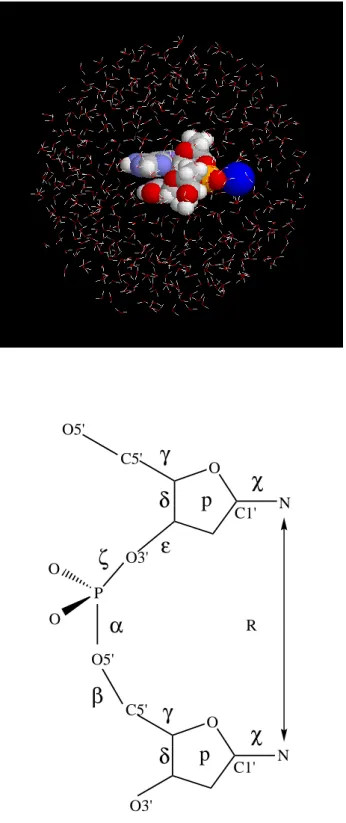
water molecules [14]. The initial configuration is shown in Fig. 2.1(a) for the dApdT
dimer. The number of water molecules is 529. For dApdA dimer, dTpdA dimer, and
dTpdT dimer, it is 519, 528, and 516, respectively. The dielectric constant was set equal
(a)
(b)
O O
O3' C5' O5'
P C5'
O5' O
O O3'
N
N R
C1' C1'
✁ ✂
✄ ☎
✂ ☎
✆✆
p
p
✝
Figure 2.1: (a)The initial structure for the AT dimer, which is placed in the sphere of 529 TIP3P water molecules of radius of 18 ˚A. (b)Definition of the reaction coordinate R which is the distance between the base glycosidic nitrogen atoms. The backbone and glycosidic torsion angles are also defined.
to 1.0. The cell-multipole method [15, 16] was used for long-range interactions. The unit
time step was set to 1.0 fs, and replica exchange was tried every 400 MD steps. We made
an MD simulation of 1.0 × 10⁷ time steps (or 10.0 ns) for each replica (before taking
data, we also made regular umbrella sampling simulations without replica exchange for
100 ps with each parameter value and then a replica-exchange simulation of 100 ps for
equilibration).
The parameters characterizing the replicas for the simulations performed in the present
work are listed in Table 2.1. The distance between the glycosidic nitrogen atoms of the
bases (N1 for pyrimidine and N9 for purine) was chosen as the reaction coordinate R for
the harmonic restraining potential in Eq. (2.10) as shown in Fig. 2.1(b). We used 18
different parameters and ordered the harmonic restraining potentials Vl in the increasing
order of the midpoint value Rl, i.e., the same order as listed in Table 2.1. There are
two possible ways of pairing replicas corresponding to neighboring restraining potentials,
namely, the first set of pairing has nine pairs: (1,2), (3,4),… , (17,18), and the second set of
pairing has eight pairs: (2,3), (4,5),… , (16,17). The first set of pairing was simultaneously
exchanged after 400 fs of parallel MD simulations, and then the second set of pairing was
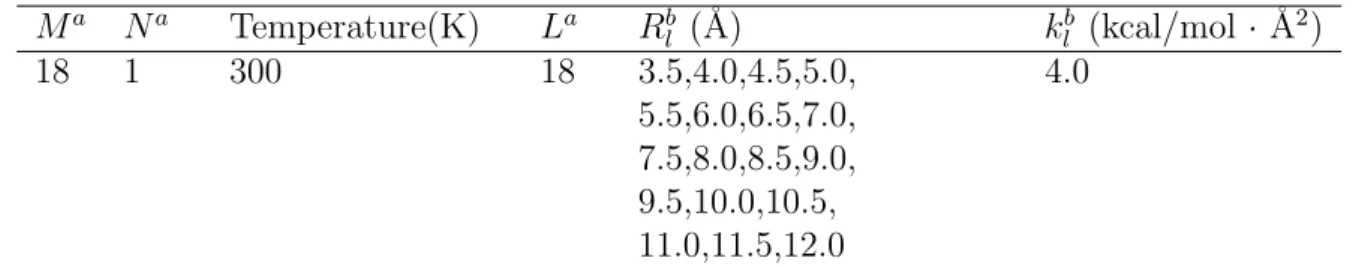
Table 2.1: The replica parameters for the present simulation.
Ma Na Temperature(K) La Rlb (˚A) klb (kcal/mol · ˚A2)
18 1 300 18 3.5,4.0,4.5,5.0, 4.0
5.5,6.0,6.5,7.0, 7.5,8.0,8.5,9.0, 9.5,10.0,10.5, 11.0,11.5,12.0
aM, N , and L are the total numbers of replicas, temperatures,and restraining potentials, respectively. [see Eqs. (2.2) and (2.9)].
bk
l and Rl(l = 1, ..., L) are the strength and the midpoints of the restraining potentials, respectively. [see Eq. (2.10)]
simultaneously exchanged after 400 fs of parallel MD simulations, and those two steps
were repeated.
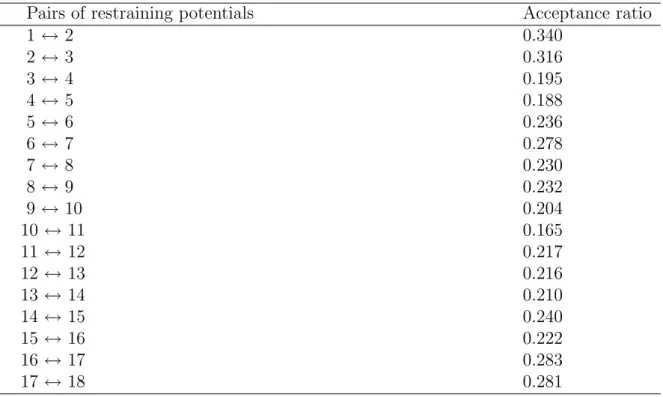
We examine whether the present replica-exchange process properly occurred in REUS.
First of all, we list in Table 2.2 the acceptance ratios of replica exchange corresponding
to the adjacent pairs of the restraining potentials. The values are for the dApdT dimer.
They are essentially the same for the other DNA dimers. One criterion for the optimal
performance of REUS is whether the acceptance ratio of replica exchange is uniform and
sufficiently large or not. In Table 2.2 we observe almost uniform and large enough (> 10
%) values. Hence, the replica-exchange simulations indeed performed properly.
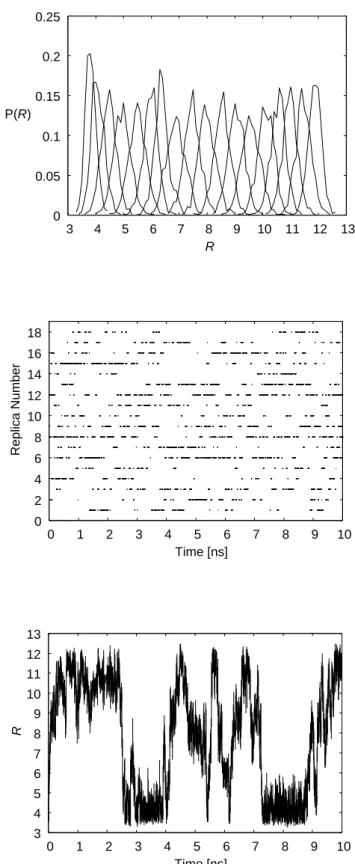
The complementary picture to this is the probability distributions corresponding to the
adjacent pairs of the restraining potentials. In Fig. 2.2(a) the probability distributions of
Table 2.2: Acceptance ratios of replica-exchange in REUS for the AT dimer.
Pairs of restraining potentials Acceptance ratio
1 ↔ 2 0.340
2 ↔ 3 0.316
3 ↔ 4 0.195
4 ↔ 5 0.188
5 ↔ 6 0.236
6 ↔ 7 0.278
7 ↔ 8 0.230
8 ↔ 9 0.232
9 ↔ 10 0.204
10 ↔ 11 0.165
11 ↔ 12 0.217
12 ↔ 13 0.216
13 ↔ 14 0.210
14 ↔ 15 0.240
15 ↔ 16 0.222
16 ↔ 17 0.283
17 ↔ 18 0.281
the reaction coordinate at the 18 restraining potentials of REUS are shown. We observe
sufficient overlaps in pairs of the distributions corresponding to neighboring parameter
values in REUS. This indicates that the acceptance ratios listed in Table 2.2 are reason-
able.
In order to further confirm that the REUS simulations performed properly, we examined
random walks in the replica and restraining potential space for dApdT dimer. The time
series of replica exchange for the parameter λ2 (i.e., kl = 4.0 and Rl = 4.0) is shown in
Fig. 2.2(b). We indeed observe a random walk in the replica space. The complementary
(a)
0 0.05 0.1 0.15 0.2 0.25
3 4 5 6 7 8 9 10 11 12 13 R
P(R)
(b)
0 2 4 6 8 10 12 14 16 18
0 1 2 3 4 5 6 7 8 9 10
Time [ns]
Replica Number
(c)
3 4 5 6 7 8 9 10 11 12 13
0 1 2 3 4 5 6 7 8 9 10
Time [ns]
R
Figure 2.2: Probability distributions and time series obtained from the REUS simulation of the dApdT dimer. (a) The probability distributions of the reaction coordinate R. (b) Time series of replica exchange for the parameter λ2 (i.e., kl = 4.0 and Rl = 4.0). (c) Time series of the reaction coordinate R for one of the replicas (Replica 2).
picture to this is λ-exchange for each replica, which induces a random walk of the reaction
coordinate R for a fixed replica. We show the time series of the reaction coordinate R
for one of the replicas (Replica 2) in Fig. 2.2(c). We again observe a random walk in the
restraining potential space, indicating that a large number of very different conformations
were sampled.
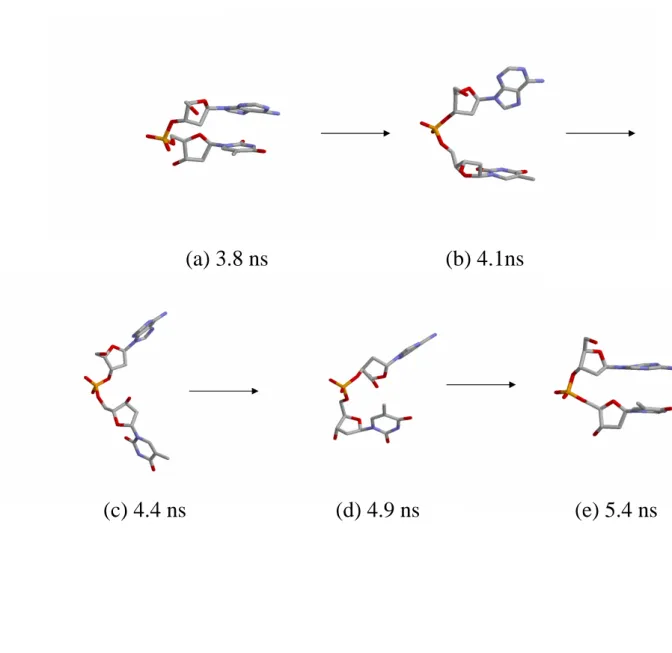
Five snapshots from the 10 ns trajectory for Replica 2 of the dApdT dimer are shown in
Fig. 2.3. The stacked state at the simulation time 3.8 ns is shown in Fig. 2.3(a). The
reaction coordinate R is 4.1 ˚A, and the base planes are close to parallel. Fig. 2.3(b) shows
the intermediate state at the simulation time 4.1 ns, and the reaction coordinate R is 7.0
˚A. The unstacked state at the simulation time 4.4 ns is shown in Fig. 2.3(c). The reaction
coordinate R is 10.3 ˚A. Fig. 2.3(d) shows the intermediate state at the simulation time
4.9 ns, and the reaction coordinate R is 7.2 ˚A. The stacked state at the simulation time
5.4 ns is shown in Fig. 2.3(e). The reaction coordinate R is 4.1 ˚A, and the base planes
are close to parallel again. We indeed observed an unstacking-stacking process during the
simulation from time 3.8 to 5.4 ns.
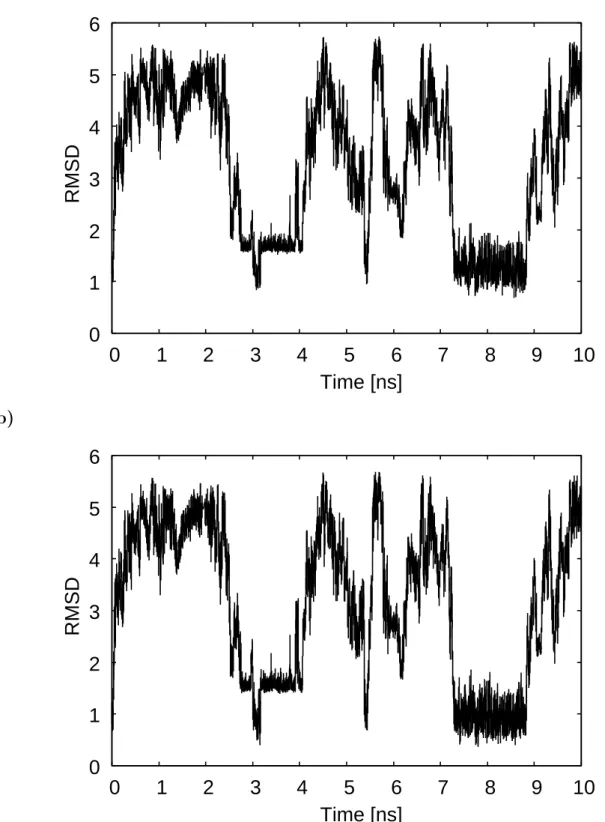
We next examined the root-mean-square deviations (RMSD) of the trajectory of heavy
(a) 3.8 ns (b) 4.1ns
(c) 4.4 ns (d) 4.9 ns (e) 5.4 ns
Figure 2.3: Snapshots of the dApdT dimer from the REUS simulation for one of the replicas (Replica 2): (a) 3.8 ns; (b) 4.1 ns; (c) 4.4 ns; (d) 4.9 ns; (e) 5.4 ns.
atoms for the dApdT dimer from the canonical A-DNA and B-DNA. The time series of
the RMSD values are shown in Fig. 2.4. We see that the RMSD values are small when
the reaction coordinate R is small (see also Fig. 2.3(c)) and that the RMSD values from
the canonical A-DNA vary similarly to those from the canonical B-DNA. This similarity
may be because the RMSD value of heavy atoms between the canonical A-DNA and B-
DNA is also small (0.956 ˚A). The range of the RMSD values from the canonical A-DNA
and B-DNA is 0.8 - 5.8 ˚A and 0.3 - 5.7 ˚A, respectively. The RMSD values suggest that
the structures obtained by the REUS simulations represent those between the canonical
A-DNA and B-DNA structures and are closer to B-DNA. Similar results were seen in the
MD simulations by Cheatham, III and Kollman [17]. The average structures obtained by
their MD simulations were closer to the canonical B-DNA structure. Their RMSD values
were, however, larger than ours. This is because the DNA used in their simulations was
double stranded and a decamer, while it is single stranded and a dimer in the present
study.
The backbone and glycosidic torsion angles were also examined for the dApdT dimer.
The time series of the angles are shown in Figs. 2.5 and 2.6. The angles of the canonical
(a)
0
1
2
3
4
5
6
0 1 2 3 4 5 6 7 8 9 10
Time [ns]
RMSD
(b)
0
1
2
3
4
5
6
0 1 2 3 4 5 6 7 8 9 10
Time [ns]
RMSD
Figure 2.4: Time series of the root-mean-square deviations (RMSD) from (a) the canonical A-DNA and (b) the canonical B-DNA.
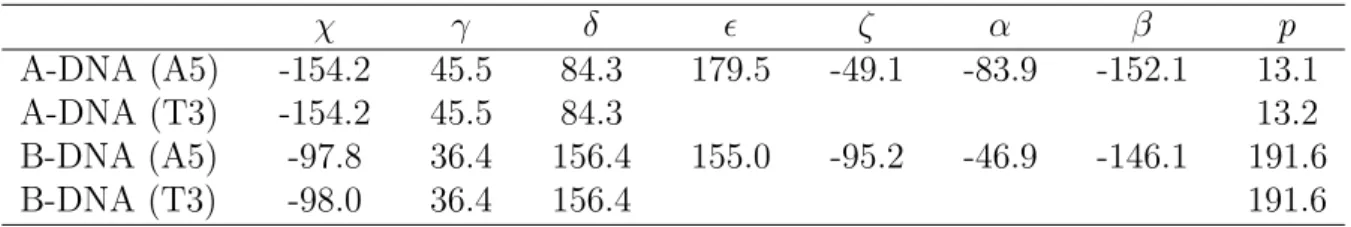
A-DNA and B-DNA are listed in Table 2.3 for reference. The χ angles take various values
with the time evolution. The angles fluctuate between the canonical A-DNA value (-154◦)
and the canonical B-DNA value (-98◦) during the simulation time 7.0 - 9.0 ns. The γ
angles fluctuate between 30 - 90◦ at about 70 % of all the simulation time, at which the
angles of the canonical A-DNA (45◦) and B-DNA (36◦) are within the range. The δ angles
fluctuate between the canonical A-DNA (84◦) and B-DNA (156◦) at all the simulation
time. The ǫ angle takes various values during the simulation time 2.0 - 4.0 and 7.0 - 9.0
ns and fluctuates between -120◦ and -60◦ during the other simulation time. The ζ angle
takes various values and fluctuates between the canonical A-DNA (-49◦) and B-DNA (-
95◦) during the simulation time 2.4 - 4.4 and 7.0 - 8.8 ns. The α angle takes various values
and fluctuates between -30◦ and -110◦ during the simulation time 2.2 - 3.8 and 7.2 - 8.8
ns. The α angle of the canonical A-DNA and B-DNA is -84◦ and -47◦, respectively. The
β angle fluctuates between the region of -180 - -150◦ and that of 150 - 180◦ during all the
simulation time. It should be noted that the β angle hardly take the values between -150
and 150◦. In summary, the torsion angles fluctuate between the canonical A-DNA and
B-DNA when the reaction coordinate R is 4.0 - 6.0 ˚A, where the DNA dimer is stacked.
(a)
-180
-150
-120
-90
-60
-30
0
30
60
90
120
150
180
0 1 2 3 4 5 6 7 8 9 10
Time [ns]
[degree]
(b)
-180
-150
-120
-90
-60
-30
0
30
60
90
120
150
180
0 1 2 3 4 5 6 7 8 9 10
[degree]
Time [ns]
Figure 2.5: Time series of the backbone and glycosidic torsion angles obtained by the REUS simulations for the dApdT dimer: (a) χ angle on the 5’ side; (b) χ angle on the 3’ side; (c) γ angle on the 5’ side; (d) γ angle on the 3’ side; (e) δ angle on the 5’ side; (f) δ angle on the 3’ side.
(c)
-180
-150
-120
-90
-60
-30
0
30
60
90
120
150
180
0 1 2 3 4 5 6 7 8 9 10
Time [ns]
[degree]
(d)
-180
-150
-120
-90
-60
-30
0
30
60
90
120
150
180
0 1 2 3 4 5 6 7 8 9 10
[degree]
Time [ns]
Figure 2.5: (Continued)
(e)
-180
-150
-120
-90
-60
-30
0
30
60
90
120
150
180
0 1 2 3 4 5 6 7 8 9 10
Time [ns]
[degree]
(f )
-180
-150
-120
-90
-60
-30
0
30
60
90
120
150
180
0 1 2 3 4 5 6 7 8 9 10
Time [ns]
[degree]
Figure 2.5: (Continued)
(a)
-180
-150
-120
-90
-60
-30
0
30
60
90
120
150
180
0 1 2 3 4 5 6 7 8 9 10
Time [ns]
[degree]
(b)
-180
-150
-120
-90
-60
-30
0
30
60
90
120
150
180
0 1 2 3 4 5 6 7 8 9 10
Time [ns]
[degree]
Figure 2.6: Time series of the backbone and glycosidic torsion angles obtained by the REUS simulations for the dApdT dimer: (a) ǫ angle; (b) ζ angle; (c) α angle; (d) β angle.
(c)
-180
-150
-120
-90
-60
-30
0
30
60
90
120
150
180
0 1 2 3 4 5 6 7 8 9 10
Time [ns]
[degree]
(d)
-180
-150
-120
-90
-60
-30
0
30
60
90
120
150
180
0 1 2 3 4 5 6 7 8 9 10
[degree]
Time [ns]
Figure 2.6: (Continued)
Table 2.3: The canonical A-DNA and B-DNA values of the gricosidic and backbone torsion angles and pseudorotation phase angle (all in degrees)
χ γ δ ǫ ζ α β p
A-DNA (A5) -154.2 45.5 84.3 179.5 -49.1 -83.9 -152.1 13.1
A-DNA (T3) -154.2 45.5 84.3 13.2
B-DNA (A5) -97.8 36.4 156.4 155.0 -95.2 -46.9 -146.1 191.6
B-DNA (T3) -98.0 36.4 156.4 191.6
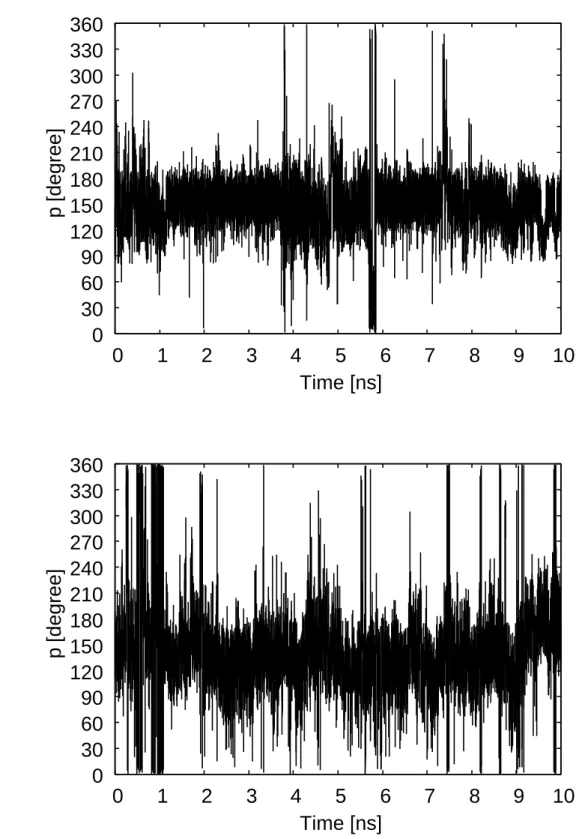
Pseudorotation phase angle is one of the geometrical variables that differ most signif-
icantly between A-DNA and B-DNA. The time series of the pseudorotation phase angles
for dApdA, dApdT, dTpdA, and dTpdT dimers are shown in Figs. 2.7 and 2.8. For
the dApdA dimer the pseudorotation phase angles in both 5′ and 3′ positions are shown
in Figs. 2.7(a) and 2.7(b), respectively. The pseudorotation phase angle in 5′ position
frequently takes B-DNA values and seldom does A-DNA values, while that in 3′ position
frequently takes both A-DNA and B-DNA values. In Figs. 2.7(c) and 2.7(d) we see that
the pseudorotation phase angles in both 5′ and 3′ positions frequently take both A-DNA
and B-DNA values for the dApdA dimer. As shown in Fig. 2.8 the behavior of the pseu-
dorotation phase angles for the dTpdA and dTpdT dimers are almost the same as for the
dApdA dimer. We see that the pseudorotation phase angles in 5′ positions prefer B-DNA
values and those in 3′ positions take the values of both A-DNA and B-DNA. Although it
appears that the DNA dimer prefer the B-DNA structure at the stacked states (R = 4.0
- 6.0 ˚A), the extent of the preference is not obvious.
(a)
0
30
60
90
120
150
180
210
240
270
300
330
360
0 1 2 3 4 5 6 7 8 9 10
Time [ns]
p [degree]
(b)
0
30
60
90
120
150
180
210
240
270
300
330
360
0 1 2 3 4 5 6 7 8 9 10
Time [ns]
p [degree]
Figure 2.7: Time series of the pseudorotation phase angles obtained by the REUS simu- lations for the dApdA and dApdT dimers. (a) The pseudorotation phase angle on the 5′ side for the dApdA dimer. (b) The pseudorotation phase angle on the 3′ side for dApdA dimer. (c) The pseudorotation phase angle on the 5′ side for the dApdT dimer. (d) The pseudorotation phase angle on the 3′ side for dApdT dimer.
(c)
0
30
60
90
120
150
180
210
240
270
300
330
360
0 1 2 3 4 5 6 7 8 9 10
Time [ns]
p [degree]
(d)
0
30
60
90
120
150
180
210
240
270
300
330
360
0 1 2 3 4 5 6 7 8 9 10
p [degree]
Time [ns]
Figure 2.7: (Continued)
(a)
0
30
60
90
120
150
180
210
240
270
300
330
360
0 1 2 3 4 5 6 7 8 9 10
Time [ns]
p [degree]
(b)
0
30
60
90
120
150
180
210
240
270
300
330
360
0 1 2 3 4 5 6 7 8 9 10
Time [ns]
p [degree]
Figure 2.8: Time series of the pseudorotation phase angles obtained by the REUS sim- ulations for the dTpdA and dTpdT dimers. (a) The pseudorotation phase angle on the 5′ side for the dTpdA dimer. (b) The pseudorotation phase angle on the 3′ side for the dTpdA dimer. (c) The pseudorotation phase angle on the 5′ side for the dTpdT dimer. (d) The pseudorotation phase angle on the 3′ side for the dTpdT dimer.
(c)
0
30
60
90
120
150
180
210
240
270
300
330
360
0 1 2 3 4 5 6 7 8 9 10
p [degree]
Time [ns]
(d)
0
30
60
90
120
150
180
210
240
270
300
330
360
0 1 2 3 4 5 6 7 8 9 10
Time [ns]
p [degree]
Figure 2.8: (Continued)
We therefore examined the histograms of the sugar puckering modes at the stacked
states (R = 4.0 - 6.0 ˚A) for dApdA, dApdT, dTpdA, and dTpdT dimers. C3′-endo and
C2′-endo modes are characteristics of A-DNA and B-DNA, respectively. The results are
shown in Figs. 2.9 and 2.10. The number of C2′-endo is the most for the dApdA, dTpdA,
and dTpdT dimers in both 5′ and 3′ positions. For the dApdT dimer the number of
C2′-endo is the second most, and that of C1′-exo is the most. We also obtained a lot of
C2′-exo modes which correspond to the sugar puckering mode of the canonical B-DNA.
C3′-endo is almost not seen for all the DNA dimers. Especially, for the dApdA and dTpdA
dimers no C3′-endo was obtained in 5′position. We found a definite preference for B-DNA
structure for the DNA dimers. We remark that Norberg and Nilsson suggested that the
conformation of the DNA dimers in the stacked state was closer to A-DNA than B-DNA
[18]. The cause of the discrepancy is not clear, but it is presumably due to the different
force fields that were used: they used CHARMM22 [19] whereas we used AMBER parm99
[12].
(a)
0
500
1000
1500
2000
2500
3000
3500
4000
4500
5000
C2’x
C1’d
O4’x
C4’d
C3’x
C2’d
C1’x
O4’d
C4’x
C3’d
Number of Occurences
(b)
0
500
1000
1500
2000
2500
3000
3500
4000
C2’x
C1’d
O4’x
C4’d
C3’x
C2’d
C1’x
O4’d
C4’x
C3’d
Number of Occurences
Figure 2.9: Histograms of the pseudorotation phase angles at the stacked states on (a) the 5′ side for the dApdA dimer, (b) the 3′ side for the dApdA dimer, (c) the 5′ side for the dApdT dimer and (d) the 3′ side for the dApdT dimer.
(c)
0
1000
2000
3000
4000
5000
6000
7000
C2’x
C1’d
O4’x
C4’d
C3’x
C2’d
C1’x
O4’d
C4’x
C3’d
Number of Occurences
(d)
0
1000
2000
3000
4000
5000
6000
7000
C2’x
C1’d
O4’x
C4’d
C3’x
C2’d
C1’x
O4’d
C4’x
C3’d
Number of Occurences
Figure 2.9: (Continued)
(a)
0
2000
4000
6000
8000
10000
12000
C2’x
C1’d
O4’x
C4’d
C3’x
C2’d
C1’x
O4’d
C4’x
C3’d
Number of Occurences
(b)
0
1000
2000
3000
4000
5000
6000
C2’x
C1’d
O4’x
C4’d
C3’x
C2’d
C1’x
O4’d
C4’x
C3’d
Number of Occurences
Figure 2.10: Histograms of the pseudorotation phase angles at the stacked states for the dTpdA and dTpdT dimers, on (a) the 5′ side for the dTpdA dimer, (b) the 3′ side for the dTpdA dimer, (c) the 5′ side for the dTpdT dimer, and (d) the 3′ side for the dTpdT dimer.
(c)
0
2000
4000
6000
8000
10000
12000
14000
16000
18000
20000
C2’x
C1’d
O4’x
C4’d
C3’x
C2’d
C1’x
O4’d
C4’x
C3’d
Number of Occurences
(d)
0
2000
4000
6000
8000
10000
12000
14000
C2’x
C1’d
O4’x
C4’d
C3’x
C2’d
C1’x
O4’d
C4’x
C3’d
Number of Occurences
Figure 2.10: (Continued)
2.4 Conclusions
In this chapter we have examined the performances of REUS simulations for four DNA
dimers (dApdA, dApdT, dTpdA, and dTpdT). It was shown that REUS allows wide
conformational space sampling, achieving stacking-unstacking transitions several times
in a single simulation run. It was also shown that the B-DNA structure rather than
the A-DNA one is favored in these systems. In particular, the histograms of the sugar
puckering modes at the stacked states (R = 4.0 - 6.0 ˚A) implied that the DNA dimers
prefer C2′-endo mode which corresponds to the B-DNA structure. A small population of
C3′-endo mode which corresponds to A-DNA structure was also observed. Although the
reaction coordinate that defined the umbrella potential was only the distance between the
glycosidic nitrogen atoms, we observed good sampling of other parameters (the backbone
and glycosidic torsion angles and the pseudorotation phase angle) as well as the reaction
coordinate. In addition we did observe stacking-unstacking transitions several times in a
single REUS simulation run. Our simulations achieved not only a transition from B-DNA
to A-DNA but also from A-DNA to B-DNA, the latter of which was not possible before as
far as we know. In the following chapter we will discuss these matters more quantitatively
by free energy analyses.
Bibliography
[1] Y. Sugita, A. Kitao, and Y. Okamoto, J. Chem. Phys. 113, 6042 (2000).
[2] Y. Sugita and Y. Okamoto, Chem. Phys. Lett. 314, 141 (1999).
[3] N. Metropolis, A. W. Rosenbluth, A. H. Teller, and E. Teller, J. Chem. Phys. 21,
1087 (1953).
[4] W. Saenger, Principles of Nucleic Acid Structure (Springer-Verlag, New York,
1984).
[5] C. Altona and M. Sundaralingam, J. Am. Chem. Soc. 94, 8205 (1972).
[6] R. Lavery and H. J. Sklenar, J. Biomol. Struct. Dynam. 6, 63 (1989).
[7] Y. Sugita and A. Kitao, Proteins 30, 388 (1998).
[8] A. Kitao, S. Hayward, and N. Go, Proteins 33, 496 (1998).
[9] K. Morikami, T. Nakai, A. Kidera, M. Saito, and H. Nakamura, Comput. Chem.
16, 243 (1992).
[10] W. G. Hoover, A. J. C. Ladd, and B. Moran, Phs. Rev. Lett. 48, 1818 (1982).
[11] D. J. Evans and G. P. Morris, Phys. Lett. A98, 433 (1983).
[12] J. Wang, P. Cieplak, and P. A. Kollman, J. Comput. Chem. 21, 1049 (2000).
[13] D. A. Case, D. A. Pearlman, J.W. Caldwell, T. E. Cheatham III, W. S. Ross, C. L.
Simmerling, T. A. Darden, K. M. Merz, R.V. Stanton, A. L. Cheng, J. J. Vincent,
M. Crowley, V. Tui, R. J. Radmer, Y. Duan, J. Pitera, I. Massova, G. L. Seibel, U.
C. Singh, P. K. Weiner, and P. A. Kollman, AMBER 6, University of California,
San Francisco (1999).
[14] W. L. Jorgensen, J. Chandrasekhar, J. D. Madura, R. W. Impey, and M. L. Klein,
J. Comput. Chem. 13, 1011 (1992).
[15] H.-Q. Ding, N. Karasawa, and W. A. Goddard III, J. Chem. Phys. 97, 4309 (1992).
[16] A. M. Mathiowetz, A. Jain, N. Karasawa, and W. A. Goddard III, Proteins 20,
227 (1994).
[17] T. E. Cheatham III and P. A. Kollman, J. Mol. Biol. 259, 434 (1996).
[18] J. Norberg and L. Nilsson, Biophys. J. 69 2277 (1995).
[19] A. D. MacKerrell, Jr., J. Wiorkeiwicz-Kuczera, and M. Karplus, J. Am. Chem.
Soc. 117, 11946 (1995).
Chapter 3
Free Energy Analysis for DNA Base
Stacking
Katsumi Murata, Yuji Sugita, and Yuko Okamoto, “Free energy
calculations for DNA base stacking by replica-exchange umbrella
sampling,” Chemical Physics Letters 85, 1-7 (2004).
Katsumi Murata, Yuji Sugita, and Yuko Okamoto, “Molecular
dynamics simulations of DNA dimers based on replica-exchange
umbrella sampling. II. Free energy analysis,” Journal of
Theoretical and Computational Chemistry, in press.
3.1 Introduction
In this Chapter we present the results of the PMF calculations of DNA dimer systems
from 10 ns MD simulations based on the replica-exchange umbrella sampling (REUS)
[1]. In Chapter 2, we gave the details of the simulation protocol and confirmed that the
REUS simulation indeed performed properly. It was suggested from the analysis of the
pseudorotation phase angles that the DNA dimers take the B-DNA structure. In this
chapter we try to give more quantitative arguments based on free energy analysis
3.2 Methods
As explained in detail in Chapter 2, the REUS simulation was performed at T = 300K
with the umbrella potentials in Eq. (2.10) (the umbrella potentials are functions of the
reaction coordinate R only). Hence, only the replica exchange of umbrella potentials was
performed. The potentials of mean force (PMF) WT,λ={0}(R) and WT,λ={0}(X), or free
energy as a functions of the reaction coordinates R and X, respectively, of the original,
unbiased system at temperature T are given by
WT,λ={0}(R) = −kβTln
X
E0
PT,λ={0}(E0, R)
, (3.1)
and
WT,λ={0}(X) = −kβTln
X
E0
PT,λ={0}(E0, X)
, (3.2)
where PT,λ={0}(E0, R) and PT,λ={0}(E0, X) are the probability distributions in the absence
of the restraining potentials as shown by {0} = (0,...,0). The probability distribution
PT,λ(E0, R) for any λ is given by solving the following WHAM equations [2, 3]:
PT,λ(E0, R) =
M
P
m=1g
−1
m Nm(E0, R) M
P
m=1g
m−1nmefm−βEλm
e−βEλ, (3.3)
and
e−fm = X
E0,R
PT,λm(E0, R). (3.4)
The probability distribution PT,λ={0}(E0, X) is also given by the same set of equations
where R in Eqs. (3.3) and (3.4) is replaced by X. Here, g−1m = 1+2τm, and τm is
the integrated autocorrelation time at temperature T with parameter value λm. For
biomolecular systems, the results obtained from the WHAM equations are insensitive to
the value of gm in Eq. (3.3) [3]. Hence, we set gm = 1 in the present study. Note that the
unnormalized probability PT,λ(E0, R) and the ”dimensionless” Helmholtz free energy fm
in Eqs. (3.3) and (3.4) are solved self-consistently by iteration [2, 3]. The two-dimensional
PMF WT,λ={0}(R, X) (i.e., free energy as a function of the reaction coordinates R and X,
of the original, unbiased system at temperature T ) is also given by
WT,λ={0}(R, X) = −kβTln
X
E0
PT,λ={0}(E0, R, X)
, (3.5)
where PT,λ={0}(E0, R, X) is the probability distribution in the absence of the restraining
potentials. The probability distribution PT,λ(E0, R, X) for any λ is also given by solving
the following WHAM equations:
PT,λ(E0, R, X) =
PM m=1g
−1m Nm(E0, R, X)
M
P
m=1g
m−1nmefm−βEλm
e−βEλ, (3.6)
and
e−fm = X
E0,R,X
PT,λm(E0, R, X). (3.7)
3.3 Results and Discussion
We performed potential of mean force calculations for all the 16 possible DNA dimers to
explore the stacking-unstacking process. As reaction coordinates we chose the distance
R between the glycosidic nitrogen atoms and the pseudo dihedral angle X. They are
depicted in Fig. 3.1. We firstly present in Fig. 3.2 the PMF profiles along the distance
R obtained by the REUS simulations for all the DNA dimers. The shapes of the PMF
profiles level at R = 8.0 - 11.0 ˚A for all the DNA dimers. However, the distance R
where the PMF has a minimum is at varience. Fig. 3.2(a) implies that the PMF has a
minimum at R = 4.0 - 4.2 ˚A for the dApdA, dApdC, dApdG, and dApdT dimers (they
all have adenine in 5′ position). The PMFs of the dApdA and dApdG (purine-purine)
dimers increase more gradually than those of the dApdC and dApdT (purine-pyrimidine)
dimers. As shown in Fig. 3.2(b), the PMF has a minimum at R = 4.0 or 4.1 ˚A for the
dCpdA, dCpdC, dCpdG, and dCpdT dimers (they all have cytosine in 5′ position). The
dCpdG dimer has a minimum that is broader than the other dimers. For the dGpdA and
dGpdG dimers (purine-purine) the PMFs increase more gradually than for the dGpdC and
dGpdT (purine-pyrimidine) dimers, as shown in Fig. 3.2(c). The PMF has a minimum
at R = 4.6 ˚A for the dGpdA dimer and at R = 4.0 - 4.2 ˚A for the dGpdC, dGpdG, and
dGpdT dimers. Rather broad minima were also observed for the dGpdA and dGpdG
dimers. Fig.3.2 (d) implies that the PMF has a minimum at R = 4.1 or 4.2 ˚A for the
dTpdA, dTpdC, dTpdG, and dTpdT dimers (they all have thymine in 5′ position).
(a)
O O
O3' C5' O5'
P C5'
O5' O
O O3'
N
N R
(b)
C1' N
X
C1' N
Figure 3.1: (a) Definition of the reaction coordinate R, which is the distance between the base glycosidic nitrogen atoms. (b) Definition of the reaction coordinate X, which is the pseudo dihedral angle (N-C1′-C1′-N).
The PMFs of the dTpdA and dTpdG (pyrimidine-purine) dimers increase more gradu-
ally than those of the dTpdC and dTpdT (pyrimidine-pyrimidine) dimers. As a whole, the
PMFs of the purine-purine dimers increase more gradually than those of purine-pyrimidine
dimers, and the PMFs of the pyrimidine-purine dimers increase more gradually than those
of the pyrimidine-pyrimidine dimers. We also saw that the range of the distance R where
the PMF has a minimum is 4.0 - 4.6 ˚A. Except for the dGpdA dimer (4.6 ˚A), these values
(4.0 - 4.2 ˚A) are closer to the value of the canonical B-DNA (4.4 ˚A) than that of the
canonical A-DNA (4.8 ˚A), both of which were generated by the AMBER nucgen module
[4].
(a) (b)
0 1 2 3 4 5 6 7 8 9
4 6 8 10 12
R
W(R) [kcal/mol]
0 1 2 3 4 5 6 7 8 9
4 6 8 10 12
W(R) [kcal/mol]
R
(c) (d)
0 1 2 3 4 5 6 7 8 9
4 6 8 10 12
W(R) [kcal/mol]
R
0 1 2 3 4 5 6 7 8 9
4 6 8 10 12
W(R) [kcal/mol]
R
Figure 3.2: The PMF profiles along the reaction coordinate R obtained from the REUS simulation. (a) The solid, short-dashed, dashed, and dotted curves correspond to the results for dApdA, dApdC, dApdG, and dApdT, respectively. (b) The solid, dashed, short-dashed, and dotted curves correspond to the results for dCpdA, dCpdC, dCpdG, and dCpdT, respectively. (c) The solid, short-dashed, dashed, and dotted curves correspond to the results for dGpdA, dGpdC, dGpdG, and dGpdT, respectively. (d) The solid, short- dashed, dashed, and dotted curves correspond to the results for dTpdA, dTpdC, dTpdG, and dTpdT, respectively.
Here, we defined the stacking stability as the difference of free energy between the
stacked state (R = 4.0 - 6.0 ˚A) and the unstacked state (R = 8.0 - 10.0 ˚A) for each dimer.
Thus the free energy difference between stacked and unstacked states was calculated by
∆W =
Z 6.0
4.0 W(R)dR −
Z 10.0
8.0 W(R)dR (3.8)
where W (R) is the potential of mean force along the reaction coordinate R. The values
of ∆W for all DNA dimers are listed in Table 3.1, where the trapezoidal rule was used
for the integral in Eq. (3.8) with the bin size of 0.1 ˚A.
Table 3.1: The free energy difference ∆W (kcal/mol) between stacked and unstacked states.
Dimer ∆W Dimer ∆W Dimer ∆W Dimer ∆W
Pu-Pua dApdA -5.1 dApdG -4.3 dGpdA -5.1 dGpdG -4.5
Pu-Py dApdT -3.4 dApdC -3.3 dGpdT -4.8 dGpdC -3.8
Py-Pu dTpdA -5.8 dTpdG -5.0 dCpdA -4.3 dCpdG -4.4
Py-Py dTpdT -3.3 dTpdC -3.5 dCpdT -3.3 dCpdC -3.2
a Pu and Py stand for purine and pyrimidine, respectively.
∆W of the dimers containing adenine in 5′ position follows the stability order dApdA
(Pu-Pu) > dApdG (Pu-Pu) > dApdT (Pu-Py) > dApdC (Pu-Py), where Pu and Py
stand for purine and pyrimidine, respectively. Pu-Pu dimers are more stable than Pu-
Py dimers. This suggests that the increased van der Waals contacts contribute to the
stability of the stacked states, because purines have more heavy atoms than pyrimidines.
This finding is applicable to the other dimers except for the dimers containing guanine
in 5′ position. Namely, ∆W of the dimers containing cytosine and thymine in 5′ position
follows the stability order dCpdG (Py-Pu) > dCpdA (Py-Pu) > dCpdT (Py-Py) > dCpdC
(Py-Py) and dTpdA (Py-Pu) > dTpdG (Py-Pu) > dTpdC (Py-Py) > dTpdT (Py-Py),
respectively, and for the dimers containing guanine in 5′position, ∆W follows the stability
order dGpdA (Pu-Pu) > dGpdT (Pu-Py) > dGpdG (Pu-Pu) > dGpdC (Pu-Py).
In all cases there are trends that the stacking stability for thymine (dT)-containing dimers
is relatively high as shown in Table 3.1. This supports the results of thermal denaturation
experiments that showed that the C-5 methyl group of thymine in DNA enhances the
stacking of helical DNA and RNA complexes [5].
From the results in Table 3.1, we can summarize the rank order of the dimer stability as
follows: Pu-Pu > Pu-Py or Py-Pu > Py-Py. We see that this rank order of the dimer
stability in our calculations is qualitatively in agreement with the experiments [6-11].
Note that the stacking free energies measured by these experiments are considerably at
variance. For instance, the variations for the AA dimer (including base, nucleoside, and
nucleotide forms) are from -1.2 kcal/mol [9] to -5.7 kcal/mol [11] in determinations of the
1M standard state stacking free energy. However, there is a consistency in the rank order
between our results and the experiments.
In the ab initio calculations the base-base interaction energy most favorable for stacking
has been observed for the GG dimer and the least favorable base-base interaction energy
has been seen for the UU dimer [12]. The rank order of the base-base interaction energy
is again qualitatively in agreement with that of the stacking free energy of our results
except for the AA dimer.
In Fig. 3.3 we present the PMF profiles along the pseudo dihedral angle X obtained by
the REUS simulations for all the DNA dimers. The shapes of the PMF profiles of all the
DNA dimers are asymmetric in X and level at two regions (X = -180 - -60◦ and X = 120
- 180◦). The asymmetry presumably originated from the structural difference between 5′
and 3′ bases. The PMF is the lowest at X = 10 - 40◦ for all the DNA dimers. These
values are closer to the value of the canonical B-DNA (29◦) than the canonical A-DNA
(-15◦). We observe a rapid rise in the PMF profiles when X increases in the positive
direction from the lowest states with X = 10 - 40◦ except for the dApdA dimer. On
the other hand, the free energy rises gradually as X decreases in the negative direction.
Another local free energy minimum is observed at X = -30 - -10◦ for the thymine (dT)-
containing dimers except for the AT dimer (i.e., the dCpdT, dGpdT, dTpdA, dTpdC,
dTpdC, and dTpdT dimers). These values almost correspond to the value of the canonical
A-DNA (-15◦). Note that any restraining potentials along the angle X were not added in
the REUS simulations. It is remarkable that the present REUS sampled a wide pseudo
dihedral angle X space including both A-DNA and B-DNA regions without introducing
any restraining umbrella potentials in X.
(a) (b)
0 1 2 3 4 5
-180-150-120 -90 -60 -30 0 30 60 90 120 150 180 X [degree]
W(X) [kcal/mol]
0 1 2 3 4 5
-180-150-120 -90 -60 -30 0 30 60 90 120 150 180
W(X) [kcal/mol]
X [degree]
(c) (d)
0 1 2 3 4 5
-180-150-120 -90 -60 -30 0 30 60 90 120 150 180
W(X) [kcal/mol]
X [degree]
0 1 2 3 4 5
-180-150-120 -90 -60 -30 0 30 60 90 120 150 180 X [degree]
W(X) [kcal/mol]
Figure 3.3: The PMF profiles along the reaction coordinate X obtained from the REUS simulation. (a) The solid, short-dashed, dashed, and dotted curves correspond to the results for dApdA, dApdC, dApdG, and dApdT, respectively. (b) The solid, dashed, short-dashed, and dotted curves correspond to the results for dCpdA, dCpdC, dCpdG, and dCpdT, respectively. (c) The solid, short-dashed, dashed, and dotted curves correspond to the results for dGpdA, dGpdC, dGpdG, and dGpdT, respectively. (d) The solid, short- dashed, dashed, and dotted curves correspond to the results for dTpdA, dTpdC, dTpdG, and dTpdT, respectively.