Construction of New Infrared Reflection Absorption
Spectroscopy (IRRAS) System for Solid-Solution
Interface Biomaterials
Md. Abu Sayed
Doctor of Philosophy
Department of Structural Molecular Science
School of Physical Science
The Graduate University of Advanced Studies
2009
To
(Prof. T. Urisu, SOKENDAI, Japan,
Prof. M. Huque, BUET, Bangladesh & Prof. C. M. Mustafa, RU, Bangladesh)
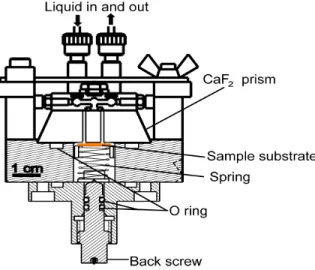
Fig. 1 Schematic diagram of the sample holder for solid-solution interface IRRAS measurement.
Abstract
The study of protein–surface interactions represents one of the most important topics in the field of biomaterials. The immobilization of proteins on solid surfaces is an important step in biosensor fabrication as well as medical devices. Infrared spectroscopy is a powerful technique for the determination of conformation and orientation of lipids and proteins including membrane proteins, and of antibody-antigen reactions on solid surfaces. Infrared reflection absorption spectroscopy (IRRAS) is one of the FT-IR techniques for determination of biomaterials on IR reflective metals, and very few IRRAS systems are found to determine the adsorbate at solid-solution interfaces.
For my doctoral research work, I have constructed a new narrow gap infrared reflection absorption spectroscopy (NG-IRRAS) system with a prism/narrow solution layer/substrate arrangement, to which substrates for biosensors and biochips can be directly attached. Advantages of this new NG-IRRAS system over other conventional-IR systems are i) different IR reflective materials can be used as a substrate ii) having a sufficient large gap (~8 µm ) to flow reagent solution, and iii) a solution injection system is included to introduce reagent solution onto the sample substrate from outside. Another advantage of this IRRAS system is that this system can easily be rearranged to vacuum IRRAS system. There were two problems to be solved for the standardization of this NG-IRRAS system, i) the baseline was fluctuated due to the change of solution layer thickness, and ii) sample biomaterials was adsorbed on prism surface.
In the first stage of my PhD work, I constructed the new NG-IRRAS system and investigated the conditions for the flat and stable baseline. Firstly, it was found that baseline was fluctuated due to the change of solution layer thickness. I developed a new sample holder for controlling the solution layer thickness between the prism and substrate surfaces (Fig. 1). Thermal effects, adsorbed water on the entrance of optical components, bubbles in solution, and injection flow rate were considered as factors which distorted the baseline. I have investigated the experimental conditions and found that the following procedures are crucial for the
stability of the baseline: i) evacuation of the sample chamber at least for 6 h was necessary to minimize the adsorbed water vapor effect, ii) injection flow rate was kept less then 2 mL/h, iii) room temperature fluctuation was controlled within 1°C, and iv) Ni spacer thickness was 8 µm.
After the standardization of the NG-IRRAS, I started the IRRAS measurement of solid surfaces in
adsorbed at the interface between the sample substrate and solutions. Two IR-reflective substrates, Si wafer with buried metal layer (BML) and gold were used. iii) The observation of adsorbed biomaterials on the solid surface in vacuum.
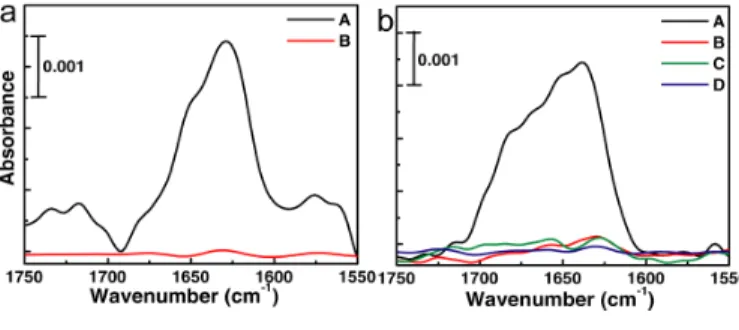
Fibronectin (FN) and immunoglobulin G (IgG) were selected for observation at solid-solution interface. But, during the experiments, IR absorbance from the adsorbed biomaterials on the prism surface overlapped the IRRAS spectra of the biomaterials on the sample substrate. Thus, I controlled the adsorption of biomaterials on the prism surface by regulating the effects of salt and pH of the solution and by coating the CaF2 prism with 2-methoxy-(polyethylene) oxypropyltrimethoxysilane (PEG). Interestingly, the adsorption tendency on the prism surface was completely opposite with salt effects between these two biomaterials (Fig. 2).
FN is easily adsorbed on SiO2
surface and often used as an extra cellular matrix in the cell culture on SiO2 substrates. Therefore, FN was chosen in this work to detect at BML- solution interface. I have investigated the condition, in which FN adsorbed only on the BML surface, but not on the PEG-coated prism surface. I found that FN adsorbed on the prism surface in D2O based phosphate buffered saline (PBS) solution, but ignorable adsorbed FN was found on the PEG-coated prism
surface when pure D2O was used in the experiment (Fig. 2a).
The IRRAS of adsorbed FN was observed at BML-D2O interface using this condition. The protein amide I band appear in the range of 1600 – 1700 cm-1 assigned to the C=O stretching. The fine structure in the amide I supplies the information of the protein secondary structure, because the peak shift of υ (C=O) due to the hydrogen bonding characteristics of the secondary structure, e.g. υ (C=O) of β-sheet at 1613 -1638 cm-1, α-helix at 1645 - 1657 cm-1 , and β-turn at 1662 -1683 cm-1. The amide I band of FN was observed at approximately 1637 cm-1 (β sheet) with shoulders around 1671 and 1683 cm-1 (β turn) (Fig. 3a). The ignorable conformational change of FN was found due to the adsorption on BML-D2O interface.
Immobilization of IgG on gold is an active research field for designing immunosensor for medical diagnostic purpose. The adsorption state of the IgG at the gold-solution interface was investigated by the NG-IRRAS. IgG was adsorbed on gold surfaces i.e. coated by the 16-mercaptohexadecanoic acid (MHA)-SAM and by the MHA-SAM activated by N-(3-dimethylaminopropyl)-N’-ethylcarbodiimide hydrochloride (EDC) and N-hydroxysuccinimide (NHS). It was also found that IgG was easily
Fig. 2 The amide I bands of adsorbed proteins on a PEG- coated prism surface measured with the total internal reflection (TIR) arrangement.
a) Spectra of FN using (A) D2O-based PBS solution and (B) pure D2O as solvents,
b) Spectra of IgG using (A) pure D2O, (B) NaCl (140 mM) D2O solution, (C) D2O-based PBS solution and (D) NaCl- added (140 mM) D2O-based PBS solution as solvents.
CaF2 surface was suppressed sufficiently in NaCl/D2O (140 mM) and D2O based PBS solutions (Fig. 2b). I chose D2O based PBS solution containing 140 mM NaCl for IRRAS measurement of IgG at the gold-solution interface. The IR spectra showed that IgG easily adsorbed on the MHA-SAM coated and activated-MHA-SAM coated gold surfaces. The conformation change of the IgG adsorbed on the MHA- SAM coated gold surface was
ignorable when the IRRAS spectrum was compared with the FT-IR spectra of IgG dissolved in solution. Absorption spectra at the amide I band region of the IgG in the solution phase and at the solid-solution interface were measured with good reproducibility. The amide I band of the IgG molecule covalently bonded to the MHA-SAM (Fig. 3b) was quite similar to that of the IgG on the MHA-SAM coated gold surface. The covalent bond is formed between the COOH-terminated MHA- SAM and the lysine residue of the IgG. Because of lysine residue distributes almost homogeneously on the IgG surface, the covalently bonded IgG had random orientation similar to the physisorbed IgG on MHA-SAM coated gold surface.
After the solid-solution interface IRRAS experiments, the same substrates were examined in the vacuum IRRAS. The amide I band shape was significantly different from that in the solution for both FN and IgG. This change of amide band is due to the denaturation of the proteins during the removal of water from the substrate surface.
As a whole, I have succeeded for the first time in constructing a new NG-IRRAS system having 8 µm gap to flow reagent solution for monitoring the chemical reaction. A specially designed sample holder is used to keep the gap constant during the injection of the reagent solution within a certain injection speed. Adsorption of proteins on the prism surface, which interferes with precise measurement, is suppressed using PEG-coating of the prism surface and controlling the solution pH and the effects of the salt. The amide I bands of the IgG molecules dissolved in the solution and covalently bonded to the COOH-terminated SAM surface at solid-solution interface have been clearly recorded for the first time. This new IRRAS instrument can be easily applicable in the characterization Fig. 3 The amide I bands of adsorbed proteins at solid-solution interface observed by the new NG-IRRAS.
a) Spectra of FN using pure D2O as the solvent.
b) Spectra of IgG using NaCl (140 mM) added D2O based PBS solution.
A) Spectra for protein injection and waiting 3 h (FN) and 30 min (IgG) for adsorption on solid surfaces,
Spectra were taken every after 0.5 ml D2O solutions flushes; B) 0.50 ml C) 1.0 ml D) 1.5ml E) 2.0 ml, and F) 2.5 ml.
Contents
1 Introduction ...01
1.1 General principle of protein-solid interaction in aqueous solution...……...01
1.2 Studies on protein adsorption at solid-solution interfaces………..04
1.3 Purpose and brief summary of this study...….………07
References………...09
2 Surface selection rule and principle of narrow gap solid-solution
interface IRRAS………..12
2.1 Fourier-transform infrared spectroscopy at solid-solution interface…….…………...………..12
2.2 Surface selection rules for IRRAS………...………...14
2.3 Incident angle calculation………...15
2.4 Principle of solid-solution interface IRRAS………...17
References……….20
3 Construction of new narrow gap infrared reflection
absorption spectroscopy (NG-IRRAS)……….21
3.1 Introduction……….21
3.2 New narrow gap infrared reflection absorption spectroscopy configuration and construction………....23
3.3 Rearrangement of NG-IRRAS system to vacuum IRRAS……….28
3.4 Technical problems of the new NG-IRRAS system………...29
3.5 Summary……….30
References………...………..30
4 Experimental : details with materials and methods………. …32
4.1 Sample substrate cleaning………....………..32
4.1.1 Cleaning of BML-substrate………..………..32
4.1.2 Cleaning of gold substrate………….……….33
4.2 Materials and sample preparation………...………33
4.3 Prism surface cleaning and PEG coating on prism bottom surface……...…….34
4.4 preparation and activation of MHA-SAM on gold surface………35
4.5 Immobilization of FN and IgG ……….………….37
References……….………37
5 Origins of baseline distortions and their removal…….………39
5.1 Introduction...……….………39
5.2 The characteristic of IR power spectra of the NG-IRRAS system……….39
5.3 Baseline characteristics ……….………….41
5.3.1 Thermal effects on solution layer thickness……….………….41
5.3.2 Injection flow speed effects on the solution layer thickness……….42
5.3.3 Base line fluctuation due to air bubble in injected solutions…...………….44
5.3.4 Baseline fluctuations due to the adsorbed water on optical systems...…….45
References….………47
6 Application of new NG-IRRAS system for observation of
solid-solution interface biomaterials..…….………...48
6.1 Abstract………..……….48
6.2 Introduction………...………49
6.3 New NG-IRRAS system……….50
6.3.1 Design of IRRAS measurement system………...……….50
6.3.3 UV ashing……….………51
6.4 Materials……….52
6.4.1 Sample preparation……… 52
6.4.2 Treatment of the substrate surface………..………..52
6.4.3. Treatment of the prism surface………53
6.5. IRRAS measurement……….53
6.5.1. Baseline characteristics………53
6.5.2. Protocol of the IRRAS measurements……….54
6.6 Control of the salt effects………56
6.7 IRRAS measurement of FN on BML surface……….58
6.8 IRRAS measurement of IgG on SAM-coated gold surfaces…..………60
6.9. Summary………...……….62
References………...………..64
7 Summary……….………..66
Appendixes……….………..70
List of publications……..………..………..78
Chapter 1
Introduction
1.1 General principle of protein-solid interaction in aqueous solution
Spontaneous adsorption of protein at solid-solution interfaces has been extensively studied [1-54]. Protein interactions with solid surfaces involve a complex interplay of van der Waals force, hydrogen bonding, electrostatic force and hydrophobic interaction [8]. Previous studies of protein adsorption on solid surfaces showed that both hydrophobic and electrostatic interactions determine the amount of the adsorbed protein [9] and that the effect of the electrostatic interaction becomes more important when the adsorption is performed at low ionic strength where the screening effect of added salts is weakened [10].
Adsorption of protein at a solid-solution interface is not only dependent on the protein but also strongly influenced by the chemical and physical properties of the interface. In protein adsorption studies, various kinds of materials are used such as oxides, polymers, metals and minerals. On a hydrophobic surface, proteins strongly adsorbed with high surface coverage and with conformational change [11, 12]. To study the effect of surface chemistry on the degree of protein adsorption, the preparation of self-assembled monolayers (SAMs) provides an efficient way [13].
A general illustration of protein adsorption process at solid-solution interface is shown in Figure 1.1. This protein adsorption process can also be explained by the following equilibrium equations [14]
Protein (P) reversibly adsorb on the active site of the surface (S) with a concentration (P · S) from the solution with the reaction rate of kf and kr constants for the forward and
Figure 1.1 Schematic of the protein adsorption process at solid-aqueous solution interface [14].
P = concentration of protein in aqueous solution S = concentration of active site of the surface
P · S = concentration of reversibly adsorbed protein on the active site of the surface P · S = concentration of irreversibly adsorbed protein on the active site of the surface kf = forward reaction rate constant of reversible adsorption
kr = reverse reaction rate constant of reversible adsorption ki = irreversible reaction rate constant of irreversible adsorption
kf
kr
P · (m + n) H2O + S · (r + υ) H2O P · S · (n + υ) H2O + (m + r) H2O ………(1)
P · S + (n+ υ) H2O………..(2) ki
P · S · (n + υ) H2O
reverse reactions, respectively (eq. (1)). is the concentration of irreversibly adsorbed protein on the active site of the surface with reaction rate constant of ki for the transition of the reversibly adsorbed protein form to an irreversible bound state. Water molecules in or on the protein are released to bulk solution at various stages during the adsorption on surface.
A surface becomes saturated with the adsorbed protein if sufficient interaction time is provided because of the irreversible step of protein adsorption process (eq.(2)). The adsorbed protein layer is assembled on the surface through protein–surface and protein– protein interactions. In the protein adsorption process on the protein saturated surface, the irreversible step of the protein adsorption is decreased by the steric restrictions of the previously adsorbed protein due to the hydration shell on the protein. Thus, the proteins additionally adsorbed on the saturated protein layer were found in native and possibly in the reversible adsorbed state [15]. This behavior is frequently observed. A fraction of protein is found to desorb from an adsorbed protein layer during the following exposure of the surface to pure buffer solution while another fraction of the protein layer remains irreversibly adsorbed to the surface.
When a protein solution and a solid surface come in contact with each other, then the protein starts to absorb on the surface until saturation. In case of a hydrophobic surface, the protein is absorbed on its hydrophobic region. The protein unfold and spread its hydrophobic core over the surface owing to the thermodynamic driving force to reduce the net hydrophobic surface area of the system exposed to the aqueous solvent [16]. On hydrophilic surfaces, the protein adsorption is mainly dominated by the electrostatic interaction caused by the charged and polar functional groups of the protein surface [16]. The protein adsorption processes stop on the surface at the monolayer coverage, and then the further adsorption of protein induced by protein-protein interactions. The final organization of the adsorbed protein layer depends on the chemical and physical properties of the protein, the surface, and the aqueous solution, and the thermodynamics of the interactions between these system components [17]. Agnihotri and Siedlecki used
P · S
differences in fibrinogen adsorbed to hydrophilic (mica) and hydrophobic (graphite) surface [18]. In this study, four different orientational states of fibrinogen were observed on each surface. The height of the adsorbed protein on the hydrophobic surface decreased with time to a plateau value of ~1.0 nm, while the height increased to a plateau value of
~2.1 nm with time on the hydrophilic surface. And it was also observed that the AFM tip did not tend to move the protein on the hydrophobic surface, which indicates tight bounding between the protein and the hydrophobic surface.
1.2 Studies on protein adsorption at solid-solution interfaces
Protein adsorption on solid inorganic surfaces has received considerable interest in the research area for biosensor. Protein immobilization is not only carried out on flat bulk surfaces but also on nanoparticle surfaces [19-22, 42-44, 48-54]. Silicon and gold were extensively used in biomaterials research for their inactive characteristics; a few representative examples are introduced in this section.
Silicon is an excellent substrate material for biosensor devices, since advanced micro- fabrication technologies can be applied to integrate biosensors in electronic devices [23]. Silicon surface is covered by a native or an artificial silica layer, and various kinds of surface modification techniques have been used for the protein immobilization, e.g. hydrophilicity control [24], SAM formation [12], and grafting of ligand molecules such as biotin [25, 26]. The adsorption state of fibronectin (FN) on silica surface is an important issue, because FN coating is used as an extra cellular matrix for cell ion channel current measurement [27]. Human plasma FN absorption was studied on bare hydrophilic silica and a methylated hydrophobic silica surface [22]. In this experiment, on the hydrophilic silica surfaces 70% of the adsorbed FN molecules had an elongated structure with partial intramolecular chain interactions, compared to the FN molecules adsorbed on the methylated SiO2 surfaces. Zangooie et al. investigated the adsorption of human serum albumin and fibrinogen on thermally oxidized porous silicon surface, which were used either as prepared or were hydrated in a deionized water bath prior to their use. The volume percentage of the adsorbed albumin decreased from 24% to 13%
due to the hydration and the amount of the adsorbed fibrinogen depending on the concentration in the solution [28]. Site-directed fluorescence labeled protein and silica nanoparticle were used to study protein-silica interaction [19]. In this report the author showed that the protein adsorption on silica nanoparticles is strongly pH-dependent; the adsorption is directed by positively charged areas on the protein surface toward the negatively charged silica surface. Lundqvist et al. investigated the influence of the silica particle curvature on the adsorption of Human carbonic anhydrase I (HCAI), and found that particles with a larger diameter lead to stronger particle-protein interaction. Testing of SiO2, TiO2 and polystyrene particles with various degree of surface carboxylation, together with protein and polyethylene glycol surface coatings, showed that cellular associations and protein binding both strongly depend on the particle surface chemistry [29].
Adsorption of proteins on solid surfaces was investigated from both view points of adsorbed amount and conformational changes. The AFM [30, 31] and radiolabelling [32, 33] techniques can be used to get information of individual protein molecules on surfaces. AFM and X-ray at grazing incidence angles strongly showed that globular protein GlnB- Hs deposited on Si (111) by spin-coating forms circular 100 nm to 150 nm wide face-up donut shaped protein aggregates [34]. GlnB-Hs protein crystal domains formed along perpendicular direction on Si surface during the spin coating and these domains could play a role on nucleation for crystal growth and stimulate crystallization of reluctant proteins. The electrostatic interaction between proteins and substrate surfaces was studied using a positively charged SAM of 3-aminopropyl-triethoxysilane (APTES) layer and moderately negative ferritin, Fer-4 (horse-spleen-ferritin L subunit lacking four amino acid residues from the N-terminus) and it was proven that protein adsorption density depends on the quantitative balance of surface charge on the substrate and protein [35]. A structural analysis of a monoclonal immunoglobulin G (IgG) adsorbed on variously modified silica surfaces (bare hydrophilic, methylated hydrophobic, and triblock- copolymer coated hydrophobic) was performed using attenuated total internal reflection
reflecting element [12, 36]. The adsorption-induced reduction in the β-sheet content in IgG was observed both on the methylated hydrophobic surfaces and on the bare hydrophilic silica surfaces, although the reduction degree is larger on the former surface [12]. However, such adsorption-induced deformation of IgG on the hydrophilic silica surface was not observed in ref. 36. IR reflection absorption spectroscopy (IRRAS) which selectively detect vibrational mode perpendicular to the surface indicated the uniform orientation of covalently immobilized avidin on a flat COOH-modified silica surface [25].
Gold is chemically and biologically inert metal, and especially important substrate materials for biosensors and biochips such as protein chips [37, 38] and DNA chips [39- 41]. Gold nanoparticles coupled with bimolecules have become increasingly important in the biological nanoprobe researches [42–44, 48-54]. A new method has been developed for the preparation of amine-terminated surfaces with a highly cross-linked Si–O–Si network sub-layer on gold substrates to bind avidin through biotin bond [45]. Terrettaz et al. showed that a matrix porin OmpF of is suitable for interaction with flat gold and semiconductor surfaces [40]. An efficient strategy for immobilizing proteins on a gold surface was developed by employing the gold binding polypeptide (GBP) [46, 47]. Antibody molecules immobilized on B5C1-thiol modified gold surface, and they bind to the corresponding antigen effectively with high orientation [46]. Antibody human IgG complexes were formed via thiol chemistry on 20-nm-thick gold islands, which deposited on the surface of IR-transparent Ge-containing chalcogenide glass films [47]. Gold nanoparticles, especially colloidal golds, are promising material for the surface- enhanced IR absorption spectroscopy (SEIRA) [48]. Immunolabeling efficiency of protein A to colloidal gold particles was studied by varying the particle diameter in the range of 5-16 nm in various protein concentrations [49]. The Cytochrome C (Cyt-c) coated gold nanoparticles were used as colorimetric sensor for the detection of protein conformational change, which is observed by surface plasmon resonance (SPR) at different pH [50]. An enormous and continuous SPR angle shift of the gold particles was observed when cytochrome b-562 is adsorbed on the nano gold surface [51]. The GBP
was also employed for the immobilization of proteins on a gold surface [52]. The conformational changes of cyclohexanethiol (CHT) on gold nanoparticles and on gold plate surfaces were investigated on molecular-scale by scanning tunneling microscope, and it was found that there were two axial and equatorial conformers in the CHT monolayer on an Au (111) surface as meta-stable conformers [53]. Triulzi et al. studied the effect of laser radiation to the amyloid β (Aβ) conjugate-gold nanoparticles and reported that monofunctional gold nanoparticles coupled which Aβ conjugates destroyed the aggregates of Aβ by the photothermal ablation [54].
1.3 Purpose and brief summary of this study
The adsorption of protein on the surfaces and the conformational changes due to the adsorption have been characterized and monitored using various techniques, as described in the previous section. IR spectroscopy is a powerful method to detect the structural change of the adsorbed proteins. Several IR techniques have been used to observe the protein at different conditions, such as in water, at the air-water interface, on solid surfaces, and at solid-solution interface. IR-transparent materials were generally used in the previous IR studies at solid-solution interfaces, and there are very few IR systems for the adsorbate or biomaterial reaction at the interface between IR-non-transparent materials and solutions. An aqueous solution layer is necessary on the non-transparent solid surface to observe biomaterials at the solid-solution interface. But water has strong absorptivity in the IR region and water layer causes a significant noise of the baseline. This is the reason that very few number of IRRAS experimental configuration have been reported. In the reported narrow gap IRRAS (NG-IRRAS), the solution layer is too thin (1~2 µm) for monitoring chemical reactions, and it is not easy to increase this layer thickness and inject solutions. Injections of a reagent solution into the narrow solution layer easily change the solution layer thickness, which causes a significant distortion of the baseline. Therefore, I have constructed a new IRRAS system having 8 µm gap for the
nanometer level fluctuation.
In chapter 2, principle for narrow gap solid-solution interface IRRAS (NG-IRRAS) and the surface selection rule are described. The IR incident angle on CaF2 prism surface is calculated using the H2O refractive index at CaF2/H2O interface to avoid total internal reflection.
The construction process of the NG-IRRAS is presented in chapter 3. The detailed construction steps using a JEOL JIR-7000 FT-IR spectrometer and a home built sample chamber system are described. The structure of sample holders for the IRRAS measurement at solid-solution interface studies and in vacuum are described.
Chapter 4 is the experimental section of this thesis. In this section, the cleaning protocol of the silicon substrate with a buried metal layer (BML) and of gold substrates and solution preparation methods are described. The detail about the surface modification of a CaF2 prism base with 2-methoxy-(polyethylene) oxypropyltrimethoxysilane (PEG), and the formation and activation of 16-mercaptohexadecanoic acid (MHA)-SAM on the gold surface are depicted.
In chapter 5, the origins of the baseline distortions and their removal are described. The effects of temperature, solution injection flow, and adsorbed water on optical components on baseline are explained. Optimization of every factor is discussed briefly. In chapter 6, the application of this new NG-IRRAS is presented. In this section, protein adsorption on the CaF2 prism surface and the prevention of the adsorption by PEG-coating and the effects of the solution pH and salt concentration are described. The amide I bands of the IgG molecules dissolved in the solution, and the IgG covalently bonded to the COOH-terminated SAM surface are circumstantially discussed.
Chapter 7 is the summary of this thesis.
References
[1] Y. Ikada, Adv. Polym. Sci. 57 (1984) 103.
[2] E. R. Baier, E. A. Meyer, R. J. Natiella, R. R. Natiella, M. J. Carter, J. Biomed. Mater. Res. 18 (1984) 337.
[3] M. Malmsten (ed.), Biopolymers at interfaces, Marcel Dekker, New York (2003). [4] A. Baszkin and W. Norde (eds.), Physical chemistry of biological interfaces, Marcel Dekker, New York (2000).
[5] T. A. Horbett and J. L. Brash (eds.), Proteins at interfaces II, American Chemical Society, Washington, DC (1995).
[6] J. L. Brash and T. A. Horbett (eds.), Proteins at interfaces, American Chemical Society, Washington, DC (1987).
[7] J. D. Andrade (ed.), Surface and interfacial aspects of biomedical polymers, Vol. 1 and 2, Plenum Press, New York (1985).
[8] H. Elwing, S. Welin, A. Askendal, R. U. Nilsson, J. I. Lindstrom, J. Colloid Interface Sci. 119 (1987) 203.
[9] W. Norde, Adv. Colloid Interface Sci. 25 (1986) 267.
[10] J. L. Ortega-Vinuesa, M. J. G´alvez-Ruiz, R. Hidalgo-Alvarez, Langmuir 12 (1996) 3211.
[11] S.-S. Cheng, K. K. Chittur, C. N. Sukenik, L. A. Culp, and K. Lewandowska, J. Colloid Interface Sci., 162 (1994) 135.
[12] J. Buijs, and W. Norde, Langmuir 12 (1996) 1605.
[13] K. L. Prime and G. M. Whitesides, Science 252 (1991) 1164.
[14] W. Norde, C. A. Haynes, Reversibility and the mechanism of protein adsorption. In Proteins at Interfaces II. Fundamentals and Applications; Horbett, T.A., Brash, J.L., Eds.; American Chemical Society: Washington, DC, (1995) 26.
[15] C. F. Wertz, M. M. Santore, Langmuir 18 (2002) 706. [16] C. F. Wertz, M. M. Santore, Langmuir 17 (2001) 3006.
[17] J. Talbot, G. Tarjus, P. R. Van Tassel, P. Viot, Colloids Surf. A. 165 (2000) 287.
[19] M. Karlsson, U. Carlsson, Biophys. J. 88 (2005) 3536.
[20] M. Lundqvist, I. Sethson, B.-H. Jonsson, Langmuir 20, (2004) 10639.
[21] J. C. Orendorff, A. Gole, K. Tapan, Sau, J. C. Murphy, Anal. Chem. 77 (2005) 3261. [22] J. Kneipp, H. Kneipp, W. L. Rice, K. Kneipp, Anal. Chem.77 (2005) 2381.
[23] M. Goryll, S. Wilk, G.M. Laws, T. Thornton, S. Goodnick, M. Saraniti, J. Tang, R.S. Eisenberg, Superlattice Microst. 34 (2003) 451.
[24] M. Bergkvist, J. Carlsson, S. Oscarsson, J. Biomed. Mater. Res. 64A (2003), 349. [25] N. Misawa, S.Yamamura, Y.-H. Kim, R. Tero, Y. Nonogaki, T. Urisu, Chem. Phys. Lett. 419 (2006) 86.
[26] Z. Liu, M. D. Amiridis, Surf. Sci. 596 (2005) 117.
[27] T. Urisu, T. Asano, Z.-L. Zhang, H. Uno, R. Tero, H. Junkyu, I. Hiroko, Y. Arima, H. Iwata, K. Shibasaki, M. Tominaga, Anal Bioanal. Chem. 391 (2008) 2703.
[28] S. U. Zangooie, R. Bjorklund, H. Arwin, Thin Solid Films, 313 (1998) 825. [29] M. Ehrenberg, J. L. McGrath, Acta Biomater. 1 (2005) 305.
[30] L. Haggerty, A. B. Watson, A. M Bateau, M. A. Lenhoff, J. Vac. Technol. B, 9 (1991) 1219.
[31] A. C. Siedleecki, J. S. Eppell, E. R. Marchant, J. Biomed. Mater Res. 28 (1994) 971. [32] M. S. Slack, A. T. Horbett, J. Colloid Interface Sci. 133 (1989) 148.
[33] M. S. Slack, A. T. Horbett, J. Colloid Interface Sci. 124 (1988) 533.
[34] A. F. Lubambo, E. M. Benelli, I. Mazzaro, F. Yokaichyia, C. Giles, P. Ce´sar de Camargo, Macromol. Symp. 245 (2006) 140.
[35] K. Yamada, S. Yoshii, S. Kumagai, I. Fujiwara, K. Nishsio, M. Okuda, N. Matsukawa, I. Yamashita, Jpn. J. Appl. Phys. 45 (2006) 4259.
[36] C.E. Giacomelli, M.G.Bremer, W. Norde, J. Colloid Interface Sci. 220 (1999) 13. [37] S. Watanabe, K.Usui, K. Tomizaki, K. Kajikaw, H. Mihara, Mol. Biosyst. 1(2005) 363.
[38] K.-Y. Park, M.-S. Kim, S.-Y. Choi, Biosens. Bioelectron. 20 (2005) 2111.
[39] S. Takenaka, K. Yamashita, M. Takagi, Y. Uto, H. Kondo, Anal. Chem. 72 (2000) 1334.
[40] Z. Wan, Y. Wang, S. S. Li, L. Duan, J. Zhai, Biochem. Mol. Biol. Int. 38, (2005) 399. [41] J. B. Fiche, A. Buhot, R. Calemczuk, T. Livache, Biophys. J. 92 (2007) 935.
[42] M. C. Daniel, D. Astruc, Chem. Rev.104 (2004) 293. [43] E. Katz, I. Willner, Angew. Chem. Int. Ed. 43 (2004) 6042. [44] C. M. Niemeyer, Angew. Chem. Int. Ed. 40 (2001) 4128.
[45] S. Terrettaz, W. P. Ulrich, H. Vogel, Q. Hong, L. G. Dover, J. h. Lakey, Protein Sci. 11 (2002) 1917.
[46] S. Kanno, Y. Yanagida, T. Haruyama, E. Kobatake, M. Aizawa, J. Biotechnol. 76 (2000) 207.
[47] C. Yu, A. Ganjoo, H. Jain, C. G. Pantano, J. Irudayaraj, Anal. Chem. 78, (2006) 2500. [48] A. J. Seelenbinder, W. C Brown, P. Pivarnik, G. A. Rand, Anal. Chem.71 (1999) 1963.
[49] L. Ghitescu, M. Bendayan, J. Histochem. Cytochem.11 (1990) 1523.
[50] S. Chah, M. R. Hammond, R. N. Zare, Chemistry & Biology, 12 (2005) 323.
[51] H. S. Zhou, S. Aoki, I. Honma, M. Hirasawa, T. Nagamune, H. Komiyam Chem. Commun. (1997) 605.
[52] T. J. Park, S. Y. Lee, S. J. Lee, J. P. Park, K. S. Yang, K.-B. Lee, S. Ko, J. B. Park, T. Kim, S. K. Kim, Y. B. Shin, B. H. Chung, S.-J. Ku, D. H. Kim, I. S. Choi, Anal. Chem. 78 (2006) 7197.
[53] S.-W. Joo, H. Chung, K. Kim, J. Noh, Surf. Sci. 601 (2007) 3196.
[54] R. C. Triulzi, Q. Dai, J. Zoub, R. M. Leblanc, Q. Gud, J. Orbulescu , Q. Huo, Colloids Surf. B 63 (2008) 200.
Chapter 2
Surface selection rule and principle of narrow gap solid-
solution interface IRRAS
2.1 Fourier-transform infrared spectroscopy at solid-solution interface
At solid-solution interfaces adsorption and desorption occur frequently. Adsorption and desorption are the fundamental processes of many phenomena such as dissolution, detergency, corrosion and corrosion inhibition, adhesion, flotation, chromatography etc. The adsorption-desorption equilibrium, kinetics and reaction mechanisms at the solid- solution interfaces are attractive scientific research targets. To understand the chemistry of surfaces in liquid environments, many experimental techniques including infrared spectroscopy are used for exploring the real time characteristics.
Fourier-transform infrared spectroscopy (FT-IR) is a powerful technique to analyze surface architecture and adsorbates on surfaces. This method has an advantage that the organic contents of biological samples can be analyzed without any modification or labeling. To understand the properties of adsorbed biomaterials on metal surfaces in different conditions, several IR-based techniques have been developed. The increasing importance of FTIR in surface science is due to the recent advancement of instrumentation in sensitivity and speed of measurements. Although the instrumental advances play an important role, understanding the origin of physical processes governing spectral detection and interpretation of vibrational spectra are also necessary.
FTIR spectroscopy has been widely used for the study of biomaterials on the solid surface under the vacuum condition [1-5]. There are two major IR experimental set-ups to study solid surface and adsorbates: attenuated total (internal) reflection (ATR-IR) and reflection absorption spectroscopy (RAS). Only limited numbers of IR [6-11] techniques are available for the investigation of adsorbate at the solid-solution interface.
ATR-IR is the most generally used technique to observe adsorbed biomaterials on IR- transparent metal surfaces under solution [8-11]. In the conventional ATR-IR, the IR beam is introduced into the prism and is incident on the surfaces of the prism at an angel greater than the critical angel of the total reflection. If the geometry of the experiment is correctly arranged, then multiple internal reflections occur as shown in Figure 2.1a. Kretschmann ATR configuration is also used as another total-reflection type IR technique (Figure 2.1b) [11]. These methods are highly sensitive, but only IR-transparent materials, for example SiO2, Ge, ZeSe, ZnS, KRS-5 and AMTIR (amorphous material transmitting infrared radiation) crystals are used as a substrate in the ATR technique. In ATR-IR, thick adsorbed sample can not be measured due to the limited penetration of evanescent IR wave at the crystal interface. The reported penetration depth of germanium is less then 1 µm [12].On the other hand, the IRRAS method gives high resolution and high sensitivity on the reflective metal surfaces [5, 13]. Only a few IRRAS systems were reported for observing adsorbate at solid-solution interface on non-transparent metal using very thin gap (1-2 µm) [6, 7].
Figure 2.1 Arrangement of the light path in ATR-IR systems a) Conventional ATR-IR, and b) Kretschmann ATR
a b
To overcome these disadvantages, I developed a new narrow gap reflection absorption spectroscopy (NG-IRRAS) system to investigate biomaterials at the solid-solution interface in my doctoral course work.
2.2 Surface selection rules for IRRAS
The incident IR radiation on a surface can be split into s-polarized and p-polarized components of the electric field (Figure 2.2a). For the s-polarized component, the electric field vector oscillates in the plane perpendicular to the plane of incidence.
As the electrical conductivity of a metal is very high in the infrared region, the electric field component tangential to the surface is zero at the surface. The phase of the light changes 180° before and after the reflection at a metal surface, and this phase inversion leads to vanishing resultant amplitude of the electric field vector at the surface (Figure 2.2b).Therefore, the s-polarized component does not have effective contribution to the Figure 2.2 a) Reflection of light on a clean metal surface, the electric field denoted Ep and Es. b) Phase shift of light; dp and ds versus angle of incident, c) electric field and intensity of P-light versus angle of incident [14, 15]
a b
c
excitation of the vibrating dipoles at the surface. As a result, vibrational modes parallel to the substrate surface are not detected in IRRAS. The electric field vector of the p- polarized radiation oscillates in the plane of incidence. Its intensity at the surface becomes even higher than that of the incident beam depending on the angle of incidence (Figure 2.2c). The p-polarized radiation can interact with molecular vibrations which have a non-zero component of the dipole moment derivative normal to the surface. Thus, p-polarized light is effective in IRRAS on metal surfaces. This is the origin of surface selection rule of IRRAS, which states that only the perpendicular component of the vibrational dipole moment is active [16,17]. Thus, the absorbance spectra of biomaterials at the solid-solution interface are given mainly from the contribution of p-polarized radiation, if the biomaterials layer is sufficiently thin compared with the IR wavelength.
2.3 Incident angle calculation
In the present solid-solution interface IRRAS system, CaF2 prism is used to introduce the IR beam to the sample surface. If the incident angle of light is higher than the critical angle then total internal reflection (TIR) occurs at the CaF2/solution interface and the IR beam does not reach to the sample surface. The critical angle of CaF2/ H2O system was calculated using Snell’s equation,
n1 sinθi= n2 sinθr
n1=refractive index of CaF2 n2=refractive index of H2O θi=incident angle of IR θr=refractive angle of IR
The definition of the critical angle for the total reflection (θcrtc) is θr=90°; so the equation is
n1 sinθcrtc = n2 sin90° sinθcrtc = n2 / n1
The dependences of θcrtc on the light wavenumber were calculated using refractive index of CaF2 (Appendix II) and H2O (Appendix III) at the region of 1100 to 3000 cm-1 and shown in Figure 2.3.
Figure 2.3 shows that the lowest critical angle is 64.15° at 1695 cm-1. Most of the IR light illuminates on the substrate surface through the H2O layer if the incident angle of the IR is adjusted just below the critical angle. Therefore, in this new NG-IRRAS system the incident angle was set at 64°.
Figure 2.3 Dependence of critical angle of the total reflection at the CaF2/ H2O interface on the light wavenumber.
2.4 Principle of solid-solution interface IRRAS
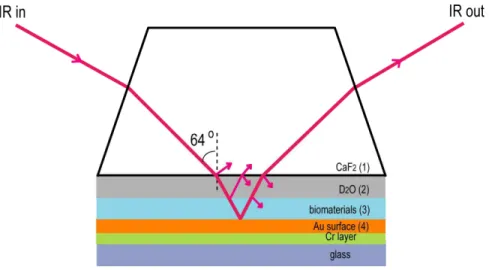
Figure 2.4 shows the schematic of a solid-solution interface with adsorbates (CaF2/D2O/biomaterials/Au) which is used for the present IRRAS experiments. In this spectroscopic system a silicon wafer with buried metal layer (BML) substrate made by the wafer-bonding method, which has the structure of [13], and a commercial gold substrate made by the sputter deposition on the Cr-pre-coated glass substrate ( Moritex Co. Tokyo, Japan) are used.
It is assumed that the four layers CaF2, D2O, adsorbate and Au are isotropic, homogeneous, and parallel to each other. These layers are represented by layers 1-4, in Figure 2.4. The interaction of the IR light with the surface is described by the Fresnel equation, which incorporates the appropriate boundary conditions in the electromagnetic wave equations of the incident, reflected, and refracted wave.
Figure 2.4 The schematic of the sample holder in the present IRRAS experiment. Layers 1-4 represent the CaF2 prism, D2O layer, adsorbed biomaterials layer and gold layer respectively.
If using the complex refractive index, nx=nx-ikx , and the incident and the refractive angle Φi and Φr, the electric field reflectance rxy at the interface of medium x and y(y=x+1) is given by
Thus,
On the other hand, the electric field reflectance at the surface of the three layers 2, 3 and 4 (r234) is obtained as follows
,where ∆3 isthe phase shift of the light expressed as follows
,where di represents the thickness of the layer i; and cosΦi can be express as
r
xy= - n
xcosΦ
r- n
ycosΦ
in
xcosΦ
r+ n
ycosΦ
ir
12= - n
1cosΦ
2- n
2cosΦ
1n
1cosΦ
2+ n
2cosΦ
1r
23= - n
2cosΦ
3- n
3cosΦ
2n
2cosΦ
3+ n
3cosΦ
2r
34= - n
3cosΦ
4- n
4cosΦ
3n
3cosΦ
4+ n
4cosΦ
3r
234= r
23+ r
34∗
− 2 ∆ 3
1 + r
23∗ r
34∗
− 2 ∆33 3
3
3
cos
2 Φ
=
∆ λ
π
)
2sin
(
1
cos
23 2
3
= − Φ
Φ
In the similar way, the electric field reflectance of four layers, 1, 2, 3, and 4 (r1234) is obtained as follows
The absorbance of IR can be calculated as follows, 2
1234
! =
1 (d3≠0)
! =
0 12342 (d3=0)where, R1 and R0 are the reflectance from the IR beam with and without adsorbates, respectively, and correspond to the signal and back ground spectra in the IRRAS measurement. The absorbance of the adsorbate (A) is calculated as follows.
0
log
1!
− !
=
2 12
234
2 234
12
1234
2
2
1 − ∆
∆
−
∗
∗
+
∗
= +
2 2
2
2
cos
2 Φ
=
∆ λ
π cos 1 ( sin )
21 2
1
2
= − Φ
and
Φ
References
[1] D.L. Allara, J.D. Swallen, J. Phys. Chem. 86 (1982) 2700
[2] D. F. Cui, V. A. Howarth, M. C. Petty, Thin Solid Films, 192 (1990) 391.
[3] J. L. Coutre, L. R. Narasimhan, C.K. Patel, H. R. Kaback, Proc. Natl. Acad. Sci. 94,( 1997) 10167.
[4] Z. Liu, M. D. Amiridis, Surf. Sci. 596 (2005) 117.
[5] N. Misawa, S. Yamamura, Y.-H. Kim, R. Tero, Y. Nonogaki, T. Urisu, Chem. Phys. Lett. 419 (2006) 86.
[6] H. Seki, K. Kunimatsu, W. G. Golden, Appl. Spectrosc. 39, (1985) 437. [7] D. D. Popenoe, S. M. Stole, M. Porter, Appl. Spectrosc, 46, (1992) 79.
[8] S.-S. Cheng, K. K. Chittur, C. N. Sukenik, L. A. Culp, K. Lewandowska, J. Colloid Interface Sci. 162, (1994) 135
[9] M. C. Hull, L. R. Cambrea, J. S. Hovis, Anal. Chem, 77 (2005) 6096.
[10] S. J. McClellan, E. I. Franses, Colloids and Surfaces A: Physicochem. Eng. Aspects, 260 (2005) 265.
[11] S. Morita, M. Tanaka, Y. Ozaki, Langmuir, 23 (2007) 3750 [12] K.K. Chittur, Biomaterials 19 (1998) 357.
[13] S. Yamamura, S. Yamuchi, S. Watanabe, M. Tabe, T. Kasai, Y. Nonogaki, T. Urisu, Jpn. J. Appl. Phys. 42, (2003) 3942.
[14] F. M. Hoffmann, Surf. Sci. Reports 3 (1983) 107.
[15] J. Pritchard, in: Vibrations in adsorbed layers, Conference Record Series of KFA, Eds. H. Ibach and lehwald (KFA, Julich, 1978), 114
[16] R. A. Dluhy, S. M. Stephens, S. Widayati, A. D. Williams, Spectrochim. Acta Part A 51 (1995) 1413-1447
[17] H. A. Pearce, N. Sheppard, Surf. Sci. 59 (1976) 205. [18] R. A. Dluhy, J. Phys. Chem. 90 (1986) 1373.
Chapter 3
Construction of new narrow gap infrared reflection
absorption spectroscopy (NG-IRRAS)
Chem. Phys. Lett. 466 (2008) 235.
3.1 Introduction
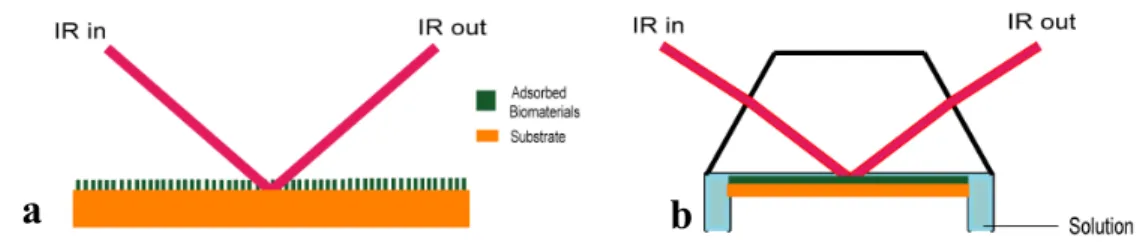
Infrared reflection absorption spectroscopy (IRRAS) techniques are used for detection of biomaterials on IR-non-transparent solid surfaces. A large number of IRRAS studies have been carried out on biomaterials at interfaces e.g. proteins and lipid membranes at the vacuum/solid [1-4] and air/water [5-7] interfaces. Polarization-modulation IRRAS was used to study such biomaterials at the interface between the solid surface and aqueous solution [8-12]. To detect biomaterials at the interface between solutions and IR- transparent metal surfaces, the conventional or Kretschmann type attenuated total internal reflection spectroscopy (ATR–IR) optical arrangements (Figure 2.1 in Chapter 2) are used. But the ATR is not available to the IR-non-transparent substrates [13, 14]. IRRAS is a single refection system, and the substrate is usually set in vacuum or water-vapor-free environments as shown in Figure 3.1a. The IR beam is directly irradiated on a sample surface and the reflected beam is guided to the detector [1-4]. On the other hand, to observe biomaterials at the solid-solution interface, the solution layer is necessary on the non-transparent solid surface. The water layer is essentially necessary for biomaterials to keep their life functions and the important amide bands of proteins appear around 1400-
very few numbers of IRRAS configurations have been reported about the biomaterials at the solid-solution interface (Figure 3.1b) [15, 16]. In these reported IRRAS systems, very thin (1~2 µm) solution layer was sealed between the substrate and the prism surface and solution could not be exchanged, and the spectra of the adsorbates were obtained by substituting those of the bare substrate [14].
For the in-situ observation of the adsorbed biomaterials at the solid-solution interface using IRRAS technique, an injection system with a large gap between the prism and the substrate is necessary to make the reagent solution flow in and out of the sample holder.
Figure 3.1 The reported optical configurations of a) vacuum IRRAS and b) conventional narrow gap-solid solution interface IRRAS
a b
Figure 3.2 The optical configuration for the new narrow gap solid-solution NG-IRRAS in the present study
No IRRAS system equipped with such a flow system has been reported to my knowledge. Considering these points, I have proposed a new narrow gap IRRAS (NG-IRRAS) system as shown in Figure 3.2, which was designed to observe the adsorption and reaction of biomaterials at the solid-solution interface.
3.2 New narrow gap infrared reflection absorption spectroscopy
configuration and construction
The detail of the schematic experimental configuration of the new NG-IRRAS system is shown in Figure 3.3. The NG-IRRAS system consists of two parts. One is the IR source, for which a commercial JEOL JIR-7000 FT-IR spectrometer is used. The other is a home built sample chamber system consisting of mirror chambers, a sample chamber and a detector chamber.
Figure 3.3 The outline of the experimental configuration of the new NG-IRRAS
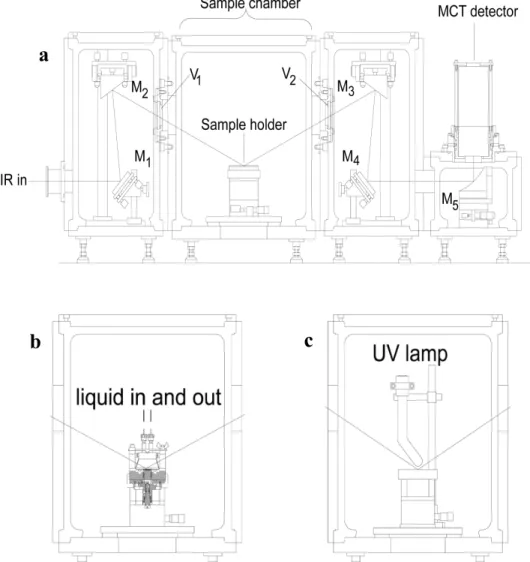
Figure 3.4 Schematic diagram of the sample chamber system for the new NG- IRRAS. a) Optical setup; M1 and M4: Al-coated plane mirrors, M2, M3 and M5: Off-axis Au-coated paraboloidal mirrors; V1 and V2: CaF2 window. b) Sample holder arrangement for IRRAS measurement at the solid-solution interface. c) Sample holder arrangement for IRRAS measurement in vacuum.
a
b c
Figure 3.4 shows the schematic diagram of the sample chamber system for the new NG-IRRAS system. IR beam from the spectrometer is irradiated on an Al-coated plane mirror (M1 in Figure 3.4) and reflected to an off-axis Au-coated paraboloidal mirror (M2). These two mirrors guide the IR beam to the CaF2 prism side plane to introduce the IR beam to the substrate surface with the angle of 64˚. The reflected IR beam from the substrate surface was focused onto the mercury cadmium telluride (MCT) detector using the mirrors M3, M4 and M5. The MCT detector was cooled by liquid nitrogen. The mirror M4 is an Al-coated plane mirror; M3 and M5 are off-axis Au-coated paraboloidal mirrors with diverting angle of 65° and 90° respectively. The sample chamber is sealed by two CaF2 windows (V1 and V2 in Figure 3.4) with 5 mm thickness and 50 mm diameter. These CaF2 view ports were used without coating. The picture of the sample chamber system is shown in Figure 3.5.
This new NG-IRRAS system can be used to detect biomaterials at the solid-solution interface as well as in vacuum, if the IR beam path and the sample chamber were arranged differently for each system, as shown in Figure 3.4b and 3.4c. A specified
Figure 3.5 Picture of the NG-IRRAS sample chamber system
Mirror chamber Sample chamber Mirror chamber MCT detector chamber
sample holder was designed for each measurement. The detail of each sample holder is shown in Figure 3.6.
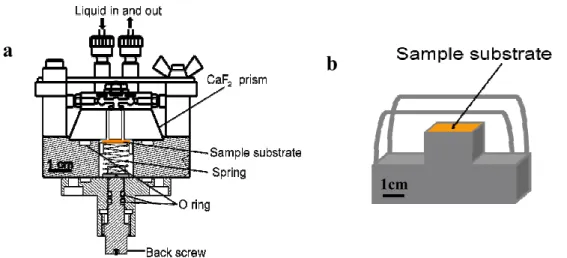
A CaF2 prism (40×40×15) mm3 was used in this NG-IRRAS system. For the IR measurement at the solid-solution interface, two through holes (diameter 2 mm) are made in the CaF2 prism, to flow solutions in and out of the sample holder (shown in Figure 3.2). The solution is injected through Teflon tubes (inner diameter 0.5 mm) using a syringe pump connected to the solution inlet and outlet ports. The sample solution is injected by the syringe pump at a prescribed flow rate. The picture of the sample holder for solid- solution interface and the solution injection system are shown in Figure 3.7. For the vacuum IRRAS arrangement a simple metal block sample holder (Figure 3.6b) was used. A UV lamp was placed above on the substrate for ashing of the biomaterials. A UV lamp holder, electric connection to the UV lamp and dry air flow system was equipped in the IR sample chamber.
1cm
Figure 3.6 Detailed structures of sample holders; a) for the solid-solution interface NG- IRRAS, and b) for the vacuum IRRAS arrangement.
a b
This NG-IRRAS system is available for any IR reflecting metal substrates. The size of sample substrate was 14×14×0.6 mm3. In this study, two different substrates, the silicon substrate with a buried metal layer (BML) fabricated by the wafer-bonding method [17], and a commercial gold substrate were used to detect solid-solution interface biomaterials. An 8 µm thick nickel sheet (Nilaco Co.) of size 14×14 mm2 with a 10×4 mm2 rectangular window in the middle position was inserted between the sample substrate and the CaF2
prism as a spacer, as shown in Figure 3.8. The sample substrate with the Ni spacer on its surface was placed on the movable sample stage, and then the CaF2 prism was put upon the Ni spacer surface, finally the prism was combined with the solution supply system and locked with a screw. A spring (spring constant 6 N/mm) is used to push the movable sample stage as well as the sample substrate from the backside. The back screw was deigned to compress the spring. In this work, 2.5 mm compression of spring was used, and I investigated the tolerable solution thickness change (∆Ls; see section 5.3.2), the thickness change due to the injection pressure during the solution injection (∆Lp) and recovery of thickness change after stopping the injection (∆Lr) (Figure 3.8), which are expressed as
| ∆Lp | – | ∆Lr | < ∆Ls
The back screw is sealed by two O-rings to minimize the gap change due to the looseness
a b
Figure 3.7 a) Picture of the sample holder for solid-solution interface biomaterials, drawn in Figure 3.6a. b) Picture of the solution injection system connected to the sample holder.
In this present NG-IRRAS system, the sample chamber is evacuated by a rotary pump (RP) and a turbo molecular pump (TMP) with 500 L/s pumping speed (Figure 3.3). The sample chamber was evacuated to minimize water vapor noise spikes from the IR spectra. Since the TMP is attached directly to the sample chamber, the TMP is turned off and the chamber is evacuated only by the RP during IRRAS measurements to avoid the influence of vibration. The vacuum condition was monitored by a Pirani gauge (ULVAC GP2A) and an ion gauge (ULVAC G1-M2). The base pressure was always kept less than 2×10⁻² Torr.
3.3 Rearrangement of NG-IRRAS system to vacuum IRRAS
The NG-IRRAS system can be rearranged to vacuum IRRAS measurement. The sample chamber arrangement was shown in Figure 3.4c. In the IR measurement at the solid-solution interface, the IR light is refracted by the CaF2 prism (Figure 3.9, solid yellow line), but in the vacuum IRRAS measurement the IR light directly illuminates on
Figure 3.8 The schematic of the detailed set-up of the sample holder; solution thickness change due to the injection pressure, sample substrate and Ni spacer.
the sample surface without refraction (Figure 3.9, dotted red line). Thus, the sample height should be adjusted to compensate the difference in the light path length.
The IR reflection point without prism was evaluated to be ~2 mm higher, and the higher sample holder was made for the vacuum measurement. This sample holder (Figure 3.6b) was made of a steel block, and the sample substrate was fixed upon the holder using silicone grease.
3.4 Technical problems of the new NG-IRRAS system
The IR light passes through the water layer between the prism and the sample surface in this NG-IRRAS system. Thus, it is necessary to keep the water layer thickness constant to obtain a flat baseline. In this IRRAS system a special sample holder was used to control the water layer thickness in nanometer level fluctuations (Figure 3.6a, 3.7 and 3.8). Several factors were identified for the change of the water layer thickness in several nanometers. These factors and the resolution of them were described briefly in chapter 5.
Figure 3.9 Sample height difference between the IRRAS measurement in vacuum and at the solid-solution interface. Yellow solid line represents the IR path for the solid-solution interface and the red dotted line for the vacuum IRRAS.
3.5 Summary
A new NG-IRRAS system was constructed using a JEOL JIR-7000 FT-IR spectrometer and a home built sample chamber system. A sample holder using a CaF2
prism was designed for observing adsorbed biomaterials at the solid-solution interface. The solution layer was kept at a prescribed thickness (usually 8 µm) by inserting a Ni spacer between the CaF2 prism bottom and the substrate surface. To make the gap constant precisely, the sample substrate was pushed by a specially designed spring and O ring system from backside. The sample chamber was evacuated to remove water vapor from the IR spectra. Therefore, the sample solution was sealed with O-rings, and was injected through the holes in the CaF2 prism at a prescribed speed using a syringe pump. The same optical setup was also used for a vacuum IRRAS. For vacuum IRRAS measurement a simple metal block sample holder was used, where the sample substrate was fixed by silicone grease on the metal block.
References
[1] D. L. Allara, J. D. Swallen, J. Phys. Chem. 86 (1982) 2700.
[2] D. F. Cui, V. A. Howarth, M. C. Petty, Thin Solid Films 192 (1990) 391. [3] Z. Liu, M. D. Amiridis, Surf. Sci. 596 (2005) 117.
[4] N. Misawa, S. Yamamura, Y.-H. Kim, R. Tero, Y. Nonogaki, T. Urisu, Chem. Phys. Lett. 419 (2006) 86.
[5] A. Kerth, A. Erbe, M. Dathe, A. Blume, Biophys. J. 86 (2004) 3750.
[6] C. W. Meuse, S. Krueger, C. F. Majkrzak, J. A. Dura, J. Fu, J. T. Connor, A. L. Plant, Biophys. J. 74 (1998) 1388.
[7] C.R. Flach, J. W. Brauner, J. W. Taylor, R. C. Baldwin, R. Mendelsohn, Biophys. J. 67 (1994) 402
[8] A. Meister, C. Nicolini, H. Waldmann, J. Kuhlmann, A. Kerth, R. Winter, A. Blume,
[9] L. Wang, P. Cai, .H-J Galla, H. He, C. R. Flach, R. Mendelsohn, Eur. Biophys. J. 34 (2005) 243.
[10] P. Cai, C. R. Flach, R. Mendelsohn, Biochemistry 42 (2003) 9446.
[11] J. W. Brauner, C. R. Flach, Z. Xu, X. Bi, R. N. A. H. Lewis, R. N. McElhaney, A. Gericke, R. Mendelsohn, J. Phys. Chem. B 107 (2003) 7202.
[12] D. L. Elmore, R. A. Dluhy, Appl. Spectrosc. 54 (2000) 956. [13] K. K. Chittur, Biomaterials 19 (1998) 357.
[14] S. Morita, M. Tanaka, Y. Ozaki, Langmuir 23 (2007) 3750.
[15] D. D. Popenoe, S.M. Stole, M. Porter, Appl. Spectrosc. 46 (1992) 79. [16] H. Seki, K. Kunimatsu, W.G. Golden, Appl. Spectrosc. 39 (1985) 437.
[17] S. Yamamura, S. Yamuchi, S. Watanabe, M. Tabe, T. Kasai, Y. Nonogaki, T. Urisu, Jpn. J. Appl. Phys. 42, (2003) 3942.
Chapter 4
Experimental: details with materials and methods
(Chem. Phys. Lett. 466 (2008) 235.)
4.1 Sample substrate cleaning
In the newly developed narrow gap solid-solution infrared reflection adsorption spectroscopy (NG-IRRAS) system, adsorbed fibronectin (FN) and immunoglobulin G (IgG) were investigated at the interface between aqueous solutions and SiO2 or gold surfaces. The substrates were cleaned before using in sample investigation. Two different methods were followed for cleaning these substrates. All the following processes were performed in a clean room.
4.1.1 Cleaning of BML-substrate
A Si wafer with a buried metal layer (BML) fabricated by the wafer-bonding method [1], which have the structure of SiO2(100)/CoSi2/ Si (100), was RCA-cleaned as follows. Firstly, the BML substrate was sonicated in acetone and methanol, each for five minutes, to remove oil and grease from the substrate. Afterward the BML substrate was boiled in piranha solution (conc. H2SO4 + H2O2 (30%) (4:1 v/v)) (to remove organic compounds and metal contamination) and then in NH4OH (20%) + H2O2 (30%) + H2O (1:4:20 v/v) (to remove particles) for 10 minutes each. Then the BML substrate was immersed in 1% HF solution to remove native SiO2 resulting in a hydrophobic H-terminated Si surface.
Finally, the substrate was boiled in a mixed solution of HCl and H2O2 (conc. HCl + H2O2
(30%) + H2O (1:1:4 v/v)) (to oxidize the metal surface). Then the substrate was kept in miliQ (>18 MΩ cm-1) water until the use in experiments. Through this protocol a quite flat (rms roughness of 0.18 nm) chemically oxidized SiO2 layer is formed on the BML substrate.
4.1.2 Cleaning of gold substrate
The gold substrate, which was formed by depositing gold on a Cr-coated glass substrate ( , was purchased from Moritex Co. (Tokyo, Japan). In this work, the as-delivered gold substrate was immersed in acetone and methanol and the beaker was agitated with hand for two minutes, each. Then the gold substrate was washed with miliQ water and dried with N2 blow. The dried gold substrate was placed in a glass beaker carefully keeping gold side up. Then 7.5 mL 30% H2O2 was poured onto the gold substrate and subsequently 15 mL conc. H2SO4 was added into the glass beaker. This solution, i.e. piranha solution, was mixed gently. The gold substrate was kept in the piranha solution for 2 h with being gently agitated for every 15 minutes interval. Then the piranha solution was slowly decanted to the other beaker. MiliQ water was poured onto the gold substrate to wash out the piranha solution. The miliQ water was exchanged at least 10 times to completely remove the piranha solution from the gold substrate. Finally, the gold substrate was dried with gentle N2 flow and kept in a box until the IgG deposition.
4.2 Materials and sample preparation
FN from human plasma was purchased from Sigma-Aldrich Inc. (St. Louis, MO). The FN vial was first equilibrated to RT and dissolved in D2O (Sigma-Aldrich) for at least 30 min at the concentration of 5 mg/ml. The FN solution was stored in working aliquots (100 µL) at -20ºC. The FN solution was taken out from the refrigerator, kept at RT, and
![Figure 1.1 Schematic of the protein adsorption process at solid-aqueous solution interface [14]](https://thumb-ap.123doks.com/thumbv2/123deta/6166757.104970/10.918.309.672.177.393/figure-schematic-protein-adsorption-process-aqueous-solution-interface.webp)