Development of
two-dimensional EUV spectroscopy
for study of impurity behavior in
ergodic layer of LHD
Erhui WANG
Doctor of Philosophy
Department of Fusion Science
School of Physical Sciences
The Graduate University for Advanced Studies
2013
i
Abstract
The impurity plays an important role in the fusion research based on magnetically confined toroidal devices from the points of view of the impurity radiation loss at plasma core, fuel dilution due to the impurity contamination and edge plasma cooling by impurity radiation to mitigate the divertor heat flux. The Large Helical Device (LHD) is characterized by the presence of stochastic magnetic field layer called 'ergodic layer' surrounding the core plasma. The ergodic layer therefore consists of open magnetic file lines with fully three-dimensional structure, of which the magnetic field structure is entirely different from the scrape-off layer in plasma edge of tokamaks. The study of impurity behavior in the ergodic layer of LHD is then extremely important for control of the impurity influx, effective utilization of the impurity screening and steady operation of the detached plasma.
In order to study the impurity behavior in the ergodic layer of LHD, the two- dimensional measurement of impurity line emissions is highly requested. For the purpose a space-resolved extreme ultraviolet (EUV) spectrometer has been developed to observe the full vertical profile and two-dimensional distribution of impurity line emissions in LHD. The vertical profile and two-dimensional distribution have been successfully observed with enough spatial resolution for carbon and iron spectra. The two-dimensional edge temperature is measured from impurity line emissions. The vertical profile and the two-dimensional distribution of CIV located in the edge boundary of the ergodic layer are also observed in the vicinity of X-point. These results are compared with three- dimensional edge plasma simulation with EMC3-EIRENE code. The comparison shows a fairly good agreement between the observation and the simulation. It indicates the importance of the parallel transport in the edge boundary of the ergodic layer, in particular, the friction force between bulk and impurity ions and the ion temperature gradient force along magnetic field.
ii
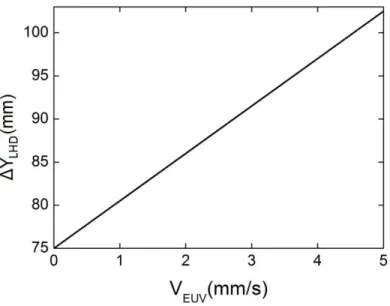
For two-dimensional EUV spectroscopy two stepping motors are newly installed on the space-resolved EUV spectrometer to scan the observation range in horizontal and vertical directions. In the vertical direction, two different vertical observation chords are at least needed to measure the full vertical profile of impurity line emissions because the vertical observation range of the spectrometer only coves half of the plasma length at horizontally elongated plasma cross section. In order to measure the two-dimensional distribution of impurity line emissions, the space-resolved EUV spectrometer is scanned horizontally with a fixed vertical angle during a stable discharge. The scanning speed is usually set to 1-5 mm/s which depend on the length of discharge. The horizontal scanning range at the magnetic axis position is around 800 mm which is limited by a diamond LHD port and a rectangular spectrometer port. The spatial position of observation chord is calibrated by a toroidal slit with rectangular-corrugated edge installed between LHD plasma and space-resolved EUV spectrometer. The working wavelength range is extended from 50-500 Å to 30-650 Å by adding the second CCD stage for enlarging the CCD movement distance. The CCD position is then deviated from an exact focal plane in wavelength ranges of 30-50 Å and 500-650 Å and the spectral resolution is lowered a little in those wavelength ranges. In practical use of the spectrometer, however, any visible problem is not observed through the present study.
Vertical profiles of HeII (303.78 Å, Ei=54 eV) and CIV (312.4 Å, Ei=64 eV) have been measured at different plasma cross sections by scanning the spectrometer angle toroidally to observe the edge impurity distribution at different poloidal positions. The radial location of HeII reflects the penetration of neutral helium and the radial location of CIV expresses the index of plasma edge boundary in the ergodic layer of LHD. The result indicates that the radial location of HeII is positioned at inner side compared to that of CIV, whereas the ionization energy of HeII is smaller than that of CIV. The distance between HeII and CIV radial positions is nearly constant, i.e. 4 mm, which is not a function of the poloidal positions. The experimental result is compared with calculated penetration depth of the neutral helium assuming the room temperature of 300 K. The calculation shows a good agreement with the experimental result. The full vertical profile of HeII is also
iii
measured at horizontally elongated plasma cross section. It is found that the HeII intensity at the bottom of plasma is stronger than that at the top of plasma. This asymmetric intensity profile is also observed in the CV vertical profile, while it is disappeared in the CVI vertical profile.
Electron temperature distribution in the ergodic layer is important information for studying the edge impurity behavior. A line intensity ratio for Li-like ions is used to measure the vertical profile and two-dimensional distribution of electron temperature in the ergodic layer. The Li-like CIV is adopted for the temperature measurement, which is located in the edge boundary of ergodic layer because of its low ionization energy. When two CIV lines of 2p-3d (384 Å) and 2p-3s (420 Å) are selected, those can be simultaneously observed in the same CCD position. Therefore, we can exclude the uncertainty based on the absence of reproducibility between two discharges. The line intensity ratio of 2p-3d/2p-3s is sensitive to the electron temperature in the range of 5-40 eV and entirely insensitive to the electron density in the range of ne<1014 cm-3, which are calculated by CHIANTI and ADAS codes. The edge electron temperature estimated from the CIV intensity ratio ranges in 5-23 eV. Since magnetic field lines near the edge boundary are directly connected to the divertor plates with short magnetic field lines around 10 m, the CIV temperature can be correlated with the temperature on the divertor plates. The electron temperature on divertor plates is measured by Langmuir probe. The measured divertor temperature distributing around 10 eV shows a good consistency with the edge temperature evaluated from the CIV intensity ratio. The electron temperature is also measured from NeVIII intensity ratio of 3p-2s/3s-2p (88 Å/103 Å) for Li-like Ne7+ ion, which is located near last closed flux surface (LCFS) in the edge plasma of LHD. The vertical profiles of electron temperature evaluated from ADAS and CHIANTI codes range in 100-130 eV and 120-230 eV, respectively. The electron temperature at LCFS measured from Thomson Scattering is determined to be 120 eV, while the temperature at LCFS is 110 eV for ADAS and 170 eV for CHIANTI. The electron temperature profile is also simulated with three-dimensional edge transport code. The result shows a good agreement with the ADAS result. As a result it is found that the ADAS code is applicable to the edge
iv
temperature measurement. The two-dimensional distribution of electron temperature in the ergodic layer is measured using NeVIII intensity ratio in discharges with electron cyclotron resonance heating (ECH) discharges. The electron temperature at the top edge of plasma shows a higher temperature of 210-220 eV in all toroidal locations, whereas the electron temperature in the vicinity of X-point shows a lower temperature around 150-180 eV.
The CIV vertical profiles near X-point at horizontally elongated plasma cross section are studied with magnetic field structure in the ergodic layer. In low-density range less than 2x1013 cm-3, the CIV profile near X-points is almost flat. When the density increases, two peaks newly begin to appear near X-points in addition to usual edge peaks, whereas such peaks do not appear in the profile of CVI located near LCFS. Those peaks become very clear at high-density range of ne8x1013 cm-3. This phenomenon can be also observed at different magnetic axis positions. The vertical profile of CIV is analyzed using three-dimensional edge transport code. In the low-density case, the C3+ ions move upstream and widely expand in the ergodic layer due to dominant thermal force, which leads to the flat CIV profile. With increasing the density, the friction force becomes dominant and the impurity ions start to move downstream. The C3+ ions stay in the vicinity of the X-point, where magnetic field lines are directly connected to divertor plates. Thus, the two peaks near X-point are clearly formed by increase in the C3+ density. The two-dimensional distributions of HeII, CIV and CVI are observed for different plasma axis positions. It is found that the impurity emission becomes considerably strong along the poloidal trajectory of X-points and the poloidal trace is moved from inboard X-point trajectory to outboard X-point trajectory when the plasma axis is changed from 3.60 m to 3.90 m.
v
Contents
1. Introduction………1
1.1 Nuclear fusion research………...………1
1.2 Role of the impurity in fusion plasmas………4
1.3 Large Helical Device………...………8
1.4 Edge magnetic field structure of LHD and impurity transport in ergodic layer…...11
1.5 Objective and structure of the thesis.………16
References………19
2. Development of EUV spectrometer system for 2-D measurement………21
2.1 Introduction………21
2.2 Space-resolved EUV spectrometer for 2-D measurement………27
2.3 Positional calibration of observation chords………34
2.4 Experimental results………40
2.5 Summary………49
References………50
3. 1- and 2-D distributions of impurity line emissions………51
3.1 Introduction………...………51
3.2 Experimental setup………...……….52
3.3 1-D distributions of impurity line emissions……….56
3.4 2-D distributions of impurity line emissions……….………58
3.5 Summary………63
References………64
vi
4. Radial location of HeII and CIV line emissions at different poloidal angles………65
4.1 Introduction………...………65
4.2 Experimental setup………67
4.3 Radial location of HeII and CIV line emissions………69
4.4 Summery………74
References………76
5. 1- and 2-D edge Te distributions measured with line intensity ratio………...77
5.1 Introduction………...77
5.2 Vertical profile of electron temperature in edge boundary of ergodic layer……….80
5.2.1 Vertical electron temperature profile measured from CIV line ratio………..80
5.2.2 Comparison with electron temperature on divertor plates………..83
5.3 Vertical profile and 2-D distribution of Te near LCFS of ergodic layer…...………85
5.3.1 Observation of neon lines………85
5.3.2 Vertical electron temperature profile measured from NeVIII line ratio..…..…87
5.3.3 2-D electron temperature distribution measured from NeVIII line ratio……...91
5.4 Summary………95
References……….………97
6. Structure of impurity line emissions near X-point in the ergodic layer………99
6.1 Introduction………...………99
6.2 Magnetic field structure near X-point in LHD………...…101
6.3 Vertical profile of impurity line emissions in the vicinity of X-point …...………105
6.3.1 Vertical profiles of CIV and CVI near X-point ……….…….105
6.3.2 Three dimensional edge transport code, EMC3-EIRENE ……….….110
6.3.3 Comparison with 3-D simulation on vertical profiles of CIV and CVI...111
6.4 2-D distribution of impurity line emissions in the vicinity of X-point………121
6.4.1 2-D distribution of impurity line emissions………..………121
6.4.2 Analysis of measured 2-D impurity distribution with 3-D simulation………126
vii
6.5 Summary………...129
References………..131
7. Summary………...………133
Acknowledgements……….139
List of publications………...…141
- 1 -
Chapter 1
Introduction
1.1 Nuclear fusion research
Nuclear fusion is the primary energy source maintaining most of stars. In fusion reactions, low-mass nuclei combine or fuse to form more massive nuclei, releasing energy in the form of radiation and in the kinetic energy of the fusion products. When we consider the nuclear fusion as the energy source on earth, the most promising fusion reaction is D-T reaction because of its lower energy threshold and bigger cross-section compared with other fusion reactions [1]. The D-T reaction is expressed by
MeV n
He T
D 4 17.6 , (1.1) where D, T, 4He and n are the deuterium, the tritium, the alpha particle and the neutron. The kinetic energy of 17.6 MeV is divided into 3.5 MeV for the alpha particle and 14.1 MeV for the neutron. In the fusion reactor the alpha particle with energy of 3.5 MeV is utilized for maintaining the fusion reactor through collisions with bulk ions and electrons and the energy is basically gained through the neutron.
In order to realize the controlled fusion reactor, many types of fusion devices for magnetic confinement have been developed in the past several decades, such as tokamak, stellarator, reversed-field pinch and magnetic mirror. The tokamak was invented in the
- 2 -
1950s by Soviet physicists, Igor Tamm and Andrei Sakharov. After confirming a good performance of the tokamak, many tokamaks have been constructed in many countries. At present, ASDEX Upgrade, DIII-D, EAST, JET and KSTAR [1] have been operated in the world, and JT-60SA [2] and ITER [3] are under construction as the next-generation tokamak. In particular, the ITER is the world’s largest tokamak aimed at the D-T operation. The ITER project is basically supported by seven member entities, i.e., China, the European Union (EU), India, Japan, Korea, Russia and United States. Compared with the tokamak, the stellarator has a special character of having no plasma current, which can exhibit a good performance in the viewpoint of steady state operation of the fusion reactor. At present, Large Helical Device (LHD) is the largest stellarator having heliotron-type magnetic configuration in which the superconducting magnet is used for all the coil system [4]. A detailed explanation of LHD is made in section of 1.3. Wendelstein 7-X is another large superconducting stellarator device having modular coil system, which has been developed in Germany and will be completed in 2015 [5].
For a D-T plasma, the power balance is given by
nTV V n
P
E a
H
3 4
1 2
(1.2)
where PH is the external heating power, n and T the ion density and temperature, respectively, the rate coefficient of D-T reaction, α the α-particle energy released per reaction, E the energy confinement time and V the plasma volume. In this equation, the left second term and the right term indicate the total α-particle heating power and the rate of plasma energy loss, respectively.
The requirement for the plasma burn to be self-sustaining is then written by
a E
n T
12 . (1.3)
- 3 -
When parabolic density and temperature profiles are assumed in the fusion reactor, the ignition requirement at the peak value is given by a relation of
keVs m T
nˆ ˆE 51021 3 (1.4) Figure 1.1 illustrates the progress of nTE condition obtained in the different magnetic confinement fusion devices [6]. The fusion device is now close to the breakeven condition indicating that the fusion output is equal to the power input. However, several physics subjects to be resolved are still remained to realize the fusion reactor with steady state operation such as the plasma-wall interaction, removal of helium ash, α-particle confinement and so on in addition to the steady maintenance of plasma current in the tokamak. Further effort has to be paid to the fusion experiment.
Fig.1.1 Diagram of nTE values versus ion temperature, T, obtained in different magnetically confined fusion devices.
- 4 -
1.2 Role of the impurity in fusion plasmas
Fusion plasmas magnetically confined in a toroidal vacuum vessel always contain the impurity through the plasma-wall interaction. The impurities, e.g., carbon and iron, come in the plasma as the source of first wall, divertor plates, mechanical limiters and antennas for high-frequency wave heating through the physical and chemical sputtering in addition to helium used for discharge cleaning. Noble gases and solid impurity pellet are frequently used for the transport study [7]. The light impurity such as carbon dilutes the fuel ions and the heavy impurity enhances the radiation loss. In the beginning of fusion study, the radiation loss from heavy impurities was found to be half to the input power [8].
The impurity ions in fusion plasmas are now classified as low-, medium- and high- Z elements. The most common low-Z impurities are lithium, boron, carbon and oxygen. The lithium and boron are brought into the plasma as the result of lithium and boron coating to the first wall which are carried out to reduce the oxygen and metallic impurity influxes originating with the plasma-facing materials. The source of carbon is the graphite tiles being used for protection of the vacuum vessel. Typical medium-Z impurities are chromium, iron and nickel which are the composition element of the vacuum vessel made of stainless steel. On the other hand, the high-Z impurity was not common in the fusion experiment during past several decades. Recently, however, molybdenum and tungsten materials are begun to use instead of the graphite tiles. In particular, the use of high-Z materials is important for ITER in relation to tritium retention, carbon dust and mitigation of divertor heat load.
The impurity concentration in fusion plasmas has been maintained in a low level with the technical development on wall cleaning and edge plasma control. A typical density of medium- and high-Z impurities is 0.1% or less to the electron density, while the carbon density is a few percent [9].
- 5 -
The density of impurity ions at certain radial location of plasma can be written by an impurity continuity equation of
] [ z 1 z 1 z z z 1 z 1 z z
z z
z n n S n S n a n a
t
n
, (1.5)
where nz is the density of impurity ions in the ground state of ionization state z, z the impurity flux in ionization state z, Sz and αz the ionization and recombination rate coefficients, respectively. When 0
t nz
and z 0 for all z, the equation expresses the coronal equilibrium condition.
The ion motion along magnetic field lines is much more rapid than the radial transport perpendicular to magnetic field lines. The radial distribution of impurity ions can be then treated as a one-dimensional transport. It is usually expressed as a function of flux surface coordinate. The impurity flux is represented by
) ( ) ( ) ( )
(r n r V r n r
Dz z z z
z
, (1.6)
where Dz(r) and Vz(r) are the diffusion coefficient and the convective velocity, respectively. Typical values observed in the experiment range in 0.1D1.0 m2/s and -10V+5 m/s with an assumption that the transport does not depend on the ion charge. The diffusion coefficient is often expressed as a function of plasma radius, whereas the convective velocity should be V=0 at plasma center and V<0 at plasma edge in usual discharges.
Typical profiles of electron temperature and density in JET are shown in Fig. 1.2(a) [9]. The radial impurity distribution in each ionization stage takes a shell structure as a function of plasma radius, as seen in the carbon radial profile in Fig. 1.2(b). Here, a spatially constant value of Dz=1.0 m2/s and V=0 is assumed in the impurity transport calculation for simplicity. The radial location of C6+ ion is shifted to inner position in plasma radius compared to the coronal model without transport.
- 6 -
Fig. 1.2 (a) Profiles of electron temperature, Te, and electron density, Ne, in JET and (b) radial profiles of carbon ions in different ionization stages (solid lines). The dashed line indicates the result from Coronal equilibrium.
(b)
(a)
- 7 -
The spectral line of impurities in fusion plasmas is emitted in a wide wavelength range from near infrared to soft X-ray, i.e. 1-12000 eV, as listed in Table 1.1. The molecular spectra such as hydrocarbon exist in the near infrared and visible wavelength ranges and the spectra from low-ionized impurity ions including neutral impurity are emitted in the visible, UV and VUV ranges. Such impurity emissions are located in the plasma edge. In the EUV range, on the other hand, the measurement of highly ionized impurity ions is possible in addition to the low-ionized impurities, whereas only helium- and hydrogen-like impurity ions located in the plasma center are observed in the soft X-ray range. Therefore, the EUV spectroscopy can cover a wide range of impurity charge states.
A lot of information on the plasma behavior can be obtained from the impurity spectroscopy. The ion temperature and the plasma rotation are measured from Doppler broadening and shift of the spectral line, respectively. The electron temperature and density can be measured from the line intensity ratio. The impurity density and impurity influx are determined from the analysis on absolute intensity of spectral line influx. The impurity transport is usually studied by measuring the temporal behavior of spectral lines based on laser blow-off and impurity pellet injection techniques. The measurement of bremsstrahlung continuum is also possible if the stray light of the spectrometer and electric noise of the detector are entirely reduced. This is a noble method to obtain the effective charge, Zeff, of the fusion plasma.
Table 1.1 Spectral ranges for spectroscopy
Spectral Region Wavelength/ Energy Region Near Infrared
Visible
Ultraviolet (UV)
Vacuum ultraviolet (VUV) Extreme ultraviolet (EUV) Soft X-ray
7000-12000 Å/1-2 eV 4000-7000 Å/2-3 eV 2000-4000 Å/3-6 eV 500-2000 Å/6-24 eV 10-500 Å/24-1200 eV 1-10 Å/1200-12000 eV
- 8 -
1.3 Large Helical Device
Large Helical Device (LHD) is the world largest superconducting fusion device. The magnetic field for plasma confinement is basically produced by a pair of helical coils (HC) with poloidal pitch number of l=2 and toroidal pitch number of m=10. The elliptical magnetic flux surfaces are produced by HC coils. Three pairs of poloidal coils shown in Fig. 1.3, i.e., inner vertical (IV), inner shaping (IS) and outer vertical (OV) coils are used for cancelation of the vertical field produced by HC coils, horizontal shift of the magnetic axis and the shaping of elliptical plasma with the quadruple field of IS coils. The main parameters of LHD are listed in Table 1.2. In LHD, a helical double-null divertor intrinsically exists by the presence of HC coils and the divertor layer is twisted poloidally and toroidally reflecting the shape of the HC coils.
Fig. 1.3 Cut-away drawing of LHD.
- 9 -
Table 1.2 Main parameters of LHD Major radius R
Minor radius <a> Plasma volume Vp
Magnetic field Bt NBI ECH ICRF
3.5-4.0 m 0.546-0.65 m 20-30 m3 3 T 28 MW 3.7 MW 2 MW
In LHD, the discharge is performed with three heating methods of electron cyclotron resonance heating (ECH) [10], ion cyclotron range of frequency (ICRF) heating [11] and neutral beam injection (NBI) heating [12]. The ECH is used to initiate the plasma discharge and to achieve high electron temperature plasmas. Recently it is also used for maintenance of long pulse discharges. The ICRF is mainly used for demonstrating a steady state operation of the LHD discharge. The NBI heating is carried out using five beams, i.e., three tangential negative-ion-source-based NBI beams with energy of 180 keV and two perpendicular positive-ion-source-based NBI beams with energy of 40 keV. The total heating power of NBI heating is now about 28 MW.
Many kinds of diagnostic systems have been installed on LHD and many plasma parameters have been measured. Although all the diagnostics are giving valuable information for understanding the behavior of LHD plasmas, the electron temperature and density profiles are especially important and the basis for analyzing many LHD data including spectroscopic data. Those are measured in LHD by YAG Thomson scattering (TS) system along the major radius at the mid plane of horizontally elongated plasma cross section [13]. The spatial and temporal resolutions are 12-25 mm and 10-100 ms, respectively. Three sets of interferometer systems of multichannel far infrared (FIR) laser interferometer [14], two-color millimeter-wave interferometer [15] and a CO2 laser imaging interferometer [16] are also used for the electron density measurement.
- 10 -
Table 1.3 Passive spectrometers in LHD
Name Type Grating (grooves/mm) range (Å) Spatial resolution 1.33-m visible
0.5-m visible 0.3-m visible 3-m VUV EUV_L1 EUV_L2 EUV_S1 EUV_S2 X-ray crystal XICS*
Czerny-Turner Czerny-Turner Czerny-Turner Normal incidence Grazing incidence Grazing incidence Grazing incidence Grazing incidence Johann
Johann
1800 100 1200 1200 1200 1200 2400 2400 4 crystals Quartz(110)
2000-8000 2000-10000 2000-9000 500-3100 30-650 30-650 10-130 10-130 1.7-4.0 3.94-3.96
26 mm (entire plasma) 26 mm (entire plasma) 26 mm (entire plasma) 20 mm (entire plasma) No
15 mm (entire plasma) No
15 mm (half of plasma) No (core plasma) 20 mm (entire plasma) *X-ray Imaging Crystal Spectrometer
In order to study the impurity behavior, many kinds of spectrometers working in different wavelength ranges have been developed and installed on LHD. The specifications of these spectrometers are listed in Table 1.3 [17]. The two visible spectrometers with focal length of 1.33 m and 0.5 m are used for study of edge hydrogen and helium behaviors. Another visible spectrometer with a short focal length of 0.3 m is used for the measurement of bremsstrahlung continuum profile. The absolute intensity calibration of all other EUV spectrometers is carried out based on the visible bremsstrahlung profile. Two EUV spectrometers named EUV_L2 and EUV_S2 working in different wavelength ranges of 30-650 Å and 10-130 Å are installed for the profile measurement of impurity lines, respectively, whereas other two EUV spectrometers named EUV_L1 and EUV_S1 are only used for the impurity monitor with high-time resolution of 5 ms. In the present study the EUV_L2 has been mainly used for two-dimensional measurement of impurity line emissions. The details of the spectrometer are explained in Chapter 2.
- 11 -
1.4 Edge magnetic field structure of LHD and impurity
transport in ergodic layer
Fig. 1.4 Magnetic field structure at horizontally elongated plasma cross section of (a) Rax=3.6 m (b) Rax=3.75 m and (c) Rax=3.9 m. The connection length of magnetic field lines, Lc, is indicated with color.
- 12 -
Fig. 1.5 Connection length of magnetic field lines, Lc, at (a) inboard X-point (b) outboard X- point and (c) top O-point at Rax=3.9 m (see Fig. 1.4(c)).
- 13 -
In tokamak, the scrape-off layer (SOL) locating outside the last closed flux surface (LCFS) is composed of open flux surfaces. In LHD, the edge magnetic field structure is much more complicated compared to the tokamak edge. The edge magnetic structure of LHD is illustrated in Fig. 1.4. There intrinsically exists a thick ergodic layer outside the LCFS consisting of stochastic magnetic field lines. The stochastic magnetic field is formed by the higher order Fourier components which are involved in the magnetic field produced by the helical coils. The thickness of the ergodic layer, erg, increases as the magnetic axis position is outwardly shifted from Rax=3.6 m to Rax=3.9 m. The thickness of ergodic layer in the poloidal cross section is minimal at the two O-points near the helical coils, e.g., erg=2 cm for Rax=3.6 m and erg=10 cm for Rax=3.9 m. The thickness is maximal at the two X-points, e.g., erg=10-20 cm for Rax=3.6 m. The connection length of magnetic field lines in the ergodic layer ranges in 10-2000 m which corresponds to 0.5-100 toroidal turns of the torus.
The ergodic layer is composed of two layers, i.e., stochastic layer and edge surface layer. Those are indicated in Fig. 1.4(c). The LCFS in LHD is defined as the outmost flux surface on which the deviation of magnetic field lines is less than 4 mm while it travels about 1000 m along the torus. Outside the stochastic layer region, there exists a region with multiple thin curved layers called edge surface layer which is created by radial movement of the X-point and high local shear based on large rotational transform. In the edge layer region, several island layers are embedded together with a poloidal mode number of 10 in the open flux surface. With increasing the minor radius, the poloidal mode numbers of the natural island layers decrease and the widths of islands increase. Eventually, the island layers overlap each other and the stochastic field layer is formed at the edge region of the LHD plasma. There is no clear separatrix in the edge plasma region of LHD. The field lines from stochastic region enter the edge surface layer and finally arrive at divertor plates passing through the vicinity of X-points after many toroidal circulations. The connection length from X-points to divertor plates is very short, e.g. order of plasma minor radius. Figure 1.5 shows the connection length of magnetic field
- 14 -
lines at inboard and outboard X-points and top O-point in Rax=3.9 m. The horizontal range in the figures is indicated with dashed lines in Fig. 1.4(c). From the figures we understand that the thicknesses of ergodic layer and the profile of connection length are completely different in the three poloidal positions. In the region denoted with 'A' in Figs. 1.4(c) and 1.5(a), the connection length is very short and the field lines are directly connected to the divertor plates, but not to the stochastic layer.
The particle and heat fluxes diffuse out of the core plasma through the LCFS and enter the SOL in tokamaks or the ergodic layer in LHD. Those are finally conducted to the divertor plates. However, the particle and heat transports in the ergodic layer are entirely different from those in the tokamak SOL because the magnetic field structure in the ergodic layer is fully stochastic and the magnetic field connection length is much longer compared to the SOL. Based on such a background in the edge plasma of LHD, 3-D edge plasma transport code, EMC3-EIRENE, has been developed in LHD to study the particle and heat transports in the ergodic layer [18]. The EMC3 code solves a set of Braginskii equations of mass, momentum and energy in arbitrarily magnetic field geometry. The EIRENE code solves a kinetic model of the neutral transport by simulating the recycling neutral at divertor plates.
The fluid equation of momentum balance parallel to magnetic field lines for impurity is given by
s T s
ZeE T V
m V s
n T n t
m V e i
s z i z z i z z
z
2 2
// //
//
// 1 0.71Z 2.6Z
, (1.7)
where z, i, and s denote the impurity with charge state Z, the bulk plasma ion and the coordinate along magnetic field line. The variables of Vi//, Vz//, s and E// denote the parallel velocities of background ion and impurity, impurity-ion collision time and parallel electric field, respectively. In this equation, Tz=Ti is assumed. The terms on the right hand side represent the impurity pressure gradient force, the friction force exerted by the
- 15 -
background parallel plasma flow, electrostatic force, electron and ion thermal forces called temperature gradient force. The dominant terms in the equation are the friction force at the second term and the ion thermal force at the fifth term. For the steady condition, therefore, the equation can be written by
s T Z m
V
V i
z s i
z// // 2.6 2 . (1.8)
The ratio of the friction force to the thermal force in eq.1.7 is thus given by
i i
i i i i
i i i
T T
M n T T k
V T n ce
thermalfor rce frictionfo
// //
5 . 2 0
) //
2 / 5
~(
, (1.9)
where ki0 and M are the parallel heat transport coefficient and the Mach number, respectively. The numerator and denominator represent convective and conductive energy fluxes, respectively. Since the background plasma flow is usually directed towards the downstream, i.e., from plasma edge to diverter plates, the friction force pushes the impurity to the divertor region, which enhances the impurity screening. On the contrary, the thermal force pushes the impurity to the upstream because the temperature gradient changes the collisionality along the magnetic field. Therefore, the impurity transport in the ergodic layer dominantly depends on the ratio of the friction force to the thermal force. In LHD, the carbon transport in the ergodic layer has been studied based on EMC3-EIRENE code. Results on the carbon density distribution and the force balance between friction and thermal forces are shown in Fig. 1.6 [19]. In the low-density discharge, the thermal force is dominant and pushes the carbon ion to the upstream. In the high-density discharge, however, the friction force becomes dominant instead of the thermal force and changes the force balance. As a result, the carbon ion moves to the downstream
- 16 -
1.5 Objective and structure of the thesis
In order to study the impurity behavior in the ergodic layer with three-dimensional magnetic field structure, it is necessary, at least, to measure the two-dimensional distribution of impurity line emissions. Since the impurity line emissions emitted in the ergodic layer are mainly in the EUV wavelength range, a space-resolved EUV spectrometer measuring upper half of the full vertical impurity profile is upgraded to the two-dimensional spectroscopic system. The two-dimensional EUV spectroscopy can be possible if the observation chord of the space-resolved EUV spectrometer is scanned vertically and horizontally. Therefore, two stepping motors are additionally installed on the EUV spectrometer system to change the view angle of space-resolved EUV spectrometer along vertical and horizontal directions. The two-dimensional distribution of
Fig. 1.6 (a) Carbon density distributions in ergodic layer at low (2x10¹⁹ m-3) and high (5x10¹⁹ m-3) electron densities defined at LCFS and (b) balance between friction and thermal forces.
- 17 -
impurity line emissions can be measured by horizontally scanning the spectrometer observation chord during single discharge at a fixed vertical spectrometer angle. In addition, the working wavelength of the space-resolved spectrometer is extended from 50- 500 Å to 30-650 Å to measure further impurity spectral lines. For the purpose the second stage for moving the CCD position is added to the original stage to make the CCD movement distance wider. Details of the upgrade on the space-resolved EUV spectrometer are explained in Chapter 2.
In Chapter 3, the full vertical profile and two-dimensional distribution are shown for typical impurity line emissions observed in LHD. In Chapter 4, the vertical profiles of HeII and CIV are analyzed at different toroidal and poloidal angles. It is found that the HeII is located at inner radial position compared to the CIV, whereas the ionization energy of HeII (Ei=54 eV) is lower than that of CIV (Ei=65 eV). The distance between HeII and CIV radial locations is nearly constant, i.e. Z4 mm, for different poloidal positions.
Two-dimensional measurement of electron temperature in the ergodic layer is of crucial importance to study the transport in the edge plasma of helical devices. However, there was no diagnostics to measure such the two-dimensional edge temperature distribution in the fusion research. A diagnostic method based on the intensity ratio between two line emissions is attempted to measure the two-dimensional electron temperature distribution in the ergodic layer of LHD. In Chapter 5, the vertical profile and two-dimensional distribution of electron temperature in the ergodic layer are measured using the line intensity ratio. The intensity ratio between two spectral lines with significant different excitation energy is given by
) ( )
exp( , ,
, ,
, , ,
,
e e
j g k g k
g k g
j g j g k
g j
g F T
kT E E
E E I
I
, (1.10)
- 18 -
where g,j is the collision strength. The ratio is sensitive to the change in electron temperature, if , , 1
e j g k g
kT E
E . Here, it is assumed that the two lines are emitted from
the same plasma volume. The most common line ratio for the temperature measurement is 2s-2p/2s-3p for Li-like ions. However, these line pairs have considerably different wavelengths, e.g., CIV 2s-2p (1550 Å)/2s-3p (312 Å). Then, the line ratio of CIV 2p-3d (384 Å)/2p-3s (420 Å) is used to measure the electron temperature profile in the edge boundary of ergodic layer. The result is compared with the temperature at divertor plates measured by Langmuir probe. NeVIII line ratio of 2s-3p (88 Å)/2p-3s (103 Å) is also adopted to measure the two-dimensional distribution of electron temperature near LCFS in the ergodic layer. The measured electron temperature profile is compared with the simulation.
The analysis of two-dimensional distribution of impurity line emissions brings us extremely important information on the impurity behavior in the ergodic layer. In Chapter 6, the vertical profile structure of impurity emissions near X-points are studied at different electron densities. Two-dimensional distribution of impurity line emissions is analyzed at different plasma axis positions and the line intensity near X-point is compared between inboard and outboard X-points. The experimental result is analyzed with 3-D edge transport code, EMC3-EIRENE. In Chapter 7, the thesis is summarized and the conclusion is given.
- 19 -
References
[1] J. Wesson, Tokamaks, 4th edition, Oxford University press, (2012). [2] S. Ishida, et al., Nucl. Fusion 51, 094018 (2011).
[3] R. Aymar, et al., Plasma Phys. Control. Fusion 44, 519 (2002). [4] A. Iiyoshi, et al., Nucl. Fusion 39, 1245 (1999).
[5] L. Wegener, Fusion Eng. Des. 84, 106 (2009).
[6] H.S. Bosch, Nucl. Fusion Lect. Notes Phys. 670, 445 (2005). [7] S. Morita, et al., Plasma Sci. Technol. 13, 290 (2011).
[8] E. Hinnov, et. al., Nucl. Fusion 18, 1305 (1978).
[9] B.C. Stratton, et. al., Fusion Sci. Technol. 53, 431 (2008). [10] T. Shimozuma. et al., Fusion Eng. Des. 53, 525 (2001). [11] T. Mutoh, et al., Fusion Eng. Des. 26, 387 (1995).
[12] M. Fujiwara, et al., Plasma Phys. Control. Fusion 41, B157 (1999). [13] K. Narihara, et. al. Rev. Sci. Instrum. 72, 1122 (2001).
[14] K. Kawahata, et al., Rev. Sci. Instrum. 70, 707 (1999). [15] K. Kawahata, et al., Rev. Sci. Instrum. 70, 695 (1999). [16] K. Tanaka, et al., Rev. Sci. Instrum. 72, 1089 (2001). [17] M. Goto, et al., Fusion Sci. Technol. 58, 394 (2010).
[18] M. Kobayashi, et al., Contrib. Plasma Phys. 48, 255 (2008). [19] M. Kobayashi, et al., Nucl. Fusion 53, 033011 (2013).
- 20 -
- 21 -
Chapter 2
Development of EUV spectrometer system for 2-D
measurement
2.1 Introduction
Impurities play an important role for the experimental study of magnetic confinement fusion research in the viewpoint of radiation loss included bremsstrahlung continuum in addition to fuel dilution. The plasma performance is influenced by the impurities not only in the plasma core but also in the plasma edge including the scrape-off layer. Therefore, the study of impurity behavior is important to improve the plasma performance. The line emissions from impurities are frequently used for the impurity diagnostics. For the purpose many kinds of impurities are used by injecting an solid impurity pellet and puffing a noble gas instead of intrinsic impurities such as carbon and iron [1,2]. Since the electron temperature in current magnetic fusion devices is significantly high, most of the impurity line emissions are radiated in vacuum ultraviolet (VUV: 500-2000 Å) and extreme ultraviolet (EUV: 10-500 Å) wavelength ranges [3].
A number of EUV spectrometers have been developed for the impurity diagnostics of fusion plasmas. A survey poor resolution extended domain spectrometer (SPRED) has been widely used with an aberration-corrected holographic toroidal grating [4]. The emission lines from both the light and heavy impurities in the wavelength range of 100-
- 22 -
1100 Å can be monitored with SPRED for the impurity diagnostics in tokamak discharges, while the spectral resolution is considerably poor. Following the same principle, a high efficiency EUV overview spectrometer (HEXOS) covering 25-1600 Å region is developed for Wendelstein (W7-X) stellarator [3]. Recently, two high-resolution grating spectrometers called XEUS (X-ray and EUV spectrometer) and LoWEUS (Long- wavelength and EUV spectrometer), which work in the 5-400 Å region, have been installed on National Spherical Tokamak Experiment (NSTX) [5]. Two flat-field EUV spectrometers called EUV_Short and EUV_Long with varied line spacing (VLS) groove holographic grating have been also developed in Large Helical Device (LHD) to measure the wavelength ranges of 10-130 Å and 50-500 Å, respectively [6,7]. All of the EUV spectrometers mentioned above have been mainly used as the simple impurity monitor.
Although most of the EUV spectrometers installed on the fusion devices do not have any spatial resolution, a few EUV spectrometers have the function of the spatial resolution. It is possible to measure one-dimensional distribution of impurity lines using a spherical concave grating with large astigmatism at grazing incidence. In DIII-D tokamak, an EUV spectrometer with spatial resolution has been developed by utilizing the large astigmatism inherent to a concave grating based on the Rowland mounting near-grazing incidence [8,9]. The spatially resolved measurement in the EUV range is also possible for the flat-field VLS grating. A space-resolved EUV spectrometer working in 60-400 Å has been developed using the VLS grating and installed on LHD to observe one-dimensional impurity line emission profile [10]. Such spectrometers have an enough performance to study the impurity transport in the core plasma in which the magnetic surfaces are clearly formed. The observed line-integrated intensity profile can be easily reconstructed into the local emissivity as a function of the magnetic surface based on Abel inversion technique. However, if the plasma has no poloidal and toroidal symmetries, the impurity transport can not be sufficiently studied from the radial profile measured only at some toroidal position.
The magnetic configuration for plasma confinement in LHD has three-dimensional structure which characterizes one of typical features in helical devices with external coil
- 23 -
system. In particular, the three-dimensional effect is remarkably emphasized in the edge magnetic structure consisting of stochastic magnetic field lines, so called 'ergodic layer', which are caused by higher orders of Fourier components in helical coils and overlapping of natural islands due to the presence of radial magnetic fields. A two-dimensional measurement with good spatial resolution is therefore required to study the impurity transport in the ergodic layer with three-dimensional structure. However, an optical spectroscopy using visible light is not applicable to the edge plasma diagnostics of LHD because the edge temperature is considerably high. Typical edge electron temperature of LHD plasmas range in 20 eV at the edge boundary of ergodic layer and 100-500 eV at the last closed flux surface (LCFS) mainly as a function of electron density and magnetic filed strength. The two-dimensional measurement of impurity line emissions in the EUV range is strongly desired to study the impurity transport in the ergodic layer. For the purpose the space-resolved EUV spectrometer for vertical profile measurement is improved by adding a new mechanism to observe the two-dimensional distribution of impurity line emissions in edge plasma of LHD. In this chapter the instrumentation of the space-resolved EUV spectrometer for two-dimensional measurement is presented with typical examples of two- dimensional distributions of EUV line emissions observed from LHD edge plasma. The present result shows the first attempt for the two-dimensional measurement in the EUV wavelength range to study plasmas with stochastic magnetic field.
LHD coil system consists of continuous superconducting helical coils with poloidal pitch number of ℓ=2 and toroidal pitch number of m=10 and three pairs of superconducting poloidal coils. The magnetic surfaces have three-dimensional structure due to the absence of toroidal symmetry in the helical coils. The pair of helical coils creates a toroidal plasma with elliptical poloidal cross section. The elliptical plasma poloidally rotates quickly when it moves toroidally. A schematic view of the LHD plasma within LCFS is shown in Fig. 2.1. The major and average minor radii in the standard configuration of LHD with maximum plasma volume is R=3.6 m and a=0.64 m, respectively. Here, the diameters in long and short axes of the elliptical plasma cross section are lmax=1.81 m and lmin=0.89 m,
- 24 -
respectively. The value of in the figure denotes the toroidal angle and =0o is defined at horizontally elongated plasma cross section. The position of LCFS in LHD is defined by the outermost flux surface on which the deviation of the magnetic field line is less than 4 mm while it travels 100 turns along the torus [11].
In LHD the LCFS is surrounded by a thick stochastic magnetic field layer called ergodic layer. The structure of the ergodic layer is shown in Fig. 2.2 at magnetic axis position of Rax=3.9 m. The ergodic layer mainly consists of stochastic magnetic field lines with lengths from 10 to 2000 m, which correspond to 0.5-100 toroidal turns in the LHD. The thickness of the ergodic layer, erg, varies with the poloidal and toroidal angles exhibiting a complicated three-dimensional structure. The minimum thickness of the ergodic layer is appeared at two poloidal locations near the helical coils, which are here defined as 'O-point'. The minimum erg, which strongly depends on the Rax, are 2 cm for
Fig. 2.1 Three-dimensional schematic view of LHD plasma with poloidal pitch number of ℓ=2 and toroidal pitch number of M=10. The symbols of φ and X denote toroidal angle and the coordinate connecting torus center and LHD port center of #10-O.
- 25 -
Rax=3.60 m and 10 cm for Rax=3.90 m at horizontally elongated plasma cross section of
=0, while erg is different at inboard and outboard sides in vertically elongated cross section of =18, i.e., 12 cm at inboard side and 5 cm at outboard side in Rax=3.90 m as seen in Fig. 2.2(b). In contrast to it, the maximum erg is given in poloidal location near X- points at low field sides. The values of erg at horizontally elongated plasma cross section range in 10-20 cm at Rax=3.60 m and 30-45 cm at Rax=3.90 m taking different values at inboard and outboard X-points. The erg increases with not only Rax but also β value ( plasma pressure/magnetic pressure) [11]. The magnetic field lines in the ergodic layer have enough toroidal lengths and radial thickness to confine the edge plasma, whereas they frequently repeat radial movement during toroidal turn. Therefore, the electron temperature and density in the ergodic layer are considerably high and range in 10-500 eV and 1-10x1013 cm-3, respectively.
In the outside of ergodic layer, there exist four intrinsic divertor legs connecting X- points region to divertor plates. The whole particles coming out the plasma are transferred through the divertor legs and reach the divertor plates made of carbon. In order to study the three-dimensional edge transport, the carbon line emissions are usually used in LHD because of the high intensity [12].
- 26 -
Fig. 2.2 Magnetic field structures of LHD at (a) horizontally elongated plasma cross section (=0) and (b) vertically elongated plasma cross section (=18) in magnetic axis position of Rax=3.9 m. Different colors in ergodic layer mean different magnetic field connection length in unit of one toroidal turn of 24.5 m.
(a) φ=0
o(b) φ=18
o- 27 -
2.2. Space-resolved EUV spectrometer system for 2-D
measurement
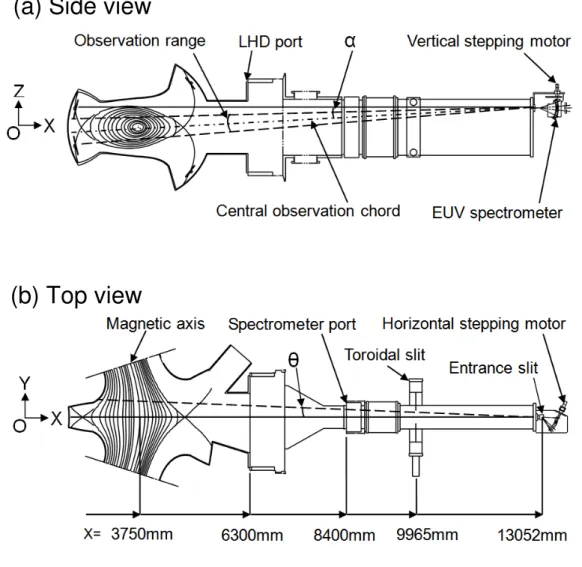
Fig. 2.3 Schematic view of EUV spectrometer system in LHD from (a) side view and (b) top view. The symbols of and denote vertical angle and horizontal angle against central chord of EUV spectrometer, respectively. Distances indicated in the bottom of (b) express X values in Fig. 2.1.
(b) Top view
(a) Side view
- 28 -
In LHD many kinds of spectrometers working in visible, VUV and EUV ranges have been installed for monitoring the impurities and studying the impurity transport [13]. The space-resolved EUV spectrometer working in 60-400 Å range is also installed on LHD for vertical profile measurement [10]. The spectrometer has been recently improved for the two-dimensional measurement by adding a new mechanism to scan the observation chord horizontally during single discharge. The schematic diagram of the space-resolved flat-field EUV spectrometer system after modification is illustrated in Fig. 2.3. The modified space-resolved EUV spectrometer is also installed on LHD perpendicular to the toroidal magnetic filed at a distance of 9 m from the plasma center to observe the vertical profile at the horizontally elongated plasma cross section (=0o) as well as the former EUV spectrometer. A vertical stepping motor is used to change the vertical observation range in the poloidal plasma cross section, as shown in Fig. 2.3(a). The position of central observation chord for the measurement along vertical direction is expressed as vertical angle, α, which is defined by an angle from the horizontal observation chord of the spectrometer. A horizontal stepping motor is used to change the horizontal angle, θ, of the observation chord, which is defined by an angle from the central chord with φ=0 at the horizontal elongated plasma cross section, as seen in Fig. 2.3(b). A toroidal slit with a rectangular-corrugated edge, which is used for the angle calibration of all the observation chords, is placed between the plasma and EUV spectrometer [14].
The space-resolved EUV spectrometer mainly consists of an entrance slit, a spatial resolution slit placed in front of the entrance slit, a gold-coated varied-line-spacing (VLS) grating and a charge-coupled device (CCD) detector. The entrance slit of 100 µm is used in the present study, since the spectral width is less than 5 pixels even in such a wider entrance slit. In the binning mode operation of CCD five pixels are summed and converted into one channel. The spectral resolution of 0.22 Å is obtained at 200 Å in the full image mode of CCD. The vertical spatial resolution of 10 mm is obtained when the spatial resolution slit with 0.2 mm width is used. The present width of the spatial resolution slit is suitable for the edge impurity measurement, but a wider spatial slit is better for the core
- 29 -
impurity measurement because good spatial resolution is not necessary in most of the experiments and the spectrometer brightness is of course increased. In practice, it is found that the core impurity line intensity is much weaker than the edge impurity intensity when the intensity per CCD vertical channel is compared between the core and edge impurity lines. In the present experiment the spatial resolution slit of 0.5 mm in width is adopted to measure both the impurity emissions from core and edge plasmas.
A holographic laminar-type VLS grating (Shimadzu 30-002: 1200 grooves/mm) with effective area of 26 mm in groove length and 46 mm in groove distance is used to make the flat focal plane. The radius of the grating curvature is 5606 mm. This large curvature can be treated as a flat plane and guarantees a straightforward reflection of the EUV emission on the whole area of grating. The angle of incidence fixed at 87o covers a wavelength range of 60-400 Å when the flat focal plane is exactly defined in the calculation. However, the practical range of the wavelength interval can be considerably wider than such a calculated range.
A back-illuminated CCD (Andor DO420-BN, 26.6×6.6 mm2 area) with 1024×255 pixels is adopted as the multi-channel detector with flat surface. An electrical insulator is placed between the detector and the spectrometer, since the spectrometer has to be grounded. A pulse motor is used for the movement of the CCD detector position along the focal plane to change the wavelength range to be measured. The CCD detector can be cooled down to -70oC by a Peltier device to reduce the thermal noise. Generally, it is operated at -20oC, at which the thermal noise is sufficiently removed. The sub-image mode is used for the routine measurement on impurity profile diagnostics. The sampling time is usually set to 200 ms when the CCD is operated by the binning mode at 5 pixels. Therefore, the radial profiles with 204 channels are measured for the present space- resolved EUV spectroscopy. The vertical range of about 50 cm can be simultaneously observed, of which the range corresponds nearly half of the whole vertical length at horizontally elongated plasma cross section.
- 30 -
Fig. 2.4 Schematic drawings of EUV spectrometer system in (a) side view and (b) top view. Pivot is scanning center of EUV spectrometer
(a) Top view
(b) Side view
- 31 -
The EUV spectrometer is connected to a big differential pumping chamber following the LHD port through a small bellows, as shown in Fig. 2.3. The detailed structure of the EUV spectrometer is shown in Fig. 2.4. The EUV spectrometer can be vertically and horizontally moved by vertical and horizontal stepping motors, respectively. The electric motors are covered with 1 mm thick iron plate to avoid the effect of magnetic leakage from the LHD coil system. In order to fix the pivot position during the movement the spectrometer is placed on two circular rails, of which the center is set to the pivot. Therefore, the central observation chord through the grating center always goes through the pivot. The radii of the vertical and horizontal rails are 400 mm and 325 mm, respectively. The vertical and horizontal positions of the spectrometer moved by the two stepping motors are accurately measured by an electric scale as ZEUV and YEUV, respectively. The vertical and horizontal angles of all the observation chords can be accurately calibrated by the toroidal slit with rectangular-corrugated slit. The details of the calibration are described in ref.14.
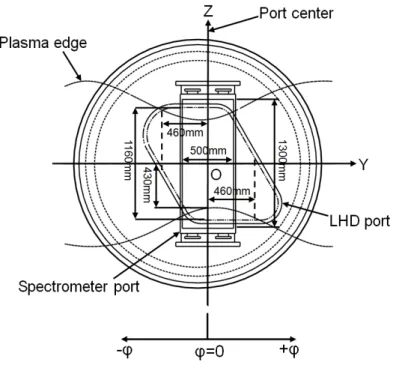
The observation ranges in vertical and horizontal directions are limited by both the spectrometer and LHD ports. Schematic view of the ports is shown in Fig. 2.5. The LHD port has a diamond shape with inside vertical size of 1160 mm due to the presence of helical coils. The spectrometer port has a rectangular shape with inside horizontal and vertical sizes of 500 mm and 1300 mm, respectively. Therefore, the observation area is also limited at the top-right and bottom-left corners of the LHD port. Here, it is noticed that the position of the spectrometer port is 2100 mm behind the LHD port, as shown in Fig. 2.3. Considering the positions among the spectrometer, the spectrometer port, the LHD port and the plasma, the horizontal plasma observation length practically ranges from Y=-460 mm to Y=+460 mm at the midplane of Z=0 mm, of which the range is indicated in Fig. 2.5 with two vertical dashed lines. These values correspond to the toroidal angles of
=7.0 (see Figs. 2.1 and 2.3). In the figure, the projection of plasma edge at LCFS is also traced for the magnetic axis position of 3.75 m. The minimum distance of 430 mm from the plasma edge to the midplane is given at the horizontally elongated plasma cross
- 32 -
section of =0. Then, the detailed information on the plasma edge near the X-points can be observed at top-left and bottom-right corners.
The vertical observation ranges in different poloidal cross sections are shown in Fig. 2.6 against the magnetic configuration with plasma axis position of Rax=3.75 m. Before improving the performance of the space-resolved EUV spectrometer the vertical profile of EUV line emissions has been only observed at the horizontally elongated plasma cross section with the toroidal angle of =0, as shown in Fig. 2.6(b). In this profile measurement most of the observation chords pass through both the X-point regions at inboard and outboard sides, while a few edge observation chords can measure the radial profile at both the top and bottom O-points with enough spatial resolution (see also Fig.
Fig. 2.5 Structures of rectangular EUV spectrometer port and diamond LHD port. The projection of LHD edge plasma boundary is plotted as 'Plasma edge'.
- 33 -
2.2(a)). The magnetic field structure near the inboard and outboard X-points in LHD is considerably different. It is difficult for the original space-resolved spectrometer to study the edge impurity behavior at the X-point region in details because the line emissions from inboard and outboard sides are overlapped along the same observation chord. Then, the space-resolved EUV spectrometer has been altered in order to improve this situation by adding toroidal scanning mechanism.
Fig. 2.6 Vertical observation ranges of space-resolved EUV spectrometer at toroidal angles of (a) φ=3.7o (b) φ=0o (c) φ=3.7o.