Isolated T Tauri Stars Toward the Taurus-Auriga
Star Forming Region
Satoshi TAKITA
Department of Space and Astronautical Science,
School of Physical Sciences,
The Graduate University for Advanced Studies
January 4, 2011
Acknowledgements
First of all, I would like to thank my supervisor, Hirokazu Kataza, for always giving me advices and opportunity to make this kind of study. His great knowl- edge on astronomy and critical comments always improved my study. Without his instructive advice, I would hardly have finished this thesis. I am very grateful my sub-supervisor, Issei Yamamura for supporting my work. I thank Yoshimi Kitamura for their instructive advice on this work. I also acknowledge the col- laborators, Munetaka Ueno, Akiko Kawamura, Daisuke Ishihara, Shinki Oyabu, Yoshifusa Ita, Hideaki Fujiwara, and Takafumi Kamizuka. I thank Mitsuhiko Honda, Yoshiko K. Okamoto, and Takashi Onaka for their scientific advice. I also appreciate Norio Ikeda and Chisato Yamauchi for their suggestive comments about data handling and programming techniques. And, I would like to thank all of the members of Department of Infrared Astrophysics/Institute of Space and Astronautical Science. Finally, I wish to thank my family for their support in both mental and financial ways.
1
Abstract
It is fundamental to investigate the origin of low-mass stars and planets in order to answer how the Sun and the Earth were formed. Many surveys of young stellar objects (YSOs) have been performed toward molecular clouds in wide wavelengths range from optical to radio wavelengths. On the other hand, substantial amount of weak-line T Tauri stars (WTTSs) have been found far away from active molecular clouds by the X-ray observations. This indicates that many isolated T Tauri stars (TTSs) are thought to be still unexplored. Therefore, unbiased survey of YSOs are required in order to understand star formation process. For this purpose, we have carried out a survey of TTSs with the all-sky survey data by the Japanese infrared astronomical satellite, AKARI. The first step of our observational study is the survey of isolated TTSs at mid-infrared (MIR) wavelengths with the AKARI All-Sky Survey. Since TTSs exhibit infrared excess emission from circumstellar disks, we first studied previ- ously known TTSs to perceive what colours do TTSs show. Among 516 previously known TTSs laying in a 1800-square-degree region around the Taurus star form- ing region, we detected 132 TTSs in the MIR. To construct more complete data sets, we also used other all-sky surveys such as 2MASS (the Two-Micron All- Sky Survey; near-infrared (NIR) wavelengths) and UCAC3 (the third US Naval Observatory (USNO) CCD Astrograph Catalogue; optical wavelengths). It is indispensable to distinguish TTSs from possible contamination of other types of objects such as Asymptotic Giant Branch (AGB) stars (carbon and OH/IR stars), post-AGB stars, planetary nebulae (PNe), as well as galaxies, that also show infrared excess emission. Using the MIR colour, we discarded most of AGB stars from the sample. We also separated most of galaxies from TTSs using the colour-magnitude diagram of optical–NIR wavelengths data. Finally, we ex- tracted TTS candidate sources with IR excess emission, avoiding contamination from normal (main-sequence) stars, which do not present excess emission. About 40% and 5% of AKARI detected known Classical T Tauri stars (CTTSs) and Weak-line T Tauri stars (WTTSs) satisfy these criteria, respectively. On the basis of our criteria, we selected 176 out of 14 725 AKARI sources toward the Taurus region. There are 150 previously known sources, and 117 of them (about 80%) are YSOs including other star forming regions near the Taurus. The re- maining 26 sources are newly found TTS candidates. We performed follow-up optical spectroscopic observations for these sources to determine their youth from Lii absorption line. We confirmed that 23 out of 27 (including 1 possible binary) sources have sufficient Li absorption to be classified as TTSs. This validate the usefulness of our criteria. From the line width of Hα emission, we classified 23 new TTSs into 15 CTTSs and 8 WTTSs. We obtained 9 new isolated CTTSs
and 6 new isolated WTTSs. There are only 8 isolated CTTSs previously, and we increased the number of them to 17.
We found that the origin of most of isolated TTSs is most probably small clouds around the Taurus molecular cloud, from their proper motions determined by UCAC3. For the 23 new TTSs, at least 5 sources seem not to be related to known star forming regions, considering their spatial distributions and directions of proper motions. Furthermore, the dispersion of known/new TTSs’ proper motions is ∼15 km s−1. This value far exceeds the typical value of ∼1 km s−1, for the case that sources were originated from a cloud with size of ∼1 pc. This fact suggests that not all TTSs were born in the molecular cloud cores which were gravitationally bound to the Taurus molecular cloud. If TTSs were formed in not only the Taurus molecular cloud but also small clouds which do not relate to the Taurus, the large velocity dispersion is thought to come from the inter- cloud velocity dispersion. We investigated the Hi clouds in the region, and found that the dispersion in radial velocity of the clouds is ∼12 km s−1, comparable to the dispersion of the TTS proper motion. Considering that the molecular clouds are formed from Hi clouds, inter-cloud velocity dispersion of molecular clouds is expected to be similar, and stars originated from these clouds are also expected to show large velocity dispersion.
We also verify whether there are any differences between TTSs associated to active clouds and those isolated from clouds. The CTTS/WTTS ratios of AKARI detected TTSs are 81/31 and 12/16 for inside and outside the clouds, respectively. If we consider the typical age of a CTTS (∼1 Myr) and WTTS (∼10 Myr), TTSs associated to the clouds seem to be relatively young. We determined disk masses using the AKARI far-infrared data, and found no remarkable difference. We further classified AKARI detected TTSs with their slopes of the SED in the NIR– MIR wavelengths into three kinds of sources; those with envelopes, with disks, and without surrounding materials. For TTSs in our sample and associated to clouds, about a quarter of them have envelopes and a few % of them are naked. On the other hand, for isolated TTSs, a few % of them have envelopes and about one third of them are naked. This also supports the idea that TTSs associated to the clouds are relatively younger than those isolated from the clouds.
We conclude that most of isolated TTSs toward the Taurus were born in iso- lated small clouds. Considering the fraction of known TTSs, about 30% of TTSs toward the Taurus were born as isolated. This implies that the star formation in small isolated clouds occupies significant fraction in the low-mass star formation activity. We find that circumstellar disks of isolated TTSs are more evolved than those of associated TTSs.
2
Contents
1 INTRODUCTION 3
1.1 Scenario for Low-Mass Star Formation . . . 3
1.1.1 Circumstellar Disk around TTS . . . 4
1.2 Surveys and Spatial Distributions of YSOs . . . 5
1.2.1 Isolated TTSs . . . 6
1.3 Star Formation in Globules and Small Clouds . . . 6
1.4 Purpose of this Thesis . . . 7
1.5 Target Region . . . 8
2 DATA SETS 14 2.1 AKARI . . . 14
2.1.1 The IRC All-Sky Survey . . . 15
2.1.2 The FIS All-Sky Survey . . . 15
2.2 Input TTSs Toward the Taurus-Auriga Region . . . 16
2.3 Catalogued Sources Toward the Taurus-Auriga Region . . . 17
2.4 Archival Data . . . 18
2.4.1 Near-Infrared data . . . 18
2.4.2 Optical data . . . 19
3 RESULTS 26 3.1 Detections of Previously Known T Tauri Stars with AKARI . . . 26
3.1.1 Comparisons to the traditional IRAS survey . . . 39
3.1.2 Comparisons to the Spitzer data . . . 39
3.2 Selection of AKARI TTS candidates . . . 40
3.2.1 Other types of sources in the whole sky . . . 41
3.2.2 Removal of AGB stars . . . 42
3.2.3 Removal of post-AGB stars, PNe, and galaxies . . . 43
3.2.4 Selection of TTSs . . . 43
3.3 New TTS candidates . . . 44
3.3.1 Evaluation of the criteria . . . 44
3.3.2 Comparison with other methods . . . 44
3.3.3 Characteristics of the New TTS Candidates . . . 45
3.3.4 Follow-up Observations of the New TTS Candidates . . . . 53 1
4 DISCUSSION 62
4.1 The Origin of the Isolated CTTSs . . . 62
4.2 Disks of Isolated TTSs . . . 66
5 SUMMARY 93 A The data reduction tools for the AKARI IRC slow-scan obser- vations 95 A.1 IRC slow-scan mode . . . 95
A.2 Data packages of the IRC slow-scan . . . 96
A.3 AKARI data Reduction tools for the IRC Slow-scan (ARIS) . . . 97
A.3.1 Reset anomaly correction . . . 97
A.3.2 Linearity correction . . . 98
A.3.3 Differentiation . . . 99
A.3.4 Dark subtraction . . . 99
A.3.5 Flat fielding . . . 99
A.3.6 Masking bad pixels . . . 99
A.3.7 Image reconstruction . . . 99
A.4 Self-pointing reconstruction . . . 100
A.5 Flux calibration . . . 100
A.5.1 Observed standard stars and data processing . . . 100
A.5.2 Estimation of the in-band flux density . . . 101
A.5.3 Conversion factor . . . 101
A.5.4 Comparison with the AKARI IRC PSC . . . 101
B AKARI FIS slow-scan observations of Weak-line T Tauri stars around the Chamaeleon region 114 B.1 Observations and Data Reduction . . . 114
B.2 Results and Discussion . . . 115
2
Chapter 1
INTRODUCTION
1.1 Scenario for Low-Mass Star Formation
Stars are the fundamental constituents of the universe, and hence understand- ing the star formation process is one of the most important issues in astronomy. The star formation occurs in molecular clouds which consists of molecular gas and dust. The typical clouds have size of ∼10–100 pc, mass of 103–105 M⊙, and density of 102–103 cm−3. Inside the clouds, there are relatively dense regions with densities of 103–105 cm−3 and sizes of ∼1 pc, which are called clumps. Fur- thermore, the clumps consists of several denser condensations, which are called molecular cloud cores or prestellar cores, with densities of 105–106 cm−3 and sized of ∼0.1 pc. New stars are thought to be born through the gravitational collapse of the cores. The overall star formation is roughly classified into the two modes of the ‘isolated star formation’ and the ‘cluster formation’. In the first case, a star with a mass less than a few M⊙ spontaneously forms from an isolated core, as in the Taurus molecular cloud. In the second case, many stars with masses of 0.1–30 M⊙ simultaneously form as a cluster in a clump, as in the Orion molecular cloud. Although almost all the stars (more than 90%) in our Galaxy are thought to form as clusters (Lada et al. 1991), ‘cluster formation’ is less understood due to the large distance, small numbers of high mass stars, and the short lives of high mass stars.
The most successful scenario for isolated low-mass star formation is illustrated as follows (see Figure 1.1). After the collapse of molecular cloud cores, the proto- stellar nucleus is formed at the centre, and the inside-out collapse of the core gas is predicted to occur in the free-fall time-scale. In this earliest stage, the central protostar is classified as a Class 0 object on the basis of the shape of Spectral Energy Distribution (SED); since the Class 0 source is typically obscured by the dense circumstellar gas and dust, the stellar emission cannot penetrate the core, and as a result, the SED of the Class 0 source becomes a cold blackbody-like spectrum with a peak at sub-millimetre wavelengths. The lifetime of the Class 0
3
stage is estimated to be ∼ 104 years, which is one order of magnitude shorter than the free-fall time of the core. At this stage, in addition to the mass infall, energetic jet and outflow are also launched.
After the infall of a major fraction of the core material towards the central protostar, the protostar is classified as a Class I object, whose lifetime is estimated to be ∼ 105 years, which is comparable to the free-fall time of the core. At this stage, the protostar usually has disk-like envelopes with size of a few × 1000 AU, and outflow in the polar directions. Since the emission from the envelope is dominant, the SED of Class I becomes hotter than that of Class 0. One of the most important roles of the outflow is to carry away the angular momentum from the prestellar core to advance the mass accretion into the central protostar. On the other hand, owing to the slow rotation of the prestellar cores, a disk with radii of ∼100 AU form at the centre of the infalling envelope. The core material does not directly accrete to the central star, but lands on the disk through the envelope, and finally accretes on to the central star.
After almost all the core material falls into the disks or are swept away by the outflow, the central star with the disk becomes visible at optical wavelengths. This object is classified as a Classical T Tauri Star (CTTS), or a Class II object. The circumstellar disk is thought to be in the turbulent state (i.e., accretion disk), and the mass accretion to the central star continues through the disks. The SED of Class II consists of the stellar blackbody radiation and the thermal emission from its disk at Near-Infrared (NIR) to millimetre wavelengths. The lifetime of this stage is ∼ 106 years.
In the next stage, the central star is classified as Weak-line T Tauri Star (WTTS) or a Class III object. During this stage, the disk material is thought to be consumed for building planets, and the disks are mostly dissipated. The SED of Class III is almost equal to the blackbody with a stellar temperature. The lifetime of WTTSs is ∼ 107 years, i.e., the Kelvin-Helmholtz time-scale which is an estimate of how long a given star would shine by releasing its gravitational potential. After this stage, the central star becomes a main-sequence (MS) star, and the nuclear fusion occurs in the innermost part of the star.
1.1.1 Circumstellar Disk around TTS
The pioneering studies of the disks are the IRAS (the Infrared Astronomical Satellite) and millimetre continuum surveys towards the Taurus-Auriga region (Strom et al. 1989, Beckwith et al. 1990). Strom et al. (1989) reported about a half of CTTSs have the excess emission at the infrared wavelengths stronger than that expected from their photosphere. The excess emission is well explained as the thermal emission from the circumstellar disks heated by the central stars. This discovery demonstrated that the disks are common around young stars. Beckwith et al. (1990) also found that a similar fraction of stars have the excess emission at the 1.3 mm wavelength, and derived the disk masses ranging from
4
0.001 to 0.1 M⊙. The mass range strongly supports the minimum-mass solar nebula, which is a total mass of solar composition material that would be needed to produce the observed material in the planets (Hayashi et al. 1985). Kitamura et al. (2002) performed an imaging survey of the protoplanetary disks around single T Tauri stars with 2 mm continuum emission. They found the radial expansion of the disks with decreasing Hα luminosity, a clock for the disk evolution, and diversity in the physical properties of the disks.
At the next WTTS phase, the disk emission becomes too weak to be detected with the current telescopes. Since the age of the WTTSs is of the order of 10 Myr, when theoretically predicted phase that the planet formation occurs, it is impor- tant to understand the disk properties around WTTSs with ∼10 Myr. After the launch of Spitzer (the Spitzer Space Telescope), many surveys for searching disks have been performed. The two Spitzer Legacy project, FEPS (the Formation and Evolution of Planetary Systems) and c2d (From Molecular Cores to Planet Forming Disks), have surveyed many PMS stars (Silverstone et al. 2006, Pad- gett et al. 2006, Cieza et al. 2007). From the FEPS survey, 5/74 young stars (3–30 Myr) have the strong (near-)IR excess, but 4 of which have the ages of 3–10 Myr (Silverstone et al. 2006). Padgett et al. (2006) and Cieza et al. (2007) observed more than 300 TTSs, and found that ∼20% of the WTTSs have the IR excess emission at the wavelengths of 3.6–8.0 µm, but no IR excess for the stars older than 10 Myr. Consequently, it is shown that the disk dissipation time scale is about 10 Myr.
1.2 Surveys and Spatial Distributions of YSOs
In the previous section, we showed the overview of the star and planet forma- tion process and the classification of a Young Stellar Object (YSO) based on the SED. In this section, we mention the spatial distribution of YSOs.
Since star formation occurs in molecular clouds, many YSOs are discovered inside the clouds. Protostar was first found by its strong infrared (2.2–20 µm) emission (Mendoza & Eugenio 1966, Becklin & Neugebauser 1967). Many obser- vations have been done for surveying protostars toward molecular clouds owing to the improvements in infrared detector technology. The IRAS discovered many infrared sources with SEDs peaking at 60–100 µm, i.e., protostars (Beichman et al. 1986). A T Tauri star was originally identified as a late-type star with strong emission lines and irregular light variations associated with dark or bright neb- ulosities. Most of these classical TTSs were discovered from Hα surveys toward dark clouds (e.g., Herbig & Bell 1988). Walter & Kuhi (1981) found another type of TTSs from an X-ray observations called as weak-line TTSs due to their weak Hα emission. The borderline of CTTS and WTTS is an Hα equivalent width of
−10 ˚A. Furthermore, the Spitzer Space Telescope have found many low-luminous (or heavily embedded) protostars and TTSs, recently (e.g., Evans et al. 2009).
5
1.2.1 Isolated TTSs
Although many YSOs were discovered, these surveys were biased toward cloud region. However, Neuh¨auser et al. (1995a) have found that substantial amount of WTTSs are sequestered in relatively wide area of ∼ 100◦ region including the Taurus-Auriga star forming region, using the X-ray observations of Roentgen Satellite (ROSAT). Many surveys of TTSs based on the ROSAT were carried out in nearby star forming regions such as the Taurus (Wichmann et al. 1996, Magazz`u et al. 1997, Li & Hu 1998) and Chamaeleon (Alcala et al. 1995) (see Figure 1.2). These surveys found a large number of T Tauri stars. One of the interesting results of the X-ray selected TTS surveys is that a large number of TTSs have been found far away from the molecular clouds. This situation can be interpreted by following three ideas (Feigelson 1996).
• TTSs have moved with their proper motions of ∆v ∼1 km s−1, taking over the thermal velocity dispersions of the natal cloud gas. Feigelson (1996) suggested that if stars have an isotropic Gaussian velocity dispersion with
∆v ∼ 1 km s−1, it is sufficient to explain the spacial distributions of the widely dispersed WTTSs. A star travelling 1 km s−1 in the plane of the sky can move 10 pc (4.◦2 at distance of 140 pc) in 10 Myr.
• TTSs were born in cloudlets or small clouds, and the cloudlets have already dissipated. Since substantial number of isolated WTTSs were known to be too young to move far away from active clouds, Feigelson (1996) suggested this second mechanism. The TW Hya group may be an example where the entire cloud has entirely disappeared.
• TTSs were dynamically ejected with high-velocity by gravitational inter- actions with other stars. Although this is the other idea for young stars appearing far from the cloud, it seems an unacceptable model because of the number of these kind of stars is expected too small.
So, how many stars are born in cloudlets or small clouds? If this is the case, number of isolated CTTSs should exist. Since only a few CTTSs were found, we cannot contradict that isolated CTTSs are dynamically ejected from active clouds.
1.3 Star Formation in Globules and Small Clouds
Although most star formation occurs in giant molecular clouds, numerous small clouds and Bok globules are now known to have a few young stars (Reipurth 2008). These small clouds and Bok globules are thought to be birthplaces of isolated TTSs. The distinction between a Bok globule and a small cloud is diffuse. The term ‘globule’ was named by Bok & Reilly (1947), for small (∼ 10′),
6
round, dense dark nebulae, which are seen in contrast against bright Hii regions or background stars. Furthermore, a number of interesting star forming clouds, which are similar to Bok globules in size, also exist. Reipurth (2008) denoted these sources as ‘small clouds’. In this thesis, we treat globules, small clouds, and cloudlets are the same one.
Many Bok globules are known across the sky, and small clouds are found even more commonly. Despite their numbers, these small objects are not an important contributor to the production of low-mass stars in our Galaxy, accounting for at most a few percent (Reipurth 1983). The importance of these regions lies mostly in their simplicity, which allows us to study the formation of one or a few stars without the confusion that often complicates observations of richer regions of star formation.
Observational pieces of evidences for star formation were shown as follows. Yun & Clements (1990) surveyed 248 Bok globules using IRAS coadded images and found that about 23% of Bok globules show evidence for associated point sources. Considering the sensitivity of the IRAS (∼0.7 M⊙) and the initial mass function, only about 20 % of the total number of stars cloud found. They there- fore, noted that almost every Bok globule harbours a young star. Indeed, recent Spitzer observations discovered low-luminous protostars in many globules (e.g., Young et al. 2004). Wang et al. (1995) performed the C18O (J = 2 − 1) and H2CO (JK−1K1 = 312 − 211) line observations toward 40 Bok globules. They found that three of these globules have kinematic signatures for collapse. The sensitive NIR measurements of the background stars, as extinction, revealed the internal structure of Bok globules (e.g., Alves et al. 2001). Alves et al. (2001) found that cloud’s density structure to be very well described by the equations for a pressure-confined, self-gravitating isothermal sphere that is critically stable according to the Bonnor-Ebert criteria (see Figure 1.3). From these facts, star formation in globules seems to occur ubiquitously.
1.4 Purpose of this Thesis
The main purpose of this study is to reveal that star formation in small clouds are generally occur. To testify this idea, we first expand the number of isolated CTTSs, using the AKARI All-Sky Survey. The advantages of this study against the previous studies of YSO survey, is that AKARI observed almost the whole sky. As noted before, previous YSO surveys were biased toward cloud region. Al- though ROSAT surveyed all-sky, the detection rate for previously known CTTSs was only ∼10%, and it was not complete. We, then, search the origin of the isolated TTSs from their proper motions. We also verify whether or not there are any differences between TTSs associated to active clouds and isolated from clouds.
In Chapter 2, we describe the specifications of the AKARI All-Sky Survey,
7
which most data used in this thesis. We show the input previously known TTSs, and how complete AKARI surveyed them. We perform a cross-correlation be- tween the AKARI IRC Point source Catalogue, 2MASS catalogue (NIR wave- lengths), and UCAC3 (optical wavelengths) to construct more complete data sets.
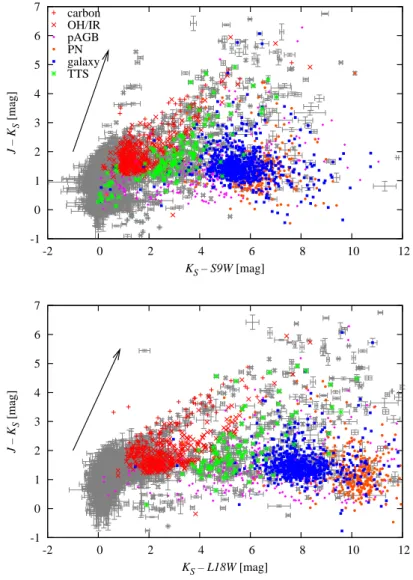
In Chapter 3, we present the results of the AKARI survey of previously known TTSs. We make some colour-colour and colour-magnitude diagrams for previ- ously known TTSs using AKARI, 2MASS, and UCAC3 data, to determine what colours TTSs have. From these diagrams, we select new TTS candidate sources with similar characteristics of previously known TTSs. We also show the results of the follow-up observations of the new TTS candidates, and discuss whether or not they are TTSs.
In Chapter 4, we discuss the origin of isolated CTTSs. We also compare the properties between the TTSs associated to clouds and isolated TTSs.
In Chapter 5, we summarize this thesis.
1.5 Target Region
In this section, we introduce the Taurus-Auriga star forming region which is surveyed in this thesis.
The Taurus molecular cloud (Figure 1.4), located at a distance of ∼140 pc from the Sun, is one of the most typical low-mass star forming region and contains more than 300 young stars and brown dwarfs (Kenyon et al. 2008). Because of the low stellar density of only 1–10 stars pc−2 (e.g., Gomez et al. 1993), strong mutual influence due to outflows, jets, or gravitational effects are minimized. Furthermore, most stars in Taurus are subject to relatively modest extinction, providing access to a broad spectrum of stars at all evolutionary stages from Class 0 sources to post TTSs.
With no luminous O or B stars, the Taurus-Auriga dark clouds are mostly neutral and contain large amounts of mass, 3–4 ×10⁴ M⊙. The observations at millimetre wavelengths showed filamentary structure, which was also observed in the optical wavelengths as extinction (e.g., Onishi et al. 2002). The radio ob- servations reveal dense clumps and cores of molecular gas inside these structures with masses of 1–100 M⊙.
The short distance and low density of Taurus also permitted spatially resolved photometry of individual stars at wide wavelength rage. By combining 12–100 µm photometry from the Infrared Astronomical Satellite (IRAS) and 1–10 µm data from ground-based telescopes, Kenyon & Hartmann (1995) performed the most comprehensive census of disks in a star-forming region at that time. They found that more than 50% of Taurus objects have IR excess emission, indicating the presence of warm circumstellar material predominantly in the form of envelopes for Class I protostars and circumstellar disks for Class II stars. The disk-bearing
8
stars have served as targets for a multitude of detailed observations of circum- stellar disks.
The census of the stellar population of Taurus has expanded significantly since the disk study of Kenyon & Hartmann (1995), particularly at masses below 0.5 M⊙. Owing to the drastic improvements of IR telescopes, for example the Spitzer Space Telescope, many Taurus members with masses below 0.01 M⊙ were detected (e.g., Rebull et al. 2010, Luhman et al. 2010).
9
Figure 1.1: Scenario for low mass star formation as proposed by Andr´e (1994). The four classes 0, I, II, and III correspond to successive stages of evolution. The typical of visions, Spectral Energy Distributions, ages, and characteristics in each class are shown.
10
Figure 1.2: Spatial distribution of the CTTS (dots) and WTTS (shaded circles) in the Chamaeleon cloud complex. The IRAS 100 µm contour maps are overplotted (from Alcala et al. 1997).
11
2,000 5,000 10,000
Bar nard 68
ÉÃmax
=6.9±0.2
102 10
r (arcsec) 1
10
Av
(magnitude)
AU
Figure 1.3: (left): Photograph of a Bok globule, Barnard 68. (right): Radial profile of visual extinction (AV) of Barnard 68. The small circles are the data points for the averaged profile. The solid curve represents the best fit of a theoretical Bonner-Ebert sphere to the data (from Alves et al. 2001).
12
Figure 1.4: The13CO (J = 1−0) total intensity map of the Taurus molecular clouds. Contours are every 3.0 K km s−1 (from Mizuno et al. 1995).
13
Chapter 2
DATA SETS
2.1 AKARI
AKARI is the first Japanese infrared astronomical satellite dedicated to in- frared astronomy (Murakami et al. 2007), which was launched on 2006 February 21st. After three weeks of performance verification (PV) phase (April 13th to May 7th), Phase 1 observations started on the May 8th and continued until November 9th, followed by Phase 2 observations until the exhaustion of liquid Helium on the August 26th, 2007. After the liquid Helium exhaustion, the telescope and focal plane of AKARI have still been kept less than 50K by the on-board cryocooler and Phase 3 (a.k.a. warm mission) observations started at near-infrared (NIR) wavelengths on 2008 June 1st, following second performance verification phase.
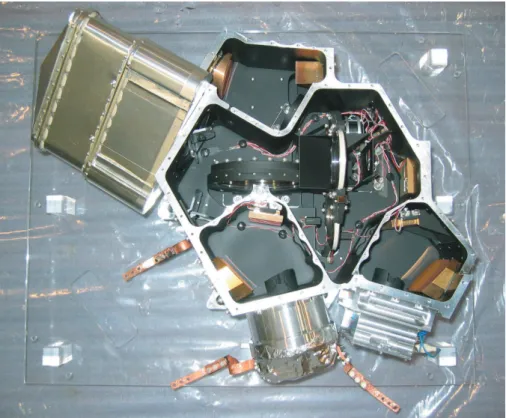
One of the major observation programs of AKARI is an all-sky survey at the mid- to far-infrared wavelengths with 6 photometric bands, and provide second- generation infrared catalogues to obtain a better spatial resolution and a wider spectral coverage than the first catalogues produced by the InfraRed Astronom- cal Satellite (IRAS) mission (Neugebauer et al. 1984). AKARI has a 68.5 cm diameter cooled telescope with the following two scientific instruments of the In- frared Camera (IRC; Onaka et al. 2007, Figure 2.2) and the Far-Infrared Surveyor (FIS; Kawada et al. 2007, Figure 2.3). Its orbit is a Sun-synchronous polar orbit along the twilight zone at altitude of about 700 km. The wide fields of view (FoV; ∼ 10′) covered by the large format arrays in these instruments makes them highly suitable for efficient surveys (see Figure 2.1). Furthermore, AKARI has the capability for imaging and spectroscopy in the wavelengths rage 2–180 µm in the pointed observation mode.
The All-Sky Survey had the highest priority in Phase 1 operations. In Phase 2 the observation plan was highly optimized for the FIS survey (not for the IRC survey) to fill the scan gaps caused in Phase 1 under constraints of carrying out the maximum number of pointed observations. No survey observations were performed in Phase 3.
14
2.1.1 The IRC All-Sky Survey
The IRC consists of three channels: the NIR (1.8–5.3 µm), MIR-S (5.4– 13.1 µm), and MIR-L (12.4–26.5 µm). The NIR and MIR-S channels share the same FoV, while the MIR-L channel is separated about 20′ from them (see Fig- ure 2.1). Each channel has three broad-band filters and additional dispersion elements. The photograph of the IRC is shown in Figure 2.2. Although the IRC was originally designed for imaging and spectroscopic observations in the pointed observation mode, the additional survey-type observation mode was confirmed (Ishihara et al. 2006).
The IRC All-Sky Survey was carried out with the S9W (9 µm) and L18W (18 µm) bands, and the point source catalogue (PSC) was released to the public in 2010 March. The IRC scanned 96 and 97 percent of the entire sky in S9W and L18W bands more than once during the 16 months, respectively. The IRC PSC Version-1 contains 870 973 sources (844 649 for S9W and 194 551 for L18W ). The 5 σ detection limit for a point source is estimated to be 50 and 120 mJy in the S9W and L18W bands, respectively. The uncertainties in the absolute flux calibration are estimated to be 3% for the S9W band and 4% for the L18W band. The spatial resolutions are about 5′′, and the position accuracies are estimated to be better than 2′′. Table 2.1 gives the properties of the AKARI IRC PSC. The relative spectral response curves of the S9W and L18W bands are shown in Figure 2.4. The analysis of this paper is based on the 1st version of the IRC PSC. The details of the AKARI IRC All-Sky Survey and its data reduction processes are described in Ishihara et al. (2010), Kataza et al. (2010).
2.1.2 The FIS All-Sky Survey
The FIS has the two sets of detector arrays: the Short Wavelength array (SW) covering 50–110 µm and the Long Wavelength arrays (LW) covering 110–180 µm. Each detector has two arrays, narrow and wide bands. They share almost the same FoV. The picture of the FIS is shown in Figure 2.3.
The FIS All-Sky Survey was performed with these four bands (N60 : 65 µm, Wide-S: 90 µm, Wide-L: 140 µm, and N160 : 160 µm). The FIS Bright Source Catalogue (BSC) was also released to the public in 2010 March. The sky coverage of the FIS survey is 98 percent. The BSC Version-1 contains in total 427 071 sources (29 336 for N60, 373 819 for Wide-S, 117 994 for Wide-L, and 36 646 N160). The detection limit is estimated to be 3.2, 0.55, 3.8, and 7.5 Jy at N60, Wide-S, Wide-L, and N160 bands, respectively. We note that in the bright sky regions such as the inner Galactic Plane, a different data sampling mode, CDS mode, was applied to the detector for the purpose to avoid saturation, and cost of higher noise level, i.e., worse detection limits. The flux uncertainties are 20%. The spatial resolution and position accuracy are determined by the data processing and are 48′′ and 6′′, respectively. Table 2.1 gives the properties of the
15
AKARI FIS BSC. The relative spectral response curves of the four FIS bands are shown in Figure 2.4. The analysis of this paper is based on the 1st version of the FIS BSC. See Yamamura et al. (2010) for more details.
Table 2.1: Properties of the AKARI Point Source Catalogue
IRC PSC ver.1 FIS BSC ver.1
Instrument IRC FIS
Band S9W L18W N60 Wide-S Wide-L N160
Wavelength [µm] 6–12 12–26 50–80 60–110 110–180 140–180
Band Centre [µm] 9 18 65 90 140 160
Number of sources 844 649 194 551 28 779 373 553 119 259 36 857
870 973 427 071
Detection limit [Jy] 0.05 0.12 3.2 0.55 3.8 7.5
Sky coveragea [%] 96 97 98
a Sky coverage is defined as the area which was observed more than once.
2.2 Input TTSs Toward the Taurus-Auriga Re-
gion
For this study, we selected a 1800-square-degree (2h40m< R.A. < 5h40m and 0◦ < Dec < 40◦) part of the Taurus-Auriga region, which were used for the WTTS survey by the Roentgen satellite (ROSAT) (Wichmann et al. 1996, Magazz`u et al. 1997, Li & Hu 1998). We first gathered known Taurus Young Stellar Objects (YSOs), mostly associated with the Taurus molecular cloud, from Strom et al. (1989), Beckwith et al. (1990), G¨udel et al. (2007), Kenyon et al. (2008), and Rebull et al. (2010). Secondly, we selected the following TTSs from the YSOs:
• objects labelled as CTTSs or WTTSs in G¨udel et al. (2007)
• objects listed in Kenyon et al. (2008) that were confirmed as Class II/III objects on the basis of the SIMBAD database and their references
• Class II/III objects including the ‘new’, ‘probable’, and ‘possible’ members in Rebull et al. (2010)
We note that Beckwith et al. (1990) and Strom et al. (1989) listed only TTSs. Furthermore, we added TTSs discovered by the ROSAT and distributed from the
16
cloud (Wichmann et al. 1996, Magazz`u et al. 1997, Li & Hu 1998)1. In our TTS list, we considered close (< 5′′; the spatial resolution of the AKARI IRC All-Sky Survey) binaries as a single source. We finally obtained a catalogue of 516 TTSs in the selected region. The distribution of our input TTSs is shown in Fig. 2.5.
We divide the known TTSs into two groups, TTSs which are associated to clouds, and TTSs which are isolated from clouds. We define the “cloud regions” as those where AV > 2 (from Dobashi et al. 2005). Then we got 345 sources associated (within 1◦ from the cloud region) and 171 isolated TTSs.
We also classified them to CTTS and WTTS, for 399 sources whose equiv- alent width of Hα emission (W (Hα)2) has been measured. We got 130 CTTSs (W (Hα) ≤ −10˚A) and 269 WTTSs (W (Hα) > −10˚A). Table 2.2 summarizes the number of sources in our input TTSs.
Table 2.2: Numbers of Input TTSs
associated isolated total
CTTS 122 8 130
WTTS 112 157 269
other 111 6 117
total 345 171 516
2.3 Catalogued Sources Toward the Taurus-Auriga
Region
Since the AKARI’s visibility for the Taurus region is relatively low due to the Sun-synchronous orbit of AKARI and the location of that region (near Ecliptic plane), we show the completeness of the sky coverage of the AKARI All-Sky Survey. For the 1800-square-degree region we selected, about 92 and 96 percent of the sky were surveyed with the S9W and L18W bands, respectively. The sky coverages with the four FIS bands are ∼99%. The difference of the coverage owe to the different field-of-view of these instruments (see Figure 2.1), and the survey operation was optimized for the FIS.
In the selected regions, there are 14 725 AKARI IRC sources (14 546 S9W and 2720 L18W ), and 12 027 FIS sources (444 N60, 10 051 Wide-S, 3063 Wide-L, and 608 N160 ). The detection limit of the S9W band (50 mJy), which is the
1We removed one source, 1RXS J032409.7+123745, from Li & Hu (1998) list, because it seems to be a Li rich giant from its too bright luminosity (3–4 magnitudes in NIR wavelengths) as a K2 dwarf star at distance of 140 pc.
2Equivalent width is negative for emission line, and positive for absorption line.
17
most sensitive one, corresponds to 8 magnitude. Assuming the distance of 140 pc, this detection limit is consistent with a 1 Myr M0 star, a 10 Myr K5 star, or a Zero-Age-Main-Sequence F0 star (see Figure 2.6). This sensitivity is sufficient for survey of the Sun-like sources at a distance of ∼100 pc.
2.4 Archival Data
In order to verify the positional accuracy of AKARI (IRC) point sources and to construct more complete data sets of our T Tauri stars, we have used the Near-Infrared survey of the Two Micron All Sky Survey (2MASS; Skrutskie et al. 2006) and the optical survey of the USNO CCD Astrograph Catalogue (UCAC; Zacharias et al. 2010).
2.4.1 Near-Infrared data
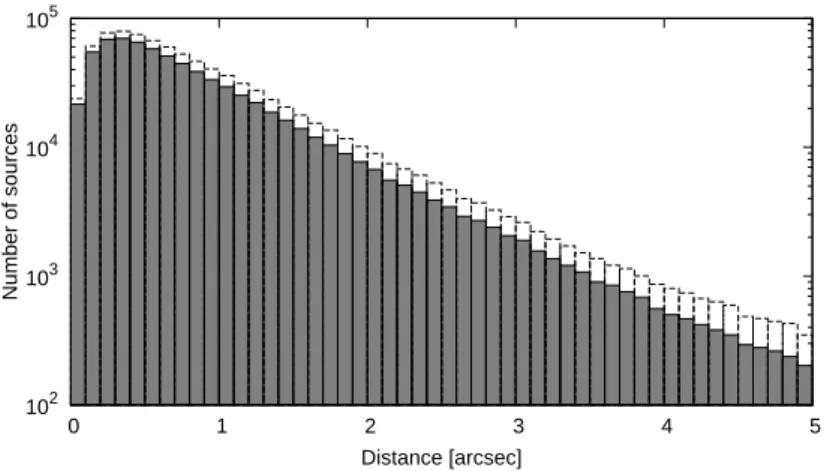
Ita et al. (2010)3 compared the IRC PSC with the 2MASS PSC to assess the positional accuracy of the IRC PSC, although most the AKARI’s attitude in the survey mode referred the 2MASS PSC. Since the 2MASS point source catalogue is complete down to KS < 14.3 mag in the absence of confusion and the detection limit of 50 mJy (or ∼8 mag) at the AKARI S9W band, all normal stars seen by AKARI should be prominent in the 2MASS PSC. The position quality of the 2MASS sources are estimated to be 70–80 mas over most of the magnitude range. Therefore, the 2MASS PSC is useful to assess the positional accuracy of the IRC PSC. There are 756 997 sources with S/N > 5 at the S9W band in the IRC PSC. They used these 756 997 ‘good’ IRC sources, and compared to the ‘good’ 2MASS PSC with the KS band magnitude of <14.3 and S/N > 5. Of the 756 997 sources, 505 290 (67%), 669 771 (88%), 708 969 (94%), 719 822 (95%), 723 215 (96%) sources have 2MASS counterparts at the radii of 1, 2, 3, 4, and 5 arcsec, respectively (Figure 2.7). They also mentioned based on sub-sample of 563 935 sources with S/N > 10 at the S9W band, that the positional accuracy of the IRC PSC does not have any dependency on the source brightness.
The dependency on the source density was also checked. There are 77 232 good IRC sources at high galactic latitude (|b| > 30◦), and 71 526 (93%) sources have counterpart of 2MASS good sources within 5′′ radius. This result indicates that the positional accuracy of the IRC PSC may depend on the source density. They concluded that the positional accuracy of the IRC PSC sources is better than 3′′ for most of the sources.
We, then, compared the IRC PSC with the 2MASS PSC toward the 1800- square-degree of the Taurus region. In this regions, there are 14 725 IRC sources. We note that we did not choose the ‘good’ IRC sources. Of the 14 725 IRC
3They used the team internal released version of the IRC PSC, and the number of sources are slightly different from this study. The catalogue quality is almost the same.
18
sources, 14 593 (99.1%) and 14 671 (99.6%) sources have 2MASS counterparts within 3 and 5′′ radius, respectively. If we limit the ‘good’ 2MASS sources, there are 13 675 (92.9%) and 13 746 (93.4%) sources within 3 and 5′′ radius, respectively.
2.4.2 Optical data
We also compared the IRC PSC with the 3rd version of the UCAC (UCAC3). UCAC3 consists of mainly the 8–16 magnitude range in a 579–642 nm bandpass, between V and R, and contains over 100 million sources. The limiting magnitude and bright magnitude cut-off could vary about ±0.3 mag, depending on sky conditions at the observed time. The positional accuracy are estimated to be 15– 20 mas for stars in the 10–14 mag range. Over 95 million stars in UCAC3 have a computed proper motion; for 45.4 million of them the proper motion is based on observations at only 2 epochs, while other 49.5 million stars have observations at least 3 epochs.
First, we compared the ‘good’ IRC PSC with ‘good’ UCAC3 sources which have magnitudes of 8–16 and S/N > 5. Of the 756 997 sources, 346 336 (46%), 419 136 (55%), 432 417 (57%), 437 013 (58%), and 439 827 (58%) sources have UCAC3 counterpart within the radii of 1, 2, 3, 4, and 5 arcsec, respectively (Figure 2.8). This relatively low cross-identification rate is caused by the limited magnitude range of the UCAC3 survey in which the most nearby (< 100 pc) stars are saturated, and distant (> 1 kpc) or heavily reddened stars have no UCAC3 entry because of the catalogue’s limited sensitivity.
Of the 14 725 IRC sources toward the Taurus region, 13 667 (92.8%) and 13 723 (93.2%) sources have counterpart in the UCAC3 within 3 and 5′′ radius, respectively. If we limit the ‘good’ UCAC3 sources by their magnitudes and S/N, there are 11 254 (76.4%) and 11 278 (76.6%) sources within 3 and 5′′ radii, respectively.
19
26.5deg
IRC
FIS
FSTS-L
FSTS-S
Telescope Axis
10.7’ 10.0’
10.2’
9.4’
SCAN
DIRECTION
12.4’ 0.6’ 25.0’
18.8’ 8.2’
23.3’
7.0’7.0’7.0’2.5’
19.2’ 8.2’
2.5’6.5’ 12.3
’
20.5’
38.7 deg
44.4deg
44.4deg
12.3
’
0.8’ for all the FSTS detectors
2004 Oc t. 5
NIR
& MIR-S MIR-L
Figure 2.1: Layout of the focal-plane projected onto the sky (from Murakami et al. 2007). The FIS SW arrays are shown by the two small dark orange rectangles, and the FIS LW are the large light orange ones. The FSTS-S & -L arrays are focal-plane star trackers.
20
Figure 2.2: Photograph of the IRC (from Onaka et al. 2007).
21
Figure 2.3: Picture of FIS at final integration (from Kawada et al. 2007). The top cover is removed to show the FIS optics.
0 0.2 0.4 0.6 0.8 1
10 100
Relative Response
Wavelength [µm]
Figure 2.4: Spectral response curves of the S9W, L18W, N60, Wide-S, Wide-L, and N160 bands normalized to the peak (left to right) (from Onaka et al. 2007, Kawada et al. 2007).
22
30d20d10d0d
5h 4h 3h
IC348
Tau r u s
mole cu lar
clo u d
Pleia de s
Figure 2.5: Distribution of the target TTSs. The magenta circles are CTTSs, cyan ones are WTTSs, and the green ones are TTSs whose equivalent width of Hα were not provided. The grey scale is IRAS 100 µm image, and the yellow contour indicates the extinction of AV = 2 (from Dobashi et al. 2005). The red box indicates the region we searched for this study.
23
5
10
KS [mag]
4 3.8 3.6
log Teff
Figure 2.6: H-R diagram of the Siess et al. (2000) evolutionary tracks with distance of 140 pc. The horizontal broken curves are isochrones for 0.1, 1, 10 Myr and Zero-Age-Main-Sequence (from top to bottom). The vertical solid curves are represent mass tracks for 0.5, 0.8, 1.1, 1.6, and 3 M⊙ (from right to left). The dotted line indicates the sensitivity of the AKARI All-Sky Survey at 9 µm band.
102 103 104 105
0 1 2 3 4 5
Number of sources
Distance [arcsec]
Figure 2.7: The histogram of positional differences between the AKARI IRC PSC and the 2MASS PSC for matched sources. The hatched areas represent matched sources with good IRC PSC and good 2MASS PSC. The size of the bin is 0.1 arcsec.
24
102 103 104 105
0 1 2 3 4 5
Number of sources
Distance [arcsec]
Figure 2.8: The histogram of positional differences between the AKARI IRC PSC and UCAC3 for matched sources. The hatched areas represent matched sources with good IRC PSC and good UCAC3. The size of the bin is 0.1 arcsec.
25
Chapter 3
RESULTS
Part of this chapter is published in the Astronomy & Astrophysics as
“A survey of T Tauri stars with AKARI toward the Taurus-Auriga region” by
Takita et al.
3.1 Detections of Previously Known T Tauri Stars
with AKARI
Of the 516 previously known T Tauri stars (TTSs) we compiled, 503 and 508 TTSs were observed twice or more with the S9W and L18W bands, respectively. There are 10 and 8 sources, observed only once with the S9W and L18W bands, respectively, and then, 3 sources (SST Tau 042423.2+265008, CFHT-9, and IRAS 04216+2603) not observed at all in the S9W band. On the other hand, 511 TTSs were observed twice or more with the four FIS bands, and the remaining 5 sources were observed only once.
Table 3.1: Observed and detected numbers of the input T Tauri stars.
Band Observed Detected
0 1 >2 total
S9W 3 10 506 516 126
L18W 0 8 508 516 94 132
FIS 0 5 511 516 79
We searched for 516 previously known TTSs in the AKARI IRC Point Source Catalogue, and detected 132 TTSs within 5′′ searching radius, i.e., the resolution of the AKARI IRC All-Sky Survey: 126 and 94 sources were detected in the S9W
26
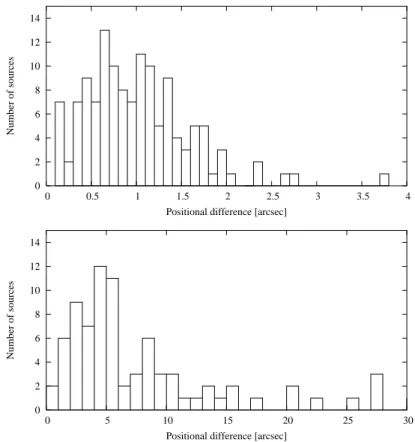
(9 µm) and L18W (18 µm) bands, respectively. Six sources were detected only in the L18W band: 3 sources (IRAS 04200+2759, IRAS 04295+2251, and UX Tau) were observed/detected only once in the S9W band, so the IRC PSC does not include these sources. The other 3 sources were not detected at all. The positions of almost all the AKARI detected sources agree well with those in the previous catalogues to within the uncertainty of 3′′ (see Figure 3.1). Although the positions of GI Tau in the different catalogues have larger differences than 3′′, all of them agree to within the positional accuracy of AKARI IRC PSC.
0 2 4 6 8 10 12 14
0 0.5 1 1.5 2 2.5 3 3.5 4
Number of sources
Positional difference [arcsec]
0 2 4 6 8 10 12 14
0 5 10 15 20 25 30
Number of sources
Positional difference [arcsec]
Figure 3.1: (Top) Histogram of the positional differences between the TTSs detected by AKARI (IRC PSC) and those in the previous catalogues. The bin size of the positional difference is 0.1 arcsec. (Bottom) Histogram of the positional differences between the TTSs detected by AKARI (FIS BSC) and those in the previous catalogues. The bin size of the positional difference is 1 arcsec.
We also searched for previously known TTSs in the AKARI FIS Bright Source Catalogue. In this survey, we used sources with FQUAL=3, which represents that the source is highly reliable. We then got 79 sources within the searching radius of 30′′. For these 79 sources, 3 TTSs did not have reliable values for the flux density at the Wide-S (90 µm) band, which is the most sensitive band of the FIS. GV Tau and IRAS 04264+2433 were detected only once and CFHT-1 was not detected at that band, but they were detected at least twice at the Wide-L
27
(140 µm) band.
There are 15 sources which were detected by the FIS but not detected by the IRC. Six sources have angular separation of > 5′′ (spacial resolution of the IRC) between the previous catalogue and the FIS BSC. DM Tau was detected twice in the L18W band, but the positions in the two independent images have a larger difference than 5′′ between each other for the current positional accuracy, and therefore, no entry in the IRC PSC. The other 5 sources (IRAS 04216+2603, IRAS 04260+2642, IRAS 04302+2247, LR1, and SST Tau J041542.7+290959) were detected only once or not detected at both the S9W and L18W bands, then these sources were not catalogued in the IRC PSC. Since these sources are bright at the 24 µm bandpass (∼4 magnitude) but faint at the 8 µm bandpass (∼8–9 magnitude) (Rebull et al. 2010, Luhman et al. 2010), they are thought to have inner gaps in their disks. We note that IRAS 04216+2603 was not observed in the S9W band at all.
For the 9 sources that have larger angular separation of 5′′ between the pre- vious catalogue and the FIS BSC, only HD 30171 has IRC counterparts within the positional accuracy of 48′′.
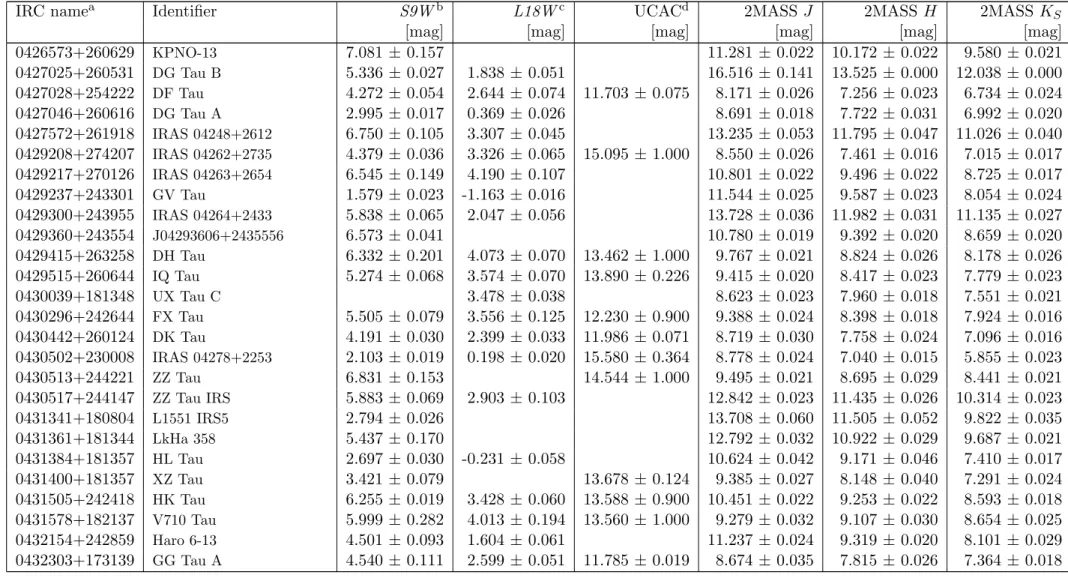
The photometric data of the AKARI detected TTSs are listed in Table 3.2 and Table 3.3.
28
Table 3.2: AKARI (IRC), UCAC, and 2MASS photometric data for the previously known Taurus members.
IRC namea Identifier S9Wb L18Wc UCACd 2MASS J 2MASS H 2MASS KS
[mag] [mag] [mag] [mag] [mag] [mag]
0311138+222457 1RXS J031113.0+222518 6.847 ± 0.154 8.359 ± 0.093 7.273 ± 0.020 7.069 ± 0.053 6.968 ± 0.027 0324065+234706 1RXS J032406.6+234714 6.008 ± 0.048 10.018 ± 1.000 7.128 ± 0.020 6.492 ± 0.020 6.267 ± 0.018 0327325+255400 1RXS J032733.2+255405 6.947 ± 0.508 9.090 ± 1.000 7.927 ± 0.032 7.550 ± 0.051 7.488 ± 0.023 0400095+081818 RXJ0400.1+0818N 7.041 ± 0.183 9.775 ± 0.048 8.281 ± 0.024 8.028 ± 0.000 7.843 ± 0.000 0404430+261856 L1489 IRS 3.745 ± 0.020 0.694 ± 0.022 14.129 ± 0.000 11.908 ± 0.000 9.859 ± 0.043 0406513+254127 RXJ0406.8+2541 6.207 ± 0.126 11.452 ± 0.058 8.767 ± 0.021 8.026 ± 0.034 7.750 ± 0.018 0413271+281624 Anon 1 6.785 ± 0.221 13.261 ± 0.171 8.826 ± 0.030 7.794 ± 0.027 7.460 ± 0.029 0413532+281124 IRAS 04108+2803 A 6.022 ± 0.116 13.639 ± 0.024 11.521 ± 0.024 10.370 ± 0.019 0413573+291820 IRAS 04108+2910 5.648 ± 0.044 3.559 ± 0.152 16.015 ± 0.316 11.310 ± 0.023 10.157 ± 0.024 9.356 ± 0.024 0414129+281212 V773 Tau 4.213 ± 0.028 2.247 ± 0.039 10.434 ± 0.033 7.494 ± 0.024 6.644 ± 0.020 6.210 ± 0.047 0414135+281249 FM Tau 5.729 ± 0.057 3.554 ± 0.036 10.329 ± 0.021 9.391 ± 0.022 8.763 ± 0.022 0414146+282758 FN Tau 5.383 ± 0.096 2.780 ± 0.039 14.151 ± 0.267 9.469 ± 0.022 8.669 ± 0.036 8.189 ± 0.018 0414170+281058 CW Tau 4.144 ± 0.043 2.324 ± 0.049 13.390 ± 0.169 9.557 ± 0.022 8.243 ± 0.027 7.127 ± 0.023 0414176+280609 CIDA-1 6.126 ± 0.126 4.187 ± 0.156 11.726 ± 0.021 10.584 ± 0.022 9.877 ± 0.021 0414263+280602 IRAS 04113+2758 A 3.525 ± 0.017 1.031 ± 0.067 12.475 ± 0.029 9.878 ± 0.033 7.777 ± 0.031 0414305+280514 MHO 3 4.049 ± 0.028 1.185 ± 0.022 11.178 ± 0.021 9.249 ± 0.022 8.243 ± 0.023 0414478+264810 CX Tau 6.227 ± 0.093 3.725 ± 0.100 13.589 ± 0.073 9.867 ± 0.022 9.054 ± 0.024 8.807 ± 0.019 0414479+275234 LkCa 3 6.860 ± 0.189 11.865 ± 0.063 8.363 ± 0.032 7.625 ± 0.023 7.423 ± 0.021 0414492+281230 FO Tau 5.719 ± 0.105 3.511 ± 0.052 15.099 ± 0.192 9.650 ± 0.021 8.568 ± 0.021 8.121 ± 0.031 0417337+282047 CY Tau 6.270 ± 0.081 13.022 ± 0.069 9.828 ± 0.020 8.970 ± 0.024 8.597 ± 0.021 0417496+282936 V410 X-ray 1 5.997 ± 0.086 4.415 ± 0.049 16.680 ± 0.515 11.020 ± 0.021 9.733 ± 0.027 9.081 ± 0.019 0418107+251957 [GBM90] L1506 1 6.537 ± 0.096 13.039 ± 0.223 10.744 ± 0.024 9.589 ± 0.022 9.032 ± 0.019 0418310+282716 V410 Tau 7.184 ± 0.111 10.366 ± 0.003 8.449 ± 0.018 7.789 ± 0.021 7.629 ± 0.026 0418311+281629 DD Tau 4.271 ± 0.027 2.366 ± 0.043 14.748 ± 0.232 9.830 ± 0.021 8.682 ± 0.020 7.878 ± 0.020 0418316+281658 CZ Tau 4.471 ± 0.033 2.461 ± 0.046 15.239 ± 0.023 10.517 ± 0.021 9.774 ± 0.022 9.362 ± 0.017
29
Table 3.2: continued.
IRC namea Identifier S9Wb L18Wc UCACd 2MASS J 2MASS H 2MASS KS
[mag] [mag] [mag] [mag] [mag] [mag]
0418320+283115 IRAS 04154+2823 4.882 ± 0.102 2.420 ± 0.048 15.187 ± 0.048 12.369 ± 0.022 10.274 ± 0.017
0418344+283029 V410 X-ray 2 4.559 ± 0.071 13.773 ± 0.026 10.708 ± 0.022 9.215 ± 0.017
0418406+281914 V892 Tau 1.278 ± 0.016 -1.777 ± 0.016 14.846 ± 0.111 8.742 ± 0.027 7.016 ± 0.029 5.787 ± 0.016 0418470+282008 Hubble 4 6.931 ± 0.275 12.181 ± 0.093 8.560 ± 0.020 7.636 ± 0.026 7.293 ± 0.024 0418514+282026 CoKu Tau/1 5.239 ± 0.089 1.884 ± 0.022 12.866 ± 0.030 11.489 ± 0.031 10.974 ± 0.024
0419010+281942 V410 X-ray 6 4.747 ± 0.066 10.527 ± 0.022 9.597 ± 0.024 9.129 ± 0.021
0419128+282933 FQ Tau 7.175 ± 0.294 15.097 ± 0.195 10.491 ± 0.026 9.702 ± 0.024 9.313 ± 0.022 0419158+290626 BP Tau 5.335 ± 0.123 3.303 ± 0.049 11.927 ± 0.081 9.098 ± 0.037 8.220 ± 0.024 7.736 ± 0.023 0419354+282721 FR Tau 6.853 ± 0.357 16.321 ± 0.900 10.954 ± 0.021 10.374 ± 0.022 9.971 ± 0.018 0420258+281922 SST Tau 042025.8+281923 6.564 ± 0.132 4.612 ± 0.054 15.327 ± 0.039 13.422 ± 0.026 11.718 ± 0.021 0420260+280409 SST Tau 042026.0+280408 6.643 ± 0.242 3.740 ± 0.071 14.696 ± 0.190 10.612 ± 0.021 9.949 ± 0.022 9.697 ± 0.018 0421079+270220 CFHT-19 5.309 ± 0.030 2.735 ± 0.054 13.855 ± 0.024 12.062 ± 0.026 10.543 ± 0.021 0421432+193413 IRAS 04187+1927 4.274 ± 0.041 2.494 ± 0.027 10.185 ± 0.022 8.725 ± 0.024 8.021 ± 0.018 0421556+275506 DE Tau 5.382 ± 0.052 3.455 ± 0.017 12.773 ± 0.165 9.180 ± 0.022 8.273 ± 0.018 7.799 ± 0.018 0421574+282635 RY Tau 1.652 ± 0.017 -0.273 ± 0.019 10.064 ± 0.037 7.155 ± 0.019 6.128 ± 0.061 5.395 ± 0.023 0421588+281806 HD 283572 6.805 ± 0.274 8.847 ± 0.044 7.414 ± 0.029 7.008 ± 0.026 6.869 ± 0.023 0421594+193205 T Tau 1.539 ± 0.019 -1.127 ± 0.029 9.747 ± 0.071 7.240 ± 0.023 6.237 ± 0.017 5.325 ± 0.017 0422007+265733 FS Tau B 5.327 ± 0.057 2.181 ± 0.316 15.082 ± 0.082 13.351 ± 0.053 11.753 ± 0.029 0422022+265729 FS Tau A 4.453 ± 0.044 1.877 ± 0.149 13.796 ± 0.900 10.705 ± 0.027 9.244 ± 0.026 8.178 ± 0.017 0422167+265456 CFHT-21 5.699 ± 0.065 3.793 ± 0.076 13.575 ± 1.000 11.577 ± 0.019 10.037 ± 0.022 9.011 ± 0.021 0422478+264552 IRAS 04196+2638 5.759 ± 0.099 4.330 ± 0.053 11.589 ± 0.022 10.147 ± 0.025 9.287 ± 0.019 0423077+280557 IRAS 04200+2759 3.998 ± 0.140 13.179 ± 0.021 11.600 ± 0.024 10.413 ± 0.018
0423354+250300 FU Tau 6.199 ± 0.024 10.781 ± 0.026 9.945 ± 0.027 9.324 ± 0.024
0423391+245613 FT Tau 6.030 ± 0.071 3.809 ± 0.128 14.791 ± 0.174 10.192 ± 0.026 9.123 ± 0.027 8.596 ± 0.021 0424570+271156 IP Tau 6.019 ± 0.039 12.046 ± 0.900 9.781 ± 0.021 8.893 ± 0.017 8.349 ± 0.018 0426535+260654 FV Tau 4.086 ± 0.027 2.116 ± 0.066 14.135 ± 0.900 9.917 ± 0.022 8.325 ± 0.024 7.442 ± 0.020
30
Table 3.2: continued.
IRC namea Identifier S9Wb L18Wc UCACd 2MASS J 2MASS H 2MASS KS
[mag] [mag] [mag] [mag] [mag] [mag]
0426573+260629 KPNO-13 7.081 ± 0.157 11.281 ± 0.022 10.172 ± 0.022 9.580 ± 0.021
0427025+260531 DG Tau B 5.336 ± 0.027 1.838 ± 0.051 16.516 ± 0.141 13.525 ± 0.000 12.038 ± 0.000 0427028+254222 DF Tau 4.272 ± 0.054 2.644 ± 0.074 11.703 ± 0.075 8.171 ± 0.026 7.256 ± 0.023 6.734 ± 0.024 0427046+260616 DG Tau A 2.995 ± 0.017 0.369 ± 0.026 8.691 ± 0.018 7.722 ± 0.031 6.992 ± 0.020 0427572+261918 IRAS 04248+2612 6.750 ± 0.105 3.307 ± 0.045 13.235 ± 0.053 11.795 ± 0.047 11.026 ± 0.040 0429208+274207 IRAS 04262+2735 4.379 ± 0.036 3.326 ± 0.065 15.095 ± 1.000 8.550 ± 0.026 7.461 ± 0.016 7.015 ± 0.017 0429217+270126 IRAS 04263+2654 6.545 ± 0.149 4.190 ± 0.107 10.801 ± 0.022 9.496 ± 0.022 8.725 ± 0.017 0429237+243301 GV Tau 1.579 ± 0.023 -1.163 ± 0.016 11.544 ± 0.025 9.587 ± 0.023 8.054 ± 0.024 0429300+243955 IRAS 04264+2433 5.838 ± 0.065 2.047 ± 0.056 13.728 ± 0.036 11.982 ± 0.031 11.135 ± 0.027 0429360+243554 J04293606+2435556 6.573 ± 0.041 10.780 ± 0.019 9.392 ± 0.020 8.659 ± 0.020 0429415+263258 DH Tau 6.332 ± 0.201 4.073 ± 0.070 13.462 ± 1.000 9.767 ± 0.021 8.824 ± 0.026 8.178 ± 0.026 0429515+260644 IQ Tau 5.274 ± 0.068 3.574 ± 0.070 13.890 ± 0.226 9.415 ± 0.020 8.417 ± 0.023 7.779 ± 0.023
0430039+181348 UX Tau C 3.478 ± 0.038 8.623 ± 0.023 7.960 ± 0.018 7.551 ± 0.021
0430296+242644 FX Tau 5.505 ± 0.079 3.556 ± 0.125 12.230 ± 0.900 9.388 ± 0.024 8.398 ± 0.018 7.924 ± 0.016 0430442+260124 DK Tau 4.191 ± 0.030 2.399 ± 0.033 11.986 ± 0.071 8.719 ± 0.030 7.758 ± 0.024 7.096 ± 0.016 0430502+230008 IRAS 04278+2253 2.103 ± 0.019 0.198 ± 0.020 15.580 ± 0.364 8.778 ± 0.024 7.040 ± 0.015 5.855 ± 0.023 0430513+244221 ZZ Tau 6.831 ± 0.153 14.544 ± 1.000 9.495 ± 0.021 8.695 ± 0.029 8.441 ± 0.021 0430517+244147 ZZ Tau IRS 5.883 ± 0.069 2.903 ± 0.103 12.842 ± 0.023 11.435 ± 0.026 10.314 ± 0.023
0431341+180804 L1551 IRS5 2.794 ± 0.026 13.708 ± 0.060 11.505 ± 0.052 9.822 ± 0.035
0431361+181344 LkHa 358 5.437 ± 0.170 12.792 ± 0.032 10.922 ± 0.029 9.687 ± 0.021
0431384+181357 HL Tau 2.697 ± 0.030 -0.231 ± 0.058 10.624 ± 0.042 9.171 ± 0.046 7.410 ± 0.017 0431400+181357 XZ Tau 3.421 ± 0.079 13.678 ± 0.124 9.385 ± 0.027 8.148 ± 0.040 7.291 ± 0.024 0431505+242418 HK Tau 6.255 ± 0.019 3.428 ± 0.060 13.588 ± 0.900 10.451 ± 0.022 9.253 ± 0.022 8.593 ± 0.018 0431578+182137 V710 Tau 5.999 ± 0.282 4.013 ± 0.194 13.560 ± 1.000 9.279 ± 0.032 9.107 ± 0.030 8.654 ± 0.025 0432154+242859 Haro 6-13 4.501 ± 0.093 1.604 ± 0.061 11.237 ± 0.024 9.319 ± 0.020 8.101 ± 0.029 0432303+173139 GG Tau A 4.540 ± 0.111 2.599 ± 0.051 11.785 ± 0.019 8.674 ± 0.035 7.815 ± 0.026 7.364 ± 0.018
31
Table 3.2: continued.
IRC namea Identifier S9Wb L18Wc UCACd 2MASS J 2MASS H 2MASS KS
[mag] [mag] [mag] [mag] [mag] [mag]
0432317+242002 FZ Tau 4.138 ± 0.119 2.417 ± 0.030 13.352 ± 0.900 9.895 ± 0.022 8.400 ± 0.029 7.347 ± 0.017 0432320+225726 IRAS 04295+2251 1.947 ± 0.068 14.889 ± 0.044 11.982 ± 0.036 10.141 ± 0.024 0432429+255231 UZ Tau A 4.085 ± 0.022 2.247 ± 0.022 10.985 ± 1.000 9.136 ± 0.000 8.117 ± 0.000 7.354 ± 0.033 0432491+225303 JH112 5.189 ± 0.019 3.086 ± 0.047 15.093 ± 0.172 10.238 ± 0.027 8.995 ± 0.032 8.169 ± 0.023 0433062+240933 GH Tau 5.483 ± 0.137 3.804 ± 0.159 12.584 ± 1.000 9.109 ± 0.021 8.234 ± 0.027 7.794 ± 0.021 0433066+240955 V807 Tau 5.198 ± 0.089 3.638 ± 0.073 11.197 ± 1.000 8.146 ± 0.023 7.357 ± 0.026 6.960 ± 0.016 0433190+224633 IRAS 04303+2240 3.695 ± 0.060 2.000 ± 0.035 17.446 ± 1.000 11.103 ± 0.020 9.209 ± 0.023 7.673 ± 0.027 0433329+180059 HD 28867 5.092 ± 0.096 3.885 ± 0.256 6.466 ± 0.093 5.915 ± 0.035 5.813 ± 0.029 5.786 ± 0.023 0433341+242114 GI Tau 3.998 ± 0.127 1.848 ± 0.043 13.488 ± 1.000 9.341 ± 0.020 8.418 ± 0.021 7.888 ± 0.023 0433346+242106 GK Tau 4.478 ± 0.089 12.044 ± 1.000 9.053 ± 0.027 8.108 ± 0.026 7.468 ± 0.021 0433367+260949 IS Tau 5.662 ± 0.056 3.970 ± 0.047 10.323 ± 0.021 9.293 ± 0.023 8.642 ± 0.018 0433390+252038 DL Tau 4.749 ± 0.091 2.673 ± 0.041 12.894 ± 0.112 9.630 ± 0.021 8.679 ± 0.027 7.960 ± 0.021 0433394+175152 HN Tau 4.538 ± 0.061 2.574 ± 0.046 13.290 ± 0.124 10.699 ± 0.026 9.471 ± 0.027 8.384 ± 0.021 0433446+261500 SST Tau 043344.6+261500 6.791 ± 0.116 11.639 ± 0.021 10.385 ± 0.022 9.744 ± 0.018 0433519+225030 CI Tau 5.034 ± 0.093 2.926 ± 0.024 13.157 ± 0.142 9.480 ± 0.020 8.431 ± 0.040 7.793 ± 0.020 0433546+261326 IT Tau 5.661 ± 0.091 3.911 ± 0.169 13.073 ± 0.900 9.866 ± 0.025 8.591 ± 0.036 7.860 ± 0.026 0434554+242852 AA Tau 5.439 ± 0.017 3.556 ± 0.025 12.373 ± 1.000 9.433 ± 0.024 8.546 ± 0.023 8.047 ± 0.024 0435273+241458 DN Tau 5.816 ± 0.063 3.647 ± 0.120 12.171 ± 0.087 9.139 ± 0.021 8.342 ± 0.027 8.015 ± 0.021 0435410+241108 CoKu Tau/3 5.129 ± 0.072 3.664 ± 0.043 10.731 ± 0.026 9.197 ± 0.026 8.411 ± 0.024 0435473+225021 HQ Tau 4.208 ± 0.064 11.788 ± 0.144 8.655 ± 0.024 7.731 ± 0.016 7.135 ± 0.021 0435528+225422 HP Tau 4.383 ± 0.090 2.049 ± 0.031 14.090 ± 0.201 9.549 ± 0.022 8.469 ± 0.065 7.625 ± 0.024 0435568+225436 Haro 6-28 6.885 ± 0.072 15.986 ± 1.000 11.142 ± 0.022 10.055 ± 0.022 9.531 ± 0.020 0437514+262358 HT Tau 6.423 ± 0.143 12.859 ± 1.000 8.635 ± 0.026 7.542 ± 0.018 7.129 ± 0.018 0438285+261048 DO Tau 3.965 ± 0.050 1.706 ± 0.062 9.470 ± 0.022 8.243 ± 0.033 7.303 ± 0.017
0438352+261038 HV Tau 7.162 ± 0.264 9.227 ± 0.023 8.284 ± 0.026 7.906 ± 0.024
0439174+224753 VY Tau A 6.376 ± 0.123 13.385 ± 0.081 9.970 ± 0.023 9.260 ± 0.021 8.958 ± 0.020
32
Table 3.2: continued.
IRC namea Identifier S9Wb L18Wc UCACd 2MASS J 2MASS H 2MASS KS
[mag] [mag] [mag] [mag] [mag] [mag]
0439178+222103 LkCa 15 5.834 ± 0.109 4.117 ± 0.123 11.875 ± 0.128 9.424 ± 0.020 8.600 ± 0.018 8.163 ± 0.018 0439208+254501 GN Tau B 5.405 ± 0.149 3.515 ± 0.027 15.465 ± 0.900 10.196 ± 0.025 8.893 ± 0.026 8.060 ± 0.027 0439557+254501 IC2087 IRS 2.631 ± 0.077 0.839 ± 0.084 10.668 ± 0.023 8.052 ± 0.018 6.275 ± 0.018 0440080+260524 IRAS 04370+2559 5.278 ± 0.237 3.081 ± 0.361 12.406 ± 0.023 10.248 ± 0.029 8.869 ± 0.018 0441168+283959 CoKu Tau/4 3.532 ± 0.069 14.771 ± 0.135 10.163 ± 0.030 9.077 ± 0.024 8.656 ± 0.019 0441387+255624 IRAS 04385+2550 5.488 ± 0.046 2.745 ± 0.039 11.849 ± 0.023 10.123 ± 0.022 9.200 ± 0.018 0442077+252310 V955 Tau A 4.937 ± 0.041 3.270 ± 0.018 9.811 ± 0.022 8.601 ± 0.021 7.942 ± 0.016
0442210+252033 CIDA-7 7.088 ± 0.058 11.397 ± 0.023 10.575 ± 0.022 10.169 ± 0.018
0442376+251537 DP Tau 4.898 ± 0.058 2.641 ± 0.056 15.058 ± 0.900 10.995 ± 0.021 9.689 ± 0.017 8.760 ± 0.016 0446530+165959 DQ Tau 5.093 ± 0.031 2.820 ± 0.065 13.253 ± 0.180 9.511 ± 0.021 8.544 ± 0.020 7.981 ± 0.021 0446590+170238 Haro 6-37 A 4.597 ± 0.019 2.747 ± 0.064 13.655 ± 1.000 9.239 ± 0.028 7.991 ± 0.021 7.310 ± 0.024 0447062+165842 DR Tau 3.552 ± 0.020 12.187 ± 0.410 8.845 ± 0.024 7.799 ± 0.053 6.874 ± 0.017 0447485+292511 DS Tau 5.621 ± 0.085 4.245 ± 0.050 12.490 ± 0.165 9.465 ± 0.018 8.597 ± 0.033 8.036 ± 0.029 0451473+304712 UY Aur A 3.479 ± 0.018 1.152 ± 0.016 12.151 ± 0.137 9.134 ± 0.020 7.987 ± 0.016 7.239 ± 0.018 0452066+304717 IRAS 04489+3042 5.826 ± 0.067 3.246 ± 0.041 14.426 ± 0.030 12.021 ± 0.021 10.383 ± 0.018 0452096+303744 Haro 6-39 7.023 ± 0.181 4.539 ± 0.110 13.254 ± 0.021 12.117 ± 0.018 11.187 ± 0.018 0455095+182629 HD 31281 7.221 ± 0.257 9.105 ± 0.088 7.974 ± 0.027 7.681 ± 0.017 7.609 ± 0.029 0455110+302159 GM Aur 6.793 ± 0.063 3.338 ± 0.131 9.341 ± 0.018 8.603 ± 0.024 8.283 ± 0.017 0455458+303303 AB Aur 1.185 ± 0.016 -0.841 ± 0.026 7.543 ± 0.157 5.936 ± 0.018 5.062 ± 0.020 4.230 ± 0.016 0455560+303622 XEST26-062 6.521 ± 0.154 4.230 ± 0.089 15.339 ± 0.054 10.471 ± 0.021 9.660 ± 0.018 9.267 ± 0.019 0455593+303401 SU Aur 3.445 ± 0.016 0.671 ± 0.017 9.057 ± 0.027 7.199 ± 0.020 6.558 ± 0.020 5.990 ± 0.023 0457065+314250 RXJ0457.0+3142 6.108 ± 0.055 10.002 ± 0.081 7.486 ± 0.021 6.756 ± 0.018 6.538 ± 0.023 0503066+252319 V836 Tau 6.378 ± 0.297 13.817 ± 0.203 9.913 ± 0.023 9.077 ± 0.029 8.595 ± 0.019 0505228+253131 CIDA-9 6.337 ± 0.062 4.870 ± 0.021 16.870 ± 1.000 12.808 ± 0.035 11.913 ± 0.043 11.161 ± 0.029 0507495+302404 RW Aur A 3.453 ± 0.047 1.620 ± 0.036 9.878 ± 0.076 8.378 ± 0.024 7.621 ± 0.038 7.020 ± 0.018 0529083+115212 1RXS J052908.4+115207 2.605 ± 0.017 0.168 ± 0.024 9.443 ± 0.049 7.698 ± 0.030 7.103 ± 0.029 6.590 ± 0.029
33
Table 3.2: continued.
IRC namea Identifier S9Wb L18Wc UCACd 2MASS J 2MASS H 2MASS KS
[mag] [mag] [mag] [mag] [mag] [mag]
0529406+291110 1RXS J052940.9+291058 5.039 ± 0.037 6.260 ± 0.265 5.314 ± 0.020 5.208 ± 0.252 5.028 ± 0.021 0536516+232605 1RXS J053652.7+232600 6.789 ± 0.209 8.591 ± 0.032 7.328 ± 0.029 7.022 ± 0.021 6.913 ± 0.020 0537184+133452 1RXS J053718.4+133453 7.056 ± 0.016 9.377 ± 0.030 8.105 ± 0.024 7.720 ± 0.020 7.593 ± 0.020
a The source must be referred to in the literatures by its full name: AKARI-IRC-V1 J0123456+765432, where V1 refers to the version code.
b The zero-magnitude flux density is 56.262 Jy for the S9W band.
c The zero-magnitude flux density is 12.001 Jy for the L18W band.
d The UCAC magnitude is derived from aperture photometry.
34
Table 3.3: AKARI (FIS) photometric data for the previously known Taurus members.
FIS namea Identifier FLUX65 FLUX90 FLUX140 FLUX160
[Jy] [Jy] [Jy] [Jy]
0413547+281129 IRAS 04108+2803 A 5.85 ± 0.40 7.39 ± 0.50 9.40 ± 2.45 7.58 ± 1.66
0413580+291818 IRAS 04108+2910 0.39 ± 0.04
0414129+281229 V773 Tau 0.85 ± 0.07
0414148+282801 FN Tau 1.31 ± 0.09
0414172+281102 CW Tau 1.63 ± 0.12
0414263+280559 IRAS 04113+2758 A 10.65 ± 0.79 13.11 ± 0.31 12.56 ± 0.88 0415425+290959 SST Tau 041542.7+290959 1.26 ± 0.06
0418323+283112 IRAS 04154+2823 1.95 ± 0.10
0418410+281921 V892 Tau 57.20 ± 1.67 39.04 ± 1.64
0418415+282721 LR1 1.09 ± 0.10
0419025+281922 V410 X-ray 6 0.28 ± 0.05
0420268+280409 SST Tau 042026.0+280408 0.42 ± 0.02
0421557+275509 DE Tau 1.10 ± 0.09
0422013+265730 FS Tau B 6.83 ± 0.46 7.98 ± 0.54 8.02 ± 2.53 5.41 ± 1.10
0422551+282348 NSV 1577 2.23 ± 0.04 3.05 ± 0.98
0423078+280553 IRAS 04200+2759 0.45 ± 0.09
0423394+245618 FT Tau 0.84 ± 0.04
0424446+261016 IRAS 04216+2603 1.07 ± 0.07
0426528+260704 FV Tau 1.70 ± 0.15 3.37 ± 5.16 5.57 ± 0.99
0427042+260616 DG Tau A 21.26 ± 0.77 23.99 ± 0.86 37.03 ± 7.30
0427569+261922 IRAS 04248+2612 4.23 ± 1.05 5.20 ± 0.52 13.27 ± 3.97 18.05 ± 2.29
0429051+264910 IRAS 04260+2642 1.30 ± 0.16
0429236+243315 GV Tau 46.70 ± 7.25
35