Brain networks of social action-outcome contingency
Sumiya, Motofumi
DOCTOR OF PHILOSOPHY
SOKENDAI (The Graduate University for Advanced Studies) School of Life Science
Department of Physiological Sciences
1. Summary
Social interactions play a critical role in the development of social and
cognitive skills. Social interactions can be facilitated by action-outcome contingency, in which self-actions result in relevant responses from others. Previous studies have indicated that the striatal reward system plays a role in generating signals associated with action-outcome contingency. How is this signal generated in the striatal reward system? The action-outcome contingency signal is dependent upon two types of signals: a signal representing the individual’s own action and a signal associated with the
outcome of that action. However, as these signals have not been evaluated separately in previous studies, the mechanisms wherein signals associated with self-actions and their outcomes are integrated in order to generate an action-outcome contingency signal are not well understood.
Among a distributed set of brain regions associated with processing of self- related information, the medial prefrontal cortex (mPFC) is consistently reported and thus proposed as a critical node of self-related processing. It have been proposed that the self-reference increases the coupling between brain regions that are assigned to different stages of information processing. This raises the possibility that signals from components of the self-related network such as the mPFC modulate the input of sensory signals of the outcome to value processing in order to generate action-outcome
contingency signals.
In the present study, I conducted a functional magnetic resonance imaging (fMRI) experiment on 38 healthy human participants in order to test the hypothesis that local brain activity representing the self modulates connectivity between the striatal reward system and sensory regions that process the responses of others. I employed a
social action-outcome contingency task in which the participant attempted to make a listener laugh by telling funny jokes. In this task, the utterance was regarded as the action, and the laughter was regarded as the outcome. Two factors were manipulated: the speaker of the joke (self or another) and the listener’s response (a sound of group or single laughter and no laughter). The participants rated subjective pleasure after the listener’s response in each trial. In the fMRI data analysis, I evaluated brain activity when the participant heard the listener’s response to an uttered joke.
Participants reported more pleasure when greater laughter followed the utterance of their own jokes than those of another. This result indicates that action- outcome contingency increases subjective pleasure, consistent with previous findings that action-outcome contingency increases positive response to social interactions. As results of fMRI data analysis, the listener’s responses to the participant’s utterance produced stronger activation in the mPFC than those to another’s utterance. Greater activation was observed in the auditory cortex when laughter followed the utterance, relative to no response following the utterance. Laughter activated the ventral striatum more strongly when the participants made the listeners laugh than when another did. Then, I conducted physio-physiological interaction (PPI) analyses in order to test the hypothesis that self-related activity in the mPFC modulates the functional connectivity between the auditory cortices and reward system. In the PPI analyses, the ventral striatum showed interaction effects with regard to signals extracted from the mPFC and auditory cortex. I also observed a significant correlation between the interaction term of subjective pleasure and PPI effect at the top peak coordinate of the left ventral striatum. These results provide supporting evidence for the hypothesis that the mPFC, which is implicated in self-related processing, gate sensory input of the other’s response to value
processing in the ventral striatum.
In conclusion, using a social action-outcome contingency task in which participants made a listener laugh by telling funny jokes, I found that the ventral striatum showed interaction of two signals: a signal from auditory cortex and a signal from mPFC that was sensitive to self actions. These results suggest that self-relevant signals from the mPFC modulate sensory input of the outcome to value processing in the reward system.
2. INTRODUCTION
Social interactions play a critical role in the development of social and cognitive skills (Goldstein et al., 2003; Kuhl et al., 2003; Csibra and Gergely, 2006; Meltzoff et al., 2009; van de Pol et al., 2010). Social interactions can be facilitated by action-outcome contingency (Jones and Gerard, 1967), in which one’s own actions result in relevant responses from others. Social action-outcome contingency can lead to longer
interactions that are associated with positive responses (e.g., smiling in children) (Matarazzo et al., 1964; Legerstee and Varghese, 2001; Soussignan et al., 2006; Gratch et al., 2006) and enhance improvements in motor skills (Dobkin et al., 2010; Sugawara et al., 2012).
Previous neuroimaging studies have highlighted the role of the striatal reward system in action outcome-contingency (O’Doherty et al., 2004; Tricomi et al., 2004; Zink et al., 2004; Tanaka et al., 2008; Li and Daw, 2011; FitzGerald et al., 2014). For instance, Zink et al. (2004) postulated that action-outcome contingency is related to the saliency of the reward. In their functional magnetic resonance imaging (fMRI) study, saliency of a monetary reward was manipulated according to whether its receipt depended on the correct detection of a target (active task) or was completely independent of such detection (passive task). Significant caudate and nucleus
accumbens (NAcc) activation occurred following the active compared to passive task. This action-outcome contingency signal is considered critical for instrumental learning, which may be used to update expected values of an action (O’Doherty et al., 2004; Hare et al., 2008), action preferences (Li and Daw, 2011), or reflect the success of the action that leads to the desirability of repeating it in the future (FitzGerald et al., 2014). In the present study, I focused our investigation on one basic question related to action-
outcome contingency signals: How is this signal generated in the striatal reward system? The action-outcome contingency signal is dependent upon two types of signals: a signal representing the individual’s own action and a signal associated with the outcome of that action. However, as these signals have not been evaluated separately in previous studies, the mechanisms wherein signals associated with self-actions and their outcomes are integrated in order to generate an action-outcome contingency signal are not well understood.
Although the nature of the self-concept is inherently complex, previous neuroimaging studies have suggested that activity in a distributed set of brain regions associated with information processing is altered by the presence of self-related information (Northoff et al., 2006; Uddin et al., 2007; Sugiura, 2013 for review). Among these regions, the medial prefrontal cortex (mPFC) is consistently reported and thus proposed as a critical node of self-related processing. For instance, a recent meta- analysis showed that a part of the mPFC was more frequently activated by self-related judgments than other-related judgments (Denny et al., 2012). The mPFC is sensitive to social signals directed at the self (e.g., hearing their own name compared to a different name) (Kampe et al., 2003). Sui and Humphreys (2015) proposed that the self-reference increases the coupling between brain regions that are assigned to different stages of information processing. This raises the possibility that signals from components of the self-related network such as the mPFC modulate the input of sensory signals of the outcome to value processing in order to generate action-outcome contingency signals.
In the present study, I conducted an fMRI 39 healthy adult volunteers. I employed a task in which the participant attempted to make a listener laugh by telling funny jokes. In this task, the utterance was regarded as the action, and the laughter was
regarded as the outcome. Two factors were manipulated: the speaker of the joke and the listener’s response. I evaluated brain activity when the participant heard the listener’s response to an uttered joke. I hypothesized that self-related activity in the mPFC modulates sensory input during the processing of outcome values, which is represented by the functional connectivity between the auditory cortex and striatum.
3. Materials and Methods 3.1. Participants
Thirty-nine healthy individuals aged 19 to 29 years (20 men and 19 women; mean age = 21.2 years; standard deviation [SD] = 1.8 years) participated in the study. I analyzed data from 38 participants [19 men and 19 women, aged 19 to 29 years, mean ± SD age = 21.15 ± 1.79 years], after excluding one participant from the analysis due to excessive head motion (over 2 mm in each run). All participants were native Japanese speakers and right-handed according to the Edinburgh Handedness Inventory (Oldfield, 1971). No participants had a history of symptoms requiring neurological, psychological, or other medical care. All participants provided written informed consent. The study was approved by the ethical committee of the National Institute for Physiological Sciences of Japan. All methods were carried out in accordance with the approved guidelines.
3.2. Experimental design
Participants completed two tasks: the pseudo-interactive joke task and the supplementary gambling task. The gambling task was conducted after the pseudo- interactive joke task and was used to confirm overlapping activity in the striatum between the two tasks. In total, the experiment lasted 2.5 h.
3.3. Pseudo-interactive joke task
In this task, one of the two actors (SELF or PC) was asked to utter a joke (speaker) and listen to the response of a listener after the utterance. There were three listener responses (Group laughter, Single laughter, and No laughter). Accordingly, this
task contained six conditions: SELF_Group (i.e., the self-utterance of a joke followed by group laughter), SELF_Single, SELF_No, PC_Group, PC_Single, and PC_No conditions.
Stimuli
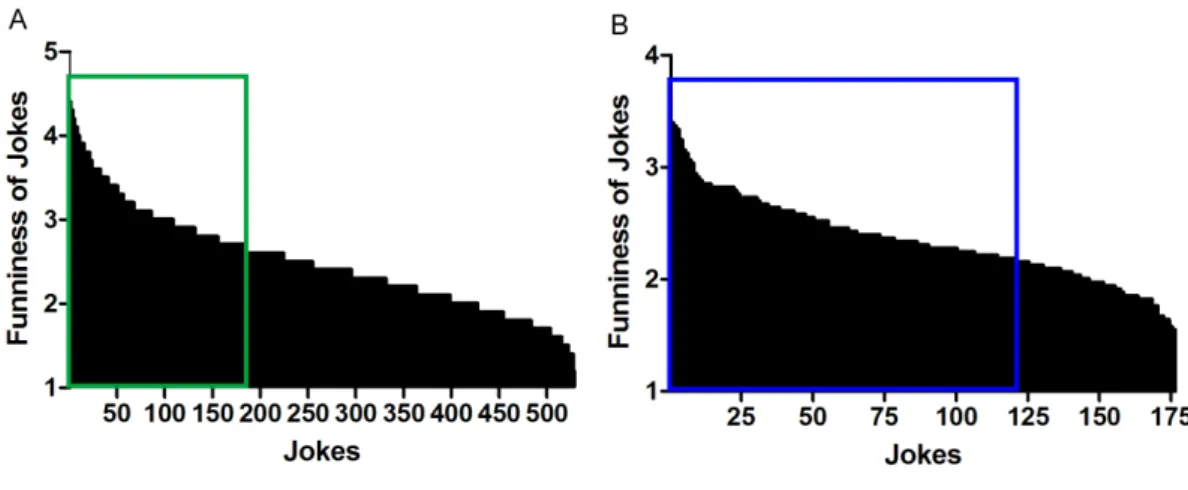
Selection of jokes. I initially prepared 528 jokes from a Japanese TV show program (IPPON GRAND PRIX; Fuji Television Network, Inc., Tokyo, Japan). I then conducted two rating tests with a 7-point Likert scale; the 176 jokes with the highest ratings were chosen by 11 volunteers (7 men and 4 women, aged 26 to 36 years, mean ± SD age = 29.36 ± 3.55 years) (Figure 1A), and the 120 funniest jokes among these 176 jokes were further selected by another 33 volunteers (22 men and 11 women, aged 21 to 39 years, mean ± SD age = 25.72 ± 4.26 years) (Figure 1B). Finally, I chose 90 of these 120 jokes in which the number of mora in the punchline was matched (mean ± SD = 16.57 ± 7.84 years) (see Appendix 1 for the list of jokes in Japanese). I also chose eight jokes among the unchosen jokes for use in practice trials.
Listener responses. I used two types of laughter: One type represented laughter from multiple individuals (Group laughter), and the other type represented laughter from a single person (Single laughter). I selected sound files available on the internet (SONICWIRE, http://sonicwire.com/) and edited them such that the laughs were gender-ambiguous and matched in length (3.3 s) (Adobe Audition 3.0, Adobe Systems Inc., San Jose, CA, USA). The sound pressure levels were adjusted such that the participants could hear the responses comfortably during the scanning. Three experimenters confirmed that they felt subjective pleasure when these stimuli were presented after they uttered the punchline of a joke. In addition to the Group and Single laughter stimuli, I prepared a stimulus that had the same length of silence with no laugh
(No laughter).
Pairing jokes with listener responses. The 90 funniest jokes were categorized into six sets (15 jokes in each set) such that the mean rating of funniness was matched between them. Each set was pseudo-randomly chosen for each task condition.
Stimulus presentation
Participants lay in the MR scanner with their ears plugged and tight but with comfortable foam padding placed around each participant’s head. I used Presentation software (Neurobehavioral Systems, Albany, CA, USA) (RRID: SCR_002521) to present visual and auditory stimuli and record button responses. Visual stimuli were projected with a liquid-crystal display projector (CP-SX12000J; Hitachi Ltd., Tokyo, Japan) onto a half-transparent screen. Participants viewed stimuli via a mirror placed above the head coil. The viewing angle was large enough for participants to observe stimuli (13.1° [horizontal] × 10.5° [vertical] at maximum). Participants listened to auditory stimuli through ceramic headphones (KIYOHARA-KOUGAKU, Tokyo, Japan). Participants’ utterances were recorded with an opto-microphone system (KOBATEL Corporation, Kanagawa, Japan). Behavioral responses were collected via an optical button box (HHSC-1×4; Current Designs Inc., Philadelphia, PA, USA). Cover story
Participants were instructed to read the punchline of the jokes aloud in one condition, whereas they were asked to listen to a synthesized voice (PC) reading aloud the punchline of other jokes in the other condition. Participants were encouraged to read the punchline in a funny way. Before the experiment, participants met an individual whose gender was the same as their own; they were told that this individual would be listening to the jokes in another room and evaluating the funniness of the jokes by
pressing buttons corresponding to one of the three auditory responses. The participants were told that this listener was different from the reader of the joke in the PC condition. Although the listener’s response was pre-determined (as described in the section on stimuli), participants were told that the listener evaluated the funniness of the joke. I confirmed that all participants believed this explanation.
Task schedule
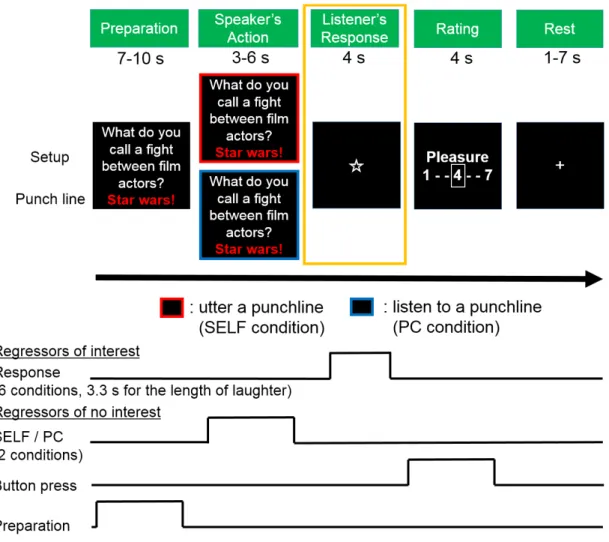
Participants conducted three runs, each of which lasted for 810 s (810 volumes per run). Each run consisted of 30 trials lasting for 25 s (750 s). Each of the 6 conditions was presented 5 times in each run. I inserted a 35 s baseline before the first trial and a 25 s baseline after the last trial (750 + 60 = 810 s). Figure 2 shows the task schedule of each trial. One trial consisted of five phases: Preparation, Speaker’s Action, Listener’s Response, Rating, and Rest (Figure 2).
Preparation phase. The setup and punchline of a joke were visually presented on the screen. Four seconds after the appearance of the joke, the setup was read aloud by the PC. This phase took between 7 and 10 s in total, depending on the length of the joke.
Speaker’s Action phase. One of the two frame colors was superimposed on the visual stimuli. When a red frame appeared, the participant was asked to read the punchline aloud (SELF condition). Conversely, when a blue frame was presented, the participant was asked to listen to the punchline that was read aloud by the PC (PC condition). This phase took 3 s to 6 s depending on the length of the joke.
Listener’s Response phase. One of the three levels of laughter was presented while a star mark was visually presented for 4 s (Group laughter/Single laughter/No laughter). In the Group or Single laughter conditions, participants heard 3.3 s of laughter
0.5 s after the star mark appeared. No sound was presented in the No laughter condition. Rating phase. Participants reported the degree of subjective pleasure using a 7- point Likert scale (1 = no pleasure, 7 = very pleasurable). Participants pressed two buttons with their right index and middle fingers to choose their subjective pleasure rating. The initial position of choice was pseudo-randomized on the rating scale.
Rest phase. Finally, I inserted a resting period such that the duration of each trial was 25 s. The duration of this phase varied from 1 to 7 s.
3.4. Data acquisition
I used a 3 T whole-body scanner (Verio; Siemens Erlangen, Germany) with a 32-element phased-array head coil. In order to obtain T2*-weighted (functional) images, I employed a multiband echo-planar imaging (EPI) sequence that collected multiple EPI slices simultaneously and reduced the volume repetition time (TR) (Moeller et al., 2010). I utilized the following sequences to cover the whole brain: TR = 1 s; echo time (TE) = 30 ms; flip angle (FA) = 80°; field-of-view (FOV) = 192 x 192 mm; in-plane resolution = 2 mm x 2 mm; 60 2-mm axial slices with 0.5 mm slice gap; and multiband factor = 6. Between the functional runs, I obtained anatomical T1-weighted scans that covered the whole brain (voxel size = 1 mm x 1 mm x 1 mm). I used an MP2RAGE (Magnetization Prepared 2 Rapid Acquisition Gradient Echoes) sequence that provided anatomical images with high contrast between gray and white matter (Marques et al., 2010).
3.5. Data processing
Image processing and statistical analyses were performed using the statistical
Parametric Mapping (SPM8) package (Friston et al., 2007) (RRID: SCR_007037). The first 10 functional images were discarded in each run to allow the signal to reach a state of equilibrium. The remaining volumes were used for subsequent analyses. To correct for the participant’s head motion, functional images from each run were realigned to the first image, and again realigned to the mean image after the first realignment. After the T1-weighted anatomical images were segmented into different tissue classes, each participant’s T1-weighted anatomical image was co-registered with the mean image of all EPI images for each participant. The co-registered anatomical images were spatially normalized to the standard Montreal Neurological Institute (MNI) T1 brain template (ICBM 152) (Evans et al., 1993; Friston et al., 1995). Normalized fMRI images were filtered using a relatively small spatial smoothing kernel (4 mm at full-width half- maximum [FWHM]) to accurately determine the location of the regions in the basal ganglia (e.g., the ventral striatum) at the group level (Sacchet and Knutson, 2012).
3.6 Statistical analysis
Behavioral data were analyzed with SPSS software (RRID: SCR_002865). Concerning fMRI data analysis, linear contrasts between conditions were calculated for individual participants and incorporated into a random-effects model to make inferences at a population level (Holmes and Friston, 1998).
Initial individual analysis
After preprocessing, task-related activation was evaluated using a general linear model (Friston et al., 1994; Worsley and Friston, 1995). The design matrix contained regressors of three fMRI runs. Each run included six regressors of interest (2 Speakers × 3 Listener’s Responses) that were modeled at the onsets of listener's
responses. The duration of each regressor was 3.3 s, corresponding to the duration of the auditory response (Figure 2). In addition, each run also included the following five regressors: one regressor for the Preparation phase, two regressors for the Speaker’s Action phase (SELF or PC), one regressor for the Rating phase, and one regressor for the button press. I confirmed weak correlations between regressors of the Speaker’s Action phase and regressors of the Listener’s Response phases (mean r value = 0.24, ranging from 0.23 to 0.25). The blood-oxygen-level dependent (BOLD) signal for all the tasks was modeled with boxcar functions convolved with a canonical hemodynamic response function characterized by two gamma functions, one modeling the peak and one modeling the undershoot. Six regressors of rigid-body head motion parameters (three displacements and three rotations) were included as regressors of no interest. I also applied a high-pass filter with a cut-off of 128 s to remove low-frequency signal components. Assuming a first-order autoregressive model, the serial autocorrelation was estimated from the pooled active voxels with the restricted maximum likelihood
(ReML) procedure and used to whiten the data (Friston, 2002). No global scaling was performed. To calculate the estimated parameters, a least-squares estimation was performed on the whitened data. The weighted sum of the parameter estimates in the individual analyses constituted contrast images. The contrast images obtained from the individual analyses represented the normalized task-related increment of the MR signal of each participant.
Subsequent random-effects analysis
Contrast images from the individual analyses were used for the group analysis. I adopted a flexible factorial design to construct a single design matrix involving 2 × 3 task conditions in the Listener’s Response phase. All conditions were modeled as
within-subject (dependent) levels, and unequal variance among conditions was assumed. The estimates for the conditions were compared using linear contrasts. The resulting set of voxel values for each contrast constituted a statistical parametric map of the t statistic (SPM {t}).
Given our hypotheses, I evaluated the following predefined contrasts. The effect of self-action was evaluated as [(SELF_Group + SELF_Single + SELF_No) - (PC_Group + PC_Single + PC_No)] (SELF minus PC). The effects of listeners’ responses were evaluated as either [(SELF_Group + PC_Group) - (SELF_No + PC_No)] (Group minus No Laughter), [(SELF_Single + PC_Single) - (SELF_No + PC_No)] (Single minus No Laughter), or [(SELF_Group + PC_Group) - (SELF_Single + PC_Single)] (Group minus Single). Finally, action-outcome contingency effects were evaluated as [(SELF_Group - SELF_No) - (PC_Group - PC_No)], [(SELF_Single - SELF_No) - (PC_Single - PC_No)], or [(SELF_Group - SELF_No) - (PC_Group - PC_No)]. The threshold for the SPM{t} was set at t(222) > 3.13 (equivalent to p < 0.001 uncorrected). The statistical threshold for the spatial extent test on the clusters was set at p < 0.05 and corrected for multiple comparisons [family-wise error (FWE)] over the whole brain (Friston et al., 1996).
I evaluated brain activation after excluding any activation outside the gray matter with the masking procedure. Brain regions were anatomically defined and labeled according to probabilistic atlases (Desikan et al., 2006; Shattuck et al., 2008). Furthermore, I used an atlas of the human brain (Mai et al., 2007) to confirm the structures in and around the ventral striatum.
Physio-Physiological Interaction (PPI) analysis
I conducted physio-physiological interaction (PPI) analyses (Friston et al.,
1997) in order to test the hypothesis that self-related activity in the mPFC modulates the functional connectivity between the auditory cortices (AC) and reward system.
Definition of seed regions. I identified the top peak coordinates of activation depicted by each effect of the joke task: the mPFC by the effect of self action, and the bilateral AC by the effect of the listener’s response. I defined 8 mm radius spheres centered on these peak coordinates as seed regions. I extracted the time series of the signal from each seed region after excluding the effects of no interest with F contrasts.
Calculation of physio-physiological interaction (PPI) terms. I then calculated the PPI terms between the mPFC and each hemisphere of the AC in the following four steps. First, the MR signal from each seed region was extracted as an eigenvariate time series. Second, the extracted MR signal was deconvolved with the canonical hemodynamic response function (HRF). The resulting time series represented an approximation of neural activity (Gitelman et al., 2003). Third, the two neural time series were detrended and multiplied (dot product) so that the resulting time series represented the interaction of neural activity between the two seed regions. Finally, the interaction time series was convolved with the HRF, representing an interaction variable at the hemodynamic level (PPI term).
Individual and group analysis. For each participant, I constructed two design matrices that involved each hemisphere of the AC. Each design matrix involved nine regressors: the PPI term between the AC and mPFC, two regressors representing the time-series of the MR signal of the seed regions, and six regressors representing head motion effects. As a group analysis, I conducted one-sample t-tests on the contrast images from these individual analyses. I applied the same statistical thresholds utilized for the analysis of brain activation (P < 0.05 FWE corrected at cluster level, with
threshold at t(37) > 3.33 corresponding to p < 0.001 uncorrected).
3.7. The gambling task
I conducted the same gambling task utilized in our previous study (Izuma et al., 2008). The task involved two conditions: the monetary-reward (MR) condition, in which a reward could be obtained, and the no monetary-reward (NoMR) condition, in which no reward could be obtained. The main purposes of this task were to depict regions of activity that depend on the degree of the outcome obtained in the MR condition and to determine whether such outcome-dependent activation in the MR condition overlapped with action-outcome contingency effects observed in the joke task.
Task design
Participants completed two runs, each of which lasted for 615 s. Each run consisted of fifteen 39 s blocks (10 MR blocks and 5 NoMR blocks). In each block, a 24 s task block was followed by a 15 s rest period. Twenty and 10 s rest periods were also added before the first block and after the last block, respectively [15 blocks × (24 s task block + 15 s rest period) + 30 s = 615 s]. The order of MR and NoMR blocks was pseudo-randomized.
Each task block consisted of eight 3-s trials. In each trial, the participants were presented with three cards labeled as “A,” “B,” or “C” for 2 s (card presentation phase) and were asked to choose one card by pressing one of three buttons. The card labels (A, B, and C) were shown in red in the MR trials, whereas the labels were blue in the NoMR trials. After this phase, the chosen card was highlighted with a thick white line, and the outcome was displayed for 1 s (outcome phase). In MR trials, “0,” “30,” or “60”
was presented as the outcome, each representing Japanese YEN (JPY). In the NoMR trials, “×××” was presented regardless of the choice of labels.
Before the experiment, participants were encouraged to earn as much money as possible and were told that the total amount of money earned would be added to the base payment for participation. The total amount of obtained outcome in each MR trial varied between 90 and 390 JPY. After the experiment was complete, however, all participants were paid the same amount of reward (2,000 JPY), regardless of the outcomes obtained in the MRI condition.
Statistical analysis
I conducted the same analysis as for the pseudo-interactive joke task, except that I used a different design matrix at the individual and group analyses. A design matrix of the gambling task at individual analysis comprised the two runs. I conducted a parametric modulation analysis using the reward value (0, 30, and 60 JPY) to determine which regions exhibited activity that was correlated with the reward valuation (Büchel et al., 1996). Each run included three task regressors of interest: two regressors that modeled the outcome phase in the MR and NoMR conditions and a regressor modeling the amount of the outcome in the outcome phase in the MR condition. I also included the following regressors: the card presentation phase and six regressors of rigid-body head motion parameters. I applied the same high-pass filter and autoregressive model to the data. The parameters for a regressor modeling the amount of the outcome in the outcome phase of the MR condition were estimated and evaluated. I collected the results of the individual analyses (contrast images) from each participant and conducted a group analysis using one-sample t-tests. The same statistical threshold utilized in the main analysis was applied.
I then defined an 8-mm radius sphere with the peak coordinates of the cluster of activation as the region of interest (ROI). This radius was identical to the effective resolution (final smoothness) of the statistical parametric maps (i.e., 8.3 mm) in the pseudo-interactive joke task. I averaged the contrast estimates in all voxels within each ROI and compared them between the conditions.
4. Results
4.1. Behavioral results
The participants rated subjective pleasure after the listener’s response in each trial (Figure 2). Greater laughter yielded greater pleasure in both the SELF and PC conditions, whereas the increment of the pleasure rating between the listener’s responses was greater for the SELF than PC condition (Figure 3). Two-way repeated- measures analysis of variance (ANOVA; 2 levels of Speaker × 3 levels of Listener’s Response) of the pleasure rating revealed a significant main effect of Speaker (F(1, 37) = 24.1, p < 0.0001), a significant main effect of Listener’s Response (F(2, 74) = 99.5, p < 0.0001), and a significant interaction (F(2, 74) = 37.9, p < 0.0001). Post hoc pairwise comparisons with Bonferroni’s correction confirmed that all Listener’s Responses differed significantly for the SELF (p values < 0.0001) but not for the PC condition (Group vs. Single, p = 0.161; Group vs. No, p = 0.006; Single vs No, p = 0.003). Rating scores for the SELF were significantly greater than those for the PC in the Group Laughter (p < 0.0001) and Single Laughter conditions (p = 0.0001), whereas the rating in the No Laughter condition was significantly lower in the SELF than in the PC conditions (p < 0.0001).
4.2. Functional MRI results
The effect of self action (SELF minus PC)
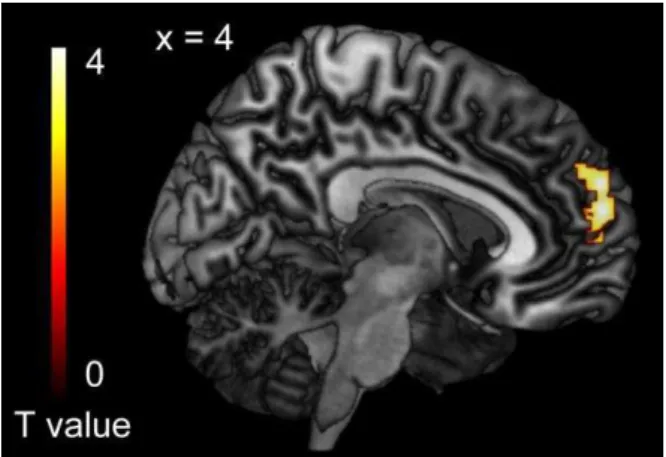
The contrast of SELF minus PC [(SELF_Group + SELF_Single + SELF_No) - (PC_Group + PC_Single + PC_No)] revealed significant activation only in the mPFC (Figure 4). The peak coordinate was located at x = 4, y = 58, z = 16, corresponding to Brodmann area 10 (Lancaster et al., 2000, Table 1).
The effects of the listener’s response
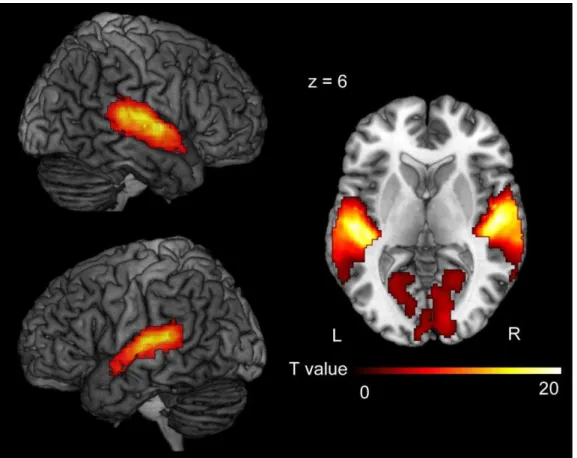
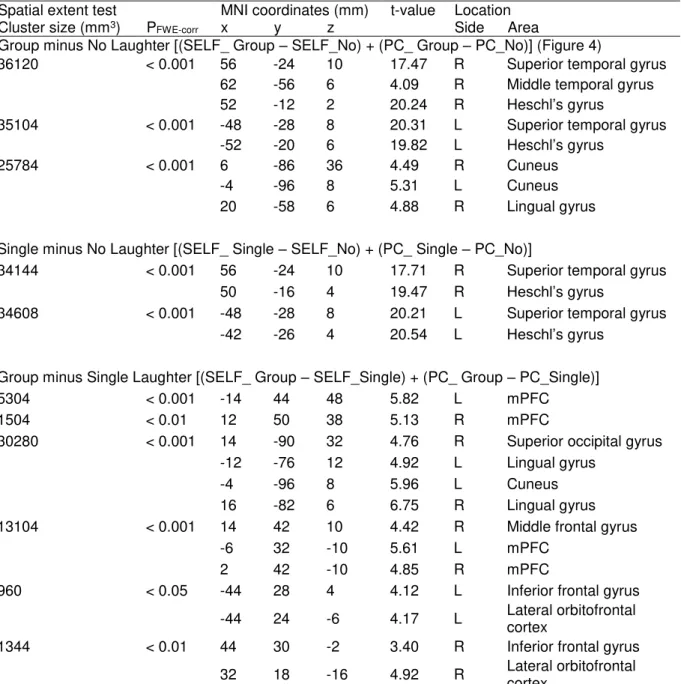
Group minus No laughter. The contrast of Group minus No laughter [(SELF_Group + PC_Group) - (SELF_No + PC_No)] revealed regions of significant activation in the bilateral superior temporal gyrus, bilateral Heschl’s gyrus, and bilateral cuneus, as well as the right middle temporal gyrus and right lingual gyrus (Figure 5 and Table 2).
Single minus No laughter. The contrast of Single minus No laughter [(SELF_Single + PC_Single) - (SELF_No + PC_No)] revealed regions of significant activation in the bilateral superior temporal gyrus and bilateral Heschl’s gyrus.
Group minus Single laughter. The contrast of Group minus Single laughter [(SELF_Single + PC_Single) - (SELF_No + PC_No)] revealed regions of significant activation in the bilateral mPFC, bilateral lingual gyrus, bilateral inferior frontal gyrus, bilateral lateral orbitofrontal cortex, right superior occipital gyrus right middle frontal gyrus, and left cuneus. No overlap of activation with the effect of self action was observed.
The effect of action-outcome contingency
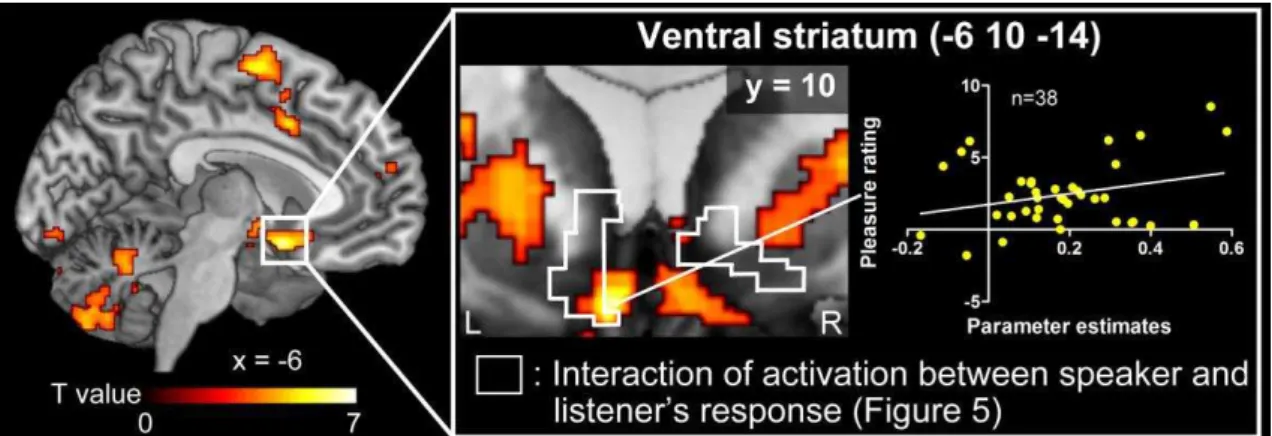
The contrast of action-outcome contingency effect [(SELF_Group – PC_Group) - (SELF_No – PC_No)] revealed regions of significant activation in the ventral striatum (VS): the bilateral NAcc, bilateral ventral caudate nucleus, and right putamen (Figure 6 and Table 3). Moreover, the same contrast revealed significant activation in the right lingual gyrus and right inferior occipital gyrus. At a more lenient threshold (T > 3.13 without FWE correction at the cluster level), I observed activation in the ventral mPFC (x = -8, y = 54, z = -2). None of the other contrasts related to action-outcome contingency [(SELF_Single – PC_Single) - (SELF_No – PC_No) and
(SELF_Group – PC_Group) - (SELF_Single – PC_Single)] revealed significant activation.
In order to further validate the action-outcome contingency effect, I examined brain activity related to the amount obtained in the gambling task. The premise in this analysis was that the VS is sensitive to reward, regardless of whether the reward is monetary or social (Izuma et al., 2008). Our analysis revealed significant activation in the following areas: bilateral NAcc, left precentral gyrus, right superior frontal gyrus, right superior parietal lobule, bilateral precuneus, left supramarginal gyrus, bilateral angular gyrus, bilateral posterior cingulate gyrus, bilateral mPFC, bilateral middle and inferior frontal gyrus, bilateral caudate nucleus, bilateral inferior occipital gyrus, right middle occipital gyrus, bilateral lateral orbitofrontal cortex, left middle temporal gyrus, bilateral putamen, and bilateral cerebellum (Table 4). I defined ROIs of the VS
according to the top peak coordinates in the NAcc (x = 10, y = 6, z = -8 for the right hemisphere and x = -8 y = 4 z = -10 for the left hemisphere). These ROIs exhibited action-outcome contingency effects not only between group and no laughter, but also between group and single laughter (Figure 7).
Physio-Physiological Interaction (PPI) Analyses
I observed the action-outcome contingency effect in brain regions including the VS. In addition, the mPFC exhibited effects related to self action, whereas the effects of listener’s response were associated with brain regions such as the AC. I then tested our prediction that the mPFC modulates functional connectivity between the sensory cortex and VS using PPI analyses (Friston et al., 1997). I defined seed regions as 8 mm radius spheres around the top peak coordinates of each region: the mPFC (x = 4, y = 58, z = 16), right AC (in Heschl’s gyrus [x = 52, y = -12, z = 2]), and left AC (in the superior
temporal gyrus [x = -48, y = -28, z = 8]). The coordinates of the AC were chosen based on the contrast of Group minus No laughter, as its interaction with the effect of self action [(SELF_Group – PC_Group) - (SELF_No – PC_No)] alone revealed significant activation in the VS.
PPI analysis with seeds in the mPFC and right AC revealed activity in the bilateral NAcc (Figure 8). The same analysis revealed PPI effects in the following bilateral regions: the superior frontal gyrus, precentral gyrus, postcentral gyrus, middle occipital gyrus, lingual gyrus, inferior occipital gyrus, fusiform gyrus, inferior frontal gyrus, middle frontal gyrus, insula, Heschl’s gyrus, superior temporal gyrus, and cerebellum. In addition, I also observed activity in the right anterior cingulate gyrus, right mPFC, left middle temporal gyrus, left superior occipital gyrus, and left
hippocampus (Table 5). I also observed a significant correlation between the interaction term of subjective pleasure and PPI effect at the top peak coordinate of the left NAcc (x
= -6, y = 10, z = -14, r = 0.28, n = 38, p < 0.05 one-tailed). I observed highly similar results when the mPFC and the left AC were used as seed regions (Table 6). Does the PPI result depend on the location of peak coordinates in the AC?
In contrast to the mPFC and the main effect of Speaker, the main effect of Listener’s Response yielded a wide spread of activation in the superior temporal gyrus. In order to confirm that our PPI results did not depend on the choice of ROIs within the AC, I conducted the same PPI analysis using the second peaks of activation in the AC of each hemisphere (in the superior temporal gyrus [x = 56, y = -24, z = 10] for the right hemisphere; in the Heschl’s gyrus [x = -52, y = -20, z = 6] for the left hemisphere) as seed regions. This analysis confirmed the PPI effect in regions including the NAcc (supplementary Table 7 and 8).
Is the PPI effect in the ventral striatum observed with other sensory cortices as seed areas?
In order to further validate the result of the PPI analysis, I conducted a supplementary analysis wherein the visual cortex, instead of the AC, was used as the seed region. I expected that the PPI effect in the VS would not be observed, as this sensory region would play non-essential roles in processing of listener’s response. The seed region was defined based on the top peak of activation in the visual cortex that was depicted as the effect of listener’s response (x = -4, y = -96, z = 8, Table 2). This
analysis revealed PPI effects in the following bilateral regions: the mPFC, anterior cingulate gyrus, superior, middle, and inferior occipital gyrus, middle and inferior frontal gyrus, precentral gyrus, insula, fusiform gyrus, and cerebellum. In addition, I also observed activity in the right middle temporal gyrus, left postcentral gyrus, and left putamen. However, no significant effects were observed for the VS (Table 9).
5. Discussion
5.1 Behavioral performance
Subjective pleasure was greater for group and single laughter in the SELF condition than in the other (PC) condition. By contrast, the absence of the listener’s response in the SELF condition decreased subjective pleasure relative to the PC condition. This result indicates that action-outcome contingency increases subjective pleasure, consistent with previous findings that action-outcome contingency increases positive response to social interactions (e.g., degree of laughter) and extends the duration of social interaction (Gratch et al., 2006; Soussignan et al., 2006).
5.2 Functional implication of the mPFC
As compared to self-irrelevant responses (i.e., response followed by another’s utterance of the punchline), listening to self-relevant responses activated the mPFC that corresponds to Brodmann Area 10. This finding indicates that the mPFC plays a critical role in monitoring the outcome of self-action, consistent with the hypothesis that the mPFC is involved in the non-physical and abstract representation of the self in the context of social interaction (Uddin et al., 2007; Sugiura, 2013). To parsimoniously explain the involvement of the mPFC in a broad range of social tasks (Van Overwalle, 2009), Krueger et al. (2009) proposed that the mPFC represents event simulators (elators) that encompass a multi-modal representation of social event knowledge
distributed throughout brain regions. Elators provide the underlying properties for social cognitive structures that are involved in planning and monitoring one’s own behavior and understanding and predicting the behavior of others.
Previous studies have suggested the existence of a functional gradient along an
axis from self to other within the mPFC (Mitchell et al., 2006; Denny et al., 2012; Sul et al., 2015; Wittmann et al., 2016), as well as an axis from executed to modeled choices (Nicolle et al., 2012). Our self-relevant activation appears to be extended in both
directions in each functional gradient. The self-related processing is highly related to the processing of the other in social interactions (Cooley, 1902; Mead, 1934). In the present study, compared with the response to other’s utterance participants may have paid more attention to the listener’s responses to their actions in order to infer the mental state of the listener. Such processing of self-relevant responses from others is related to activation of the mPFC. This speculation is consistent with the framework that the mPFC is a part of the network involved in the awareness that the attention or
intentionality of another person is directed at the self (“interpersonal self”, Sugiura et al., 2013).
5.3 Laughter-related activation in the AC
As compared to the absence of the listener’s response (no laughter), the group laughter response elicited activation in the AC. I observed no significant difference between group and single laughter. A previous neuroimaging study reported that part of the superior temporal gyrus is selectively responsive to vocal sounds (Belin et al., 2000). Moreover, Heschl’s gyrus and the superior temporal gyrus are more sensitive to both perceived speech and laughter compared to artificial, non-voice sounds (Meyer et al., 2005). Accordingly, activation of the AC in the present study may represent sound processing at both low (i.e., presence of sound) and high levels (i.e., recognition of auditory signals associated with other’s responses).
5.4 Action-outcome contingency effects in the striatum
Action-outcome contingency effects were observed in the VS. As these effects were revealed as interactions between the self-relevance and the listener’s response, effects that are common in all conditions (e.g., pleasure rating) should be canceled out. This finding is consistent with those of previous studies that have highlighted the functional role of the VS in social action-outcome contingency (Pfeiffer et al., 2014; Schilbach et al., 2010). I observed no significant activation in more dorsal parts of the fronto-striatal circuits that were shown to be associated with action-outcome
contingency learning (Delgado et al., 2005; Seger and Cincotta, 2006). This may be due to the nature of our task, as the jokes were presented once and the listener’s responses were pseudo-randomized (Seger and Cincotta, 2006).
5.5 Physio-physiological interaction in the ventral striatum
In the PPI analysis, I found that activity in the VS showed reflects an
interaction of signals extracted from two regions: the mPFC, in which an effect of self- relevance was observed, and the AC, in which an effect of laughter was observed. This result indicates that the functional connectivity of the VS with a region that reflects one of two effects (self action and listener’s response) is modulated by the other (Figure 9). As this PPI effect was positively correlated with self-rated pleasure, the modulation of functional connectivity may be associated with representation of reward value.
Given that the PPI analysis does not allow one to formulate conclusions about clear-cut directionality (Staudinger et al., 2011), two possibilities may be considered. First, it is possible that the AC modulates functional connectivity between the mPFC and VS, as this functional connectivity is related to the level of self esteem (Chavez and
Heatherton, 2015). However, self esteem was unlikely to change rapidly in our
experiment. Rather, our result supports the hypothesis that the input of signals in the AC evoked by laughter to value processing in the VS is modulated by the signal from the mPFC. A previous fMRI study on the reward value of music showed that the VS and functional connectivity with the AC were correlated with the desirability of music after listening to an excerpt (Salimpoor et al., 2013). The authors concluded that interaction between the sensory cortices and reward circuitry plays a critical role in representing music-related rewards. FitzGerald et al. (2014) reported that selective attention
modulates inputs to value processing. The authors manipulated selective attention via a task in which participants had to choose whether to accept or reject an offer indicated by visual and auditory stimuli. By manipulating which stimulus determined the value of the offer (relevance), the authors revealed that choice activity in the VS solely reflects the value of the currently relevant stimulus, indicating that selective attention modulates the impact of sensory stimuli on value processing in the VS. The present study revealed a similar gating effect of the VS, with three features distinct from those of FitzGerald et al. (2014): First, the preceding action (by self or others) gates the outcome input to value processing; second, outcome-related activity in the “self” region (mPFC) drives the gating; and, third, the signal transfer between the sensory cortices (i.e., the AC) and the VS is represented as the change in functional connectivity between the two regions. These features are consistent with frameworks proposed by Krueger (2009) and by Sui and Humphreys (2015), highlighting the importance of self-reference in action-outcome contingency effect.
The PPI effect in the present study can be interpreted to indicate that the mPFC sends a source signal to the VS to change the gain of the neural response to inputs from
the AC (Stephan et al., 2008). This gain-control mechanism may change the patterns of interactions between the VS and AC as well as activity in the VS itself. Given that activity in the VS and its connectivity with the mPFC and AC were correlated with subjective pleasure, the modulatory effect of the mPFC on the auditory cortico-striatal network may explain pleasant experiences through social action-outcome contingency.
I also observed the PPI effect in the ventral mPFC, though no significant action-outcome contingency effects were observed for this region. Lim et al (2013) revealed that the ventral mPFC is not only active, but also functionally connected to sensory areas that are involved in processing distinct attributes of objects during a valuation task. This difference could be observed because the present study examined the integration of sensory signals with signals related to self-actions, rather than multiple attributes of objects, in value processing.
5.6 Future directions
There are two limitations of note with regard to the present study. First, I designed our task such that the strength of the action-outcome contingency was pseudo-randomized. Future studies should confirm a link between the contingency effect and its learning effect. Second, as the striatum is involved in non-social action-outcome contingency, social and non-social contingency effects should be compared in future studies. Despite these shortcomings, however, our findings may contribute to the understanding of neurodevelopmental disorders. For instance, individuals with autism spectrum disorders (ASD) exhibit impairments in social action-outcome contingency (Gergely, 2001; Nadel et al., 2002). Previous studies have provided only indirect evidence that the brain
network underlying this contingency is atypical (Lombardo et al., 2010; Abrams et al.,
2013). Thus, in the future, it will be worth investigating how ASD affects the brain network underlying the social action-outcome contingency in order to explain the pathological origin of such disorders and develop effective early interventions.
6. Conclusion
In the present study, I observed interaction effects with regard to signals extracted from the mPFC and auditory cortex in the VS using a social action-outcome contingency task. These results indicate that social contingency involves the interaction of multiple brain regions beyond the striatal reward system. As the connectivity of the VS was associated with subjective pleasure, this distributed network may be responsible for the rewarding nature of social action-outcome contingency.
7. Acknowledgments
First and foremost, I offer my deepest gratitude to Dr. Norihiro Sadato whose experience and generous support were invaluable for this thesis. I also would like to express my deepest gratitude for Dr. Ryo Kitada, Dr. Takanori Koike, and Dr. Shuntaro Okazaki whose comments and encouragement were enormous held to me in conceiving and shaping this thesis. I also gratefully acknowledge the contribution of Dr. Takanori Kochiyama for his valuable advice on analyses and Dr. Junichi Chikazoe on an earlier version of the manuscript. Special thanks also go to my colleagues in Department of system neuroscience at NIPS for their assistance and gently support.
Finally, I would like to express a deep sense gratitude to may parent for supporting me emotionally and financially over the years. Thanks to them, I have enjoyed so many challenges and opportunities.
8. References
Abrams DA, Lynch CJ, Cheng KM, Phillips J, Supekar K, Ryali S, Uddin LQ, Menon V (2013) Underconnectivity between voice-selective cortex and reward circuitry in children with autism. Proc Natl Acad Sci U S A 110:12060–12065.
Belin P, Zatorre RJ, Lafaille P, Ahad P, Pike B (2000) Voice-selective areas in human auditory cortex. Nature 403:309–312.
Büchel C, Wise RJ, Mummery CJ, Poline JB, Friston KJ (1996) Nonlinear regression in parametric activation studies. Neuroimage 4:60–66.
Chavez RS, Heatherton TF (2015) Multimodal frontostriatal connectivity underlies individual differences in self-esteem. Soc Cogn Affect Neurosci. 10(3):364-370.
Cooley CH (1902) The social self – 1. The meaning of “I”. In: Human nature and the social order, pp 168-210. New York: Charles Scribner’s Sons.
Csibra G, Gergely G (2006) Social learning and social cognition : The case for
pedagogy. Processes of change in brain and cognitive development. Attention and performance XXI, 21, 249-274.
Delgado MR, Miller MM, Inati S, Phelps EA (2005) An fMRI study of reward-related probability learning. Neuroimage 24:862–873.
Denny BT, Kober H, Wager TD, Ochsner KN (2012) A meta-analysis of functional neuroimaging studies of self- and other judgments reveals a spatial gradient for mentalizing in medial prefrontal cortex. J Cogn Neurosci 24:1742–1752.
Desikan RS, Ségonne F, Fischl B, Quinn BT, Dickerson BC, Blacker D, Buckner RL, Dale AM, Maguire RP, Hyman BT, Albert MS, Killiany RJ (2006) An automated labeling system for subdividing the human cerebral cortex on MRI scans into gyral based regions of interest. Neuroimage 31:968–980.
Dobkin BH, Plummer-D'Amato P, Elashoff R, Lee J; SIRROWS Group (2010) International randomized clinical trial, stroke inpatient rehabilitation with reinforcement of walking speed (SIRROWS), improves outcomes. Neurorehabil Neural Repair. 24(3):235-242.
Evans AC, Collins DL, Mills SR, Brown ED, Kelly RL, Peters TM (1993) 3D statistical neuroanatomical models from 305 MRI volumes. 1993 IEEE Conf Rec Nucl Sci Symp Med Imaging Conf:1813–1817.
FitzGerald TH, Schwartenbeck P, Dolan RJ (2014) Reward-related activity in ventral striatum is action contingent and modulated by behavioral relevance. J. Neurosci. 34:1271–1279.
Friston KJ, Jezzard P, Turner R (1994) Analysis of functional MRI time-series. Hum Brain Mapp 1:153–171.
Friston KJ, Ashburner J, Frith CD, Poline J-B, Heather JD, Frackowiak RSJ (1995) Spatial registration and normalization of images. Hum Brain Mapp 3:165–189. Friston KJ, Holmes A, Poline JB, Price CJ, Frith CD (1996) Detecting activations in
PET and fMRI: levels of inference and power. Neuroimage 4:223–235. Friston KJ, Buechel C, Fink GR, Morris J, Rolls E, Dolan RJ (1997)
Psychophysiological and modulatory interactions in neuroimaging. Neuroimage 6:218–229.
Friston KJ, Glaser DE, Henson S, Kiebel C, Phillips C, Ashburner J (2002) Classical and Bayesian inference in neuroimaging: applications. Neuroimage 16:484–512. Friston KJ, Ashburner J, Kiebel SJ, Nichols TE, Penny WD (2007) Statistical
parametric mapping: the analysis of functional brain images. London: Academics. Gergely G (2001) The obscure object of desire: “Nearly, but clearly not, like me”:
Contingency preference in normal children versus children with autism. Bull Menninger Clin 65:411–426.
Gitelman DR, Penny WD, Ashburner J, Friston KJ (2003) Modeling regional and psychophysiologic interactions in fMRI: The importance of hemodynamic deconvolution. Neuroimage 19:200–207.
Goldstein MH, King AP, West MJ (2003) Social interaction shapes babbling: testing parallels between birdsong and speech. Proc Natl Acad Sci U S A 100:8030–8035. Gratch J, Okhmatovskaia A, Lamothe F, Marsella S, Morales M, van der Werf RJ,
Morency L-P (2006) Virtual rapport. Intell Virtual Agents Sixth Int Conf IVA 2006:14–27.
Hare TA, O’Doherty J, Camerer CF, Schultz W, Rangel A (2008) Dissociating the role of the orbitofrontal cortex and the striatum in the computation of goal values and prediction errors. J Neurosci. 28(22):5623-5630.
Holmes AP, Friston KJ (1998) Generalisability, random effects and population inference. Neuroimage 7:S754.
Izuma K, Saito DN, Sadato N (2008) Processing of social and monetary rewards in the human striatum. Neuron 58:284–294.
Jones EE, Gerard H (1967) Dyadic Interaction: a Conceptual Framework. In:
Foundations of social psychology, pp 505-536. New York: John Wiley & Sons. Kampe KK, Frith CD, Frith U (2003) "Hey John": signals conveying communicative
intention toward the self activate brain regions associated with "mentalizing," regardless of modality. J Neurosci 23(12):5258-5263.
Krueger F, Barbey AK, Grafman J (2009) The medial prefrontal cortex mediates social event knowledge. Trends Cogn Sci 13:103-109.
Kuhl PK, Tsao F-M, Liu H-M (2003) Foreign-language experience in infancy: effects of short-term exposure and social interaction on phonetic learning. Proc Natl Acad Sci U S A 100:9096–9101.
Lancaster JL, Woldorff MG, Parsons LM, Liotti M, Freitas CS, Rainey L, Kochunov PV, Nickerson D,
Mikiten SA, Fox PT (2000) Automated Talairach atlas labels for functional brain mapping. Hum Brain Mapp 10(3):120-131.
Legerstee M, Varghese J (2001) The role of maternal affect mirroring on social expectancies in three-month-old infants. Child Dev 72:1301–1313.
Li J, Daw ND (2011) Signals in human striatum are appropriate for policy update rather than value prediction. J Neurosci 31:5504–5511.
Lim S-L, O’Doherty JP, Rangel A (2013) Stimulus value signals in ventromedial PFC reflect the integration of attribute value signals computed in fusiform gyrus and posterior temporal gyrus. J Neurosci 33(20):8729-8741.
Lombardo M V., Chakrabarti B, Bullmore ET, Sadek S a., Pasco G, Wheelwright SJ, Suckling J, Baron-Cohen S (2010) Atypical neural self-representation in autism. Brain 133:611–624.
Mai JK, Paxinos G, Voss T (2007) Atlas of the Human Brain, Third Edition. Massachusetts: Academic Press.
Matarazzo JD, Saslow G, Wiens AN, Weitman M, Allen BV (1964) Interviewer head nodding and interviewee speech durations. Psychotherapy (Chic) 1:54-63.
Marques JP, Kober T, Krueger G, van der Zwaag W, Van de Moortele P-F, Gruetter R (2010) MP2RAGE, a self bias-field corrected sequence for improved segmentation and T1-mapping at high field. Neuroimage 49:1271–1281.
Mead GH (1934) Mind, self and society from the standpoint of a social behaviorist. Chicago: University of Chicago Press.
Meltzoff AN, Kuhl PK, Movellan J, Sejnowski TJ (2009) Foundations for a New Science of Learning. Science 325:284–288.
Meyer M, Zysset S, von Cramon DY, Alter K (2005) Distinct fMRI responses to laughter, speech, and sounds along the human peri-sylvian cortex. Brain Res Cogn Brain Res 24:291–306.
Mitchell JP, Macrae CN, Banaji MR (2006) Dissociable Medial Prefrontal
Contributions to Judgments of Similar and Dissimilar Others. Neuron 50:655–663. Moeller S, Yacoub E, Olman CA, Auerbach E, Strupp J, Harel N, Uğurbil K (2010)
Multiband multislice GE-EPI at 7 tesla, with 16-fold acceleration using partial
parallel imaging with application to high spatial and temporal whole-brain fMRI. Magn Reson Med 63:1144–1153.
Nadel J (2002) Imitation and imitation recognition: functional use in preverbal infants and nonverbal children with autism. In: The Imitative Mind: Development Evolution and Brain Basis, pp 42-62. Cambridge: Cambridge University Press. Nicolle A, Klein-Flügge MC, Hunt LT, Vlaev I, Dolan RJ, Behrens TE (2012) An agent
independent axis for executed and modeled choice in medial prefrontal cortex. Neuron 75(6):1114-1121.
Northoff G, Heinzel A, de Greck M, Bermpohl F, Dobrowolny H, Panksepp J (2006) Self-referential processing in our brain--a meta-analysis of imaging studies on the self. Neuroimage 31:440–457
O’Doherty J, Dayan P, Schultz J, Deichmann R, Friston K, Dolan RJ (2004) Dissociable roles of ventral and dorsal striatum in instrumental conditioning. Science 304:452-454.
Oldfield RC (1971) The assessment and analysis of handedness: the Edinburgh inventory. Neuropsychologia. 9:97–113.
Pfeiffer UJ, Schilbach L, Timmermans B, Kuzmanovic B, Georgescu AL, Bente G, Vogeley K, Strasse K, Strasse L (2014) Why we interact: On the functional role of the striatum in the subjective experience of social interaction. Neuroimage
101:124–137.
Sacchet MD, Knutson B (2012) Spatial smoothing systematically biases the localization of reward-related brain activity. Neuroimage 66C:270–277.
Salimpoor VN, van den Bosch I, Kovacevic N, McIntosh AR, Dagher A, Zatorre RJ (2013) Interactions between the nucleus accumbens and auditory cortices predict music reward value. Science 340: 216–219.
Seger CA, Cincotta CM (2005) The roles of the caudate nucleus in human classification learning. J Neurosci 25(11):2941-2951.
Schilbach L, Wilms M, Eickhoff SB, Romanzetti S, Tepest R, Bente G, Shah NJ, Fink GR, Vogeley K (2010) Minds made for sharing: initiating joint attention recruits reward-related neurocircuitry. J Cogn Neurosci. 22:2702–2715.
Shattuck DW, Mirza M, Adisetiyo V, Hojatkashani C, Salamon G, Narr KL, Poldrack RA, Bilder RM, Toga AW (2008) Construction of a 3D probabilistic atlas of human cortical structures. Neuroimage 39:1064–1080.
Soussignan R, Nadel J, Canet P, Gerardin P (2006) Sensitivity to Social Contingency and Positive Emotion in 2-Month-Olds. Infancy 10:123–144.
Staudinger MR, Erk S, Walter H (2011) dorsal prefrontal cortex modulates striatal reward encoding during reappraisal of reward anticipation. Cereb Cortex 21(11): 2578-2588.
Stephan KE, Kasper L, Harrison LM, Daunizeau J, den Ouden HE, Breakspear M, Friston KJ (2008) Nonlinear dynamic causal models for fMRI. Neuroimage 42:649–662.
Sugawara SK, Tanaka S, Okazaki S, Watanabe K, Sadato N (2012) Social rewards enhance offline improvements in motor skill. PLoS One 2012;7(11):e48174.
Sugiura M (2013) Associative Account of Self-Cognition: Extended Forward Model and Multi-Layer Structure. Front Hum Neurosci 7:535.
Sui J, Humphreys GW (2015) The Integrative Self: How Self-Reference Integrates Perception and Memory. Trends Cogn Sci 19:719–728.
Sul S, Tobler PN, Hein G, Leiberg S, Jung D, Fehr E, Kim H (2015) Spatial gradient in value representation along the medial prefrontal cortex reflects individual
differences in prosociality. Proc Natl Acad Sci 112:7851-7856.
Tanaka SC, Balleine BW, O'Doherty JP (2008) Calculating consequences: brain systems that encode the causal effects of actions. J Neurosci 28(26):6750-6755.
Tricomi EM, Delgado MR, Fiez JA (2004) Modulation of caudate activity by action contingency. Neuron 41:281–292.
Uddin LQ, Iacoboni M, Lange C, Keenan JP (2007) The self and social cognition: the role of cortical midline structures and mirror neurons. Trends Cogn Sci 11:153– 157.
van de Pol J, Volman M, Beishuizen J (2010) Scaffolding in teacher-student interaction: A decade of research. Educ Psychol Rev 22:271–296.
Van Overwalle F (2009) Social cognition and the brain: A meta-analysis. Hum Brain Mapp 30:829–858.
Wittmann MK, Kolling N, Faber NS, Scholl J, Nelissen N, Rushworth MFS (2016) Self-other mergence in the front cortex during cooperation and competition. Neuron 91:482-493.
Worsley K, Friston KJ (1995) Analysis of fMRI time-series revisited. Neuroimage. 2:45–53.
Zink CF, Pagnoni G, Martin-Skurski ME, Chappelow JC, Berns GS (2004) Human striatal responses to monetary reward depend on saliency. Neuron 42:509–517.
9. Figures
Figure 1. First selection of jokes
I initially prepared 528 jokes from a Japanese TV show program. (A) We then
conducted two rating tests with a 7-point Likert scale. In the first rating test, I selected the 176 jokes (green square) with the highest ratings by 11 volunteers. (B) After the first selection, I selected the 120 funniest jokes (blue square) among these 176 jokes rated by another 33 volunteers.
Figure 2. Sequence of events in the pseudo-interactive joke task
Each trial consisted of five phases: preparation, speaker’s action, listener’s response, rating, and rest. In the preparation phase, the participant observed and listened to the setup of a joke. Two conditions were prepared in the action phase: When the frame of the screen turned red, the participant uttered the punchline of the joke (SELF condition), whereas when the frame of the screen turned blue, the participant listened to the
punchline, which was read aloud by the PC (PC condition). Each punchline was new and presented only once. In the response phase, the participant heard one of three responses from the listener: laughter of people (Group laughter), laughter of a single individual (Single laughter), or silence (No laughter). The participant then rated his or
her pleasantness by pressing buttons in the rating phase. Activities during the task were modeled with boxcar functions for each phase except the rest condition. The regressors shown were convolved with the canonical hemodynamic response function. I focused our analysis on the listener’s response phase (yellow frame).
Figure 3. Rating of subjective pleasure
The ratings of subjective pleasure showed greater differences between different degrees of laughter in the SELF than the PC condition. Two-way analysis of variance (ANOVA; Speaker × Listener’s response) revealed a significant interaction (p < 0.0001). Post hoc pairwise comparisons with Bonferroni’s correction revealed that the rating in the Group (p < 0.0001) and Single laughter (p = 0.0001) conditions was greater for the SELF than PC condition, whereas the rating for the PC was greater than that for the SELF in the No (No laughter) condition (p < 0.0001). Data are presented as the mean ± standard error of the mean (SEM) of 38 participants.
Figure 4. The effect of self action (SELF minus PC)
The contrast for the main effect of Speaker [(SELF_No + SELF_Single + SELF_Group) - (PC_No + PC_Single + PC_Group)] revealed significant activation in the medial prefrontal cortex (mPFC) only. The size of the activation was thresholded at p < 0.05 and familywise-error (FWE) corrected for multiple comparisons over the whole brain, with the height threshold set at p < 0.001 (uncorrected). Activation is superimposed on a surface-rendered T1-weighted magnetic resonance image of an individual who did not participate in the study.
Figure 5. The effect of listener’s response (Group minus No Laughter)
The contrast for the main effect of Listener’s Response [(SELF_Group + PC_Group) – (SELF_No + PC_No)] revealed bilateral activation in the auditory cortices, including the superior temporal gyrus and Heschl’s gyrus. The size of the activation was
thresholded at p < 0.05 and (family-wise error) FWE corrected for multiple comparisons over the whole brain, with the height threshold set at p < 0.001 uncorrected.
Figure 6. The effect of action-outcome contingency
(A) The contrast for the interaction effect [(SELF_Group – SELF_No) - (PC_Group – PC_No)] revealed significant activation in the ventral striatum (VS) only. The size of the activation was thresholded at p < 0.05 and family-wise error (FWE) corrected for multiple comparisons over the whole brain, with the height threshold set at p < 0.001 uncorrected. (B) Activation pattern in the top peak coordinate of the right VS (see Table 3 for details of coordinates). Data are presented as the mean ± standard error of the mean (SEM) of 38 subjects.
Figure 7. Region of interest (ROI) analysis.
In order to validate the action-outcome contingency effect in the ventral striatum (VS), I conducted independent ROI analysis. Green-colored areas on the surface-rendered MRI represent ROIs that are defined by the gambling task. The No laughter condition was set as the baseline in the SELF and PC conditions. I confirmed that the SELF_Group
condition revealed greater activation than the SELF_No condition in both hemispheres (p = 0.0005 for the right VS and p < 0.0001 for the left VS in one-sample t-tests). Two- way repeated-measures ANOVA [two levels of speaker (SELF or PC) × two levels of listener’ response (group laughter or single laughter)] revealed a significant interaction effect (right VS, p = 0.008; left VS, p = 0.009). Post hoc pairwise comparisons with Bonferroni’s correction confirmed that activation was significantly higher in Group laughter than Single laughter in the SELF condition (right VS, p = 0.001; left VS, p = 0.002) but not in the PC condition. Error bars represent the standard error of the mean (SEM).
Figure 8. Physio-physiological interaction (PPI) in the ventral striatum (VS) Left, PPI activation with the medial prefrontal cortex (mPFC) and right auditory cortex as seed regions is shown. PPI activation overlapped with the interaction effect between Speaker and Listener’s response (white lines, Figure 5). The size of activation was thresholded at P < 0.05 and family-wise error (FWE) corrected for multiple comparisons over the whole brain, with the height threshold set at p < 0.001
uncorrected. Note that I also confirmed PPI activation in the VS even when the left auditory cortex was used as a seed region (see Table 6). Right, Coronal section of the VS and its adjacent structure. PPI activity at the top peak coordinate was significantly correlated with the interaction term of the rating of pleasure [(SELF_Group –
SELF_NO) - (PC_Group – PC_No)] (r = 0.28, p < 0.042 one-tailed).
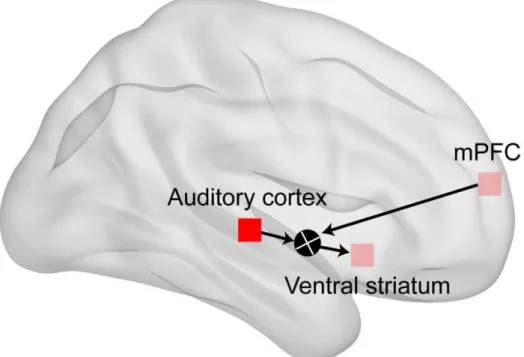
Figure 9. Proposed model of the brain network underlying the social action- outcome contingency
The top-down signal from the medial prefrontal cortex (mPFC) may modulate functional connectivity of the auditory cortex and ventral striatum (VS). This
modulation may result in an interaction effect in the VS between sensory feedback from the other and signals associated with monitoring the outcome of self-action. Such
interaction may underlie the subjective pleasure of social action-outcome contingency.
10. Tables
Table 1. The effect of self action (SELF minus PC)
Spatial extent test MNI coordinates (mm) t-value Location
Cluster size (mm3) PFWE-corr x y z Side Area
SELF minus PC [(SELF_No + SELF_Single + SELF_ Group) - (PC_No + PC_Single + PC_ Group)] (Figure 3)
1200 < 0.01 4 58 16 4.03 R mPFC
Activation was thresholded at p < 0.05 and familywise-error (FWE) corrected for multiple comparisons over the whole brain, with the height threshold set at p < 0.001 uncorrected. The terms x, y, and z represent the stereotaxic coordinates (mm). R, right hemisphere; mPFC, medial prefrontal cortex; MNI, Montreal Neurological Institute.