2000. The American Astronomical Society. All rights reserved. Printed in U.S.A. (
FORMATION OF SUBGALACTIC CLOUDS UNDER ULTRAVIOLET BACKGROUND RADIATION TETSU KITAYAMA1,2 AND SATORU IKEUCHI3
Received 1999 April 29 ; accepted 1999 September 22
ABSTRACT
The e†ects of the ultraviolet (UV) background radiation on the formation of subgalactic clouds are studied by means of one-dimensional hydrodynamical simulations. The radiative transfer of the ionizing photons caused by the absorption by H I, He I, and He II, neglecting the emission, is explicitly taken into account. We Ðnd that the complete suppression of collapse occurs for the clouds with circular velocities typically in the range V km s~1 and the 50% reduction in the cooled gas mass with
cD 15È40 VcD 20È55
km s~1. These values depend most sensitively on the collapse epoch of the cloud, the shape of the UV spectrum, and the evolution of the UV intensity. Compared with the optically thin case, previously investigated by Thoul & Weinberg in 1996, the absorption of the external UV photons by the intervening medium systematically lowers the above threshold values by *V km s~1. Whether the gas can con-
cD 5
tract or keeps expanding is roughly determined by the balance between the gravitational force and the thermal pressure gradient when it is maximally exposed to the external UV Ñux. Based on our simula- tion results, we discuss a number of implications on galaxy formation, cosmic star formation history, and the observations of quasar absorption lines. In the Appendix, we derive analytical formulae for the photoionization coefficients and heating rates, which incorporate the frequency/direction-dependent transfer of external photons.
Subject heading : cosmology : theory È di†use radiation È galaxies : formation È radiative transfer 1. INTRODUCTION
Photoionization of primordial gas is well known to have great impacts on galaxy formation and the thermal history of the universe. The observations of the QSO absorption spectra (Gunn & Peterson 1965) imply that the intergalactic gas has been highly ionized before redshift zD 5. In fact, the existence of an intense ultraviolet (UV) background radi- ation that can photoionize the universe is inferred from the proximity e†ect of the Lya forest at z \ 2D 4 (e.g., Baljtlik, Duncan, & Ostriker 1988 ; Bechtold 1994 ; Giallongo et al. 1996). The origin of the UV background radiation could be attributed to the emission from QSOs and/or young gal- axies formed at high redshifts (e.g., Couchman 1985 ;
& Ostriker 1990 ; Fukugita & Kawasaki Miralda-Escude
1994).
The UV background radiation, once produced, largely a†ects the subsequent formation of structures. In particular, the formation of low-mass objects is suppressed via photo- ionization and heating associated with it (Umemura & Ikeuchi 1985 ; Ikeuchi 1986 ; Rees 1986 ; Couchman & Rees 1986 ; Ikeuchi, Murakami, & Rees 1988, 1989 ; Efstathiou 1992 ; Babul & Rees 1992 ; Chiba & Nath 1994 ; Babul & Ferguson 1996 ; Okoshi & Ikeuchi 1996 ; Haiman, Rees, & Loeb 1997 ; Kepner, Babul, & Spergel 1997, among others). Such suppression may partly resolve some of the short- comings of the hierarchical models of structure formation, such as an excess number of faint galaxies predicted than actually observed (e.g., White & Frenk 1991 ; Kauff- mann, White, & Guiderdoni 1993 ; Cole et al. 1994). In view of this, several authors have simulated the thermal and dynamical evolution of the intergalactic medium under the UV background (Umemura & Ikeuchi 1984 ; Bond, Szalay,
1 Department of Physics, Tokyo Metropolitan University, Hachioji, Tokyo 192-0397, Japan ; tkita=phys.metro-u.ac.jp.
2 Department of Physics, University of Tokyo, Bunkyo-ku, Tokyo 113- 0033, Japan.
3 Department of Physics, Nagoya University, Chikusa-ku, Nagoya 464- 8602, Japan ; ikeuchi=a.phys.nagoya-u.ac.jp.
& Silk 1988 ; Murakami & Ikeuchi 1990, 1993 ; Cen & Ostriker 1992 ; Zhang, Anninos, & Norman 1995 ; Quinn, Katz, & Efstathiou 1996 ; Thoul & Weinberg 1996 ; Wein- berg, Hernquist, & Katz 1997 ; Navarro & Steinmetz 1997). For instance, Thoul & Weinberg (1996) concluded that the objects with circular velocitiesV km s~1 are prevent-
c[30
ed from collapsing at 2 [ z [ 5. These previous studies, however, were based on the assumption that the medium is optically thin against the ionizing photons. In reality, gas clouds become optically thick in the course of contraction, and it is by no means trivial how much the cloud evolution is altered when the radiative transfer of ionizing photons is incorporated. In addition, only the limited range of collapse redshift has been explored previously. As the mean density of the universe depends strongly on redshift in proportion to (1 ] z)3, the e†ects of the UV background radiation should also vary, with an increasing importance of the radi- ative transfer at higher redshifts. The possible evolution of the UV background intensity may have further impacts on the cloud dynamics at di†erent redshifts.
In this paper, we study the e†ects of the UV background radiation on the dynamical evolution of primordial clouds by means of one-dimensional, spherically symmetric, hydrodynamical simulations, incorporating the radiative transfer of the ionizing photons. We use analytical approx- imations of the photoionization coefficients and heating rates derived in the Appendix, which take explicit account of the frequency/direction-dependent radiative transfer caused by the absorption by H I, He I, and He II. They are simply expressed as a function of column densities of each species from the cloud boundary and are applicable to the medium with an arbitrary density proÐle. By using these analytical formulae, we have achieved a signiÐcant reduction of the computational time and are thus able to explore broad ranges in cloud-mass scale, collapse redshift, and parameters of the external UV Ðeld. The results are compared quantitatively with those of optically thin calcu- lations. Based on the results of numerical simulations, we 615
further predict the global production rate of cooled gas in the standard Cold Dark Matter (CDM) universe and discuss its implications on galaxy formation and cosmic star formation history. We also discuss the imprints of the UV background on the quasar absorption lines, such as the observability of the helium Lya forests, which can be tested by future observations.
This paper is organized as follows. Section 2 describes the numerical model used in this paper. Section 3 presents the results of our simulation, and ° 4 is devoted to the dis- cussion. Finally, ° 5 summarizes our conclusions. Wherever necessary, the following cosmological parameters are assumed for deÐniteness ; the density parameter)0\ 1,the Hubble constant h \ H0/(100 km s~1 Mpc~1) \ 0.5, the baryon density parameter ) and the amplitude of
b\ 0.1,
the density Ñuctuationsp8\ 0.6.The value ofp8is chosen to match the observed local abundance of galaxy clusters (e.g., Viana & Liddle 1996 ; Eke, Cole, & Frenk 1996 ; Kitay- ama & Suto 1997).
2. METHOD 2.1. Basic Equations
We simulate the dynamics of a spherically symmetric bound system exposed to the di†use UV background radi- ation. The system is a mixture of baryonic gas and collision- less dark matter, with the mass ratio of )
b:)0[ )b\ 1 : 9. The evolution of these components is described by the following equations :
dmb drb
\ 4nr b2 o
b, (1)
d2rb
dt2 \ [4nrb2 dP dmb
[GM(\rb) rb2
, (2)
du dt\
P ob2
dob dt ]
H[ L ob
, (3)
P \ (c [ 1)o bu \
kB obT
kmp , (4)
and
d2rd dt2 \ [
GM(\r d) rd2
. (5)
Here r, m,o, P, T , u, and k, are the radius, mass, density, pressure, temperature, internal energy per unit mass, and mean molecular weight in units of the proton mass mp, respectively. M(\r) is the total mass interior to r, H and Lare the heating and cooling rates per unit volume, G is the gravitational constant, and kB is the Boltzmann con- stant. Wherever necessary, the subscripts b and d denote baryon and dark matter, respectively. The adiabatic index is Ðxed atc \ 5/3 throughout the paper.
The above equations are solved using the second-order- accurate Lagrangian Ðnite-di†erence scheme described in Bowers & Wilson (1991) and Thoul & Weinberg (1995). The shocks are treated with the artiÐcial viscosity technique (Richtmyer & Morton 1967 ; Umemura 1993). The shells are binned equally in mass and their numbers areN for
b\ 500 baryonic gas andN for dark matter. We have per-
d\ 5000
formed runs with(N 20,000) and (300, 3000) b, Nd) \ (2000,
and conÐrmed that our results are robust against the changes in the resolution. We have also checked that our
code accurately reproduces the similarity solutions for the adiabatic accretion of collisional gas and for the pres- sureless collapse onto a black hole (Bertschinger 1985). The total energy of the system is conserved by better than a few percent in any runs reported in this paper.
2.2. Radiative Processes
The baryonic gas is assumed to have the primordial com- position with hydrogen and helium mass fractions X \ 0.76 and Y \ 0.24, respectively. At each time step, starting from the cloud boundary into the interior, we successively solve for the ionization equilibrium among photoionization, col- lisional ionization, and recombination, together with the penetration of the external UV Ðeld, as described in detail later in this section. We then compute the heating/cooling rates caused by photoionization, collisional ionization/ excitation, recombination, thermal bremsstrahlung, and Compton scattering with the cosmic microwave back- ground radiation. Unless otherwise stated, we use the rates and coefficients summarized in Fukugita & Kawasaki (1994), which corrects a few typographical errors in Cen (1992).
The external UV Ðeld is taken to be isotropic and have the power-law spectrum :
Jin(l,z) \ J21(z)
A
llH I
B
~a
] 10~21 ergs s~1 cm~2 str~1 Hz~1 , (6) whereJ21(z)is the intensity (in proper coordinates) at the Lyman limit of hydrogen(hlH I\ 13.6eV) anda is the spec- tral index. Observations of the proximity e†ect in the Lya forest suggest J21\ 10B0.5 at z \ 1.7È4.1 (Baljtlik et al. 1988 ; Giallongo et al. 1996 ; Cooke, Espey, & Carswell 1997 ; Savaglio et al. 1997), but its value is still highly uncer- tain at other redshifts. Theoretical predictions of the value of J21 needed to reionize the universe at high redshifts range fromJ21 D 0.1to evenD100 (e.g., Fukugita & Kawa- saki 1994 ; Gnedin & Ostriker 1997 ; Haiman & Loeb 1998 ; Madau, Haardt, & Rees 1999). The predicted epoch at which reionization occurs also has a large uncertainty between zD 50 and 6. In this paper, unless otherwise stated explicitly, we Ðx the onset of the UV background at zUV\ 20 and consider the following four cases at z\ zUV :
anda \ 1 ; 1. J21\ 1
anda \ 1 ; 2. J21\ 0.1
anda \ 5 ; 3. J21\ 1
4. evolvingJ21anda \ 1, where
J21\
4
5
6
0 0
A
1 ] z7
B
~6
6 ¹ z ¹ zUV
1 3 ¹ z ¹ 6
A
1 ] z4
B
40 ¹ z ¹ 3 .
(7)
The valuesa \ 1 and 5 are chosen to mimic the spectra of quasars and massive stars, respectively. By the above form of the UV evolution (eq. [7]), we attempt to study the e†ects of a late reionization and a decline of the UV intensity at low redshift.
The incident UV spectrum is modiÐed because of the radiative transfer as it penetrates into the gas cloud. In this paper, we explicitly take into account the frequency/
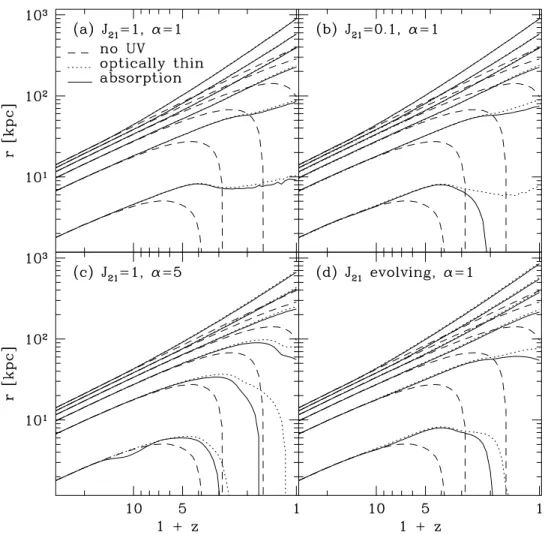
FIG. 1.ÈTrajectories of radii of gas shells enclosing 0.2% (innermost shell), 10%, 30%, 50%, 70%, and 90% ofMboundin the low-redshift collapse(z c\ 0.5) for a cloud withV km s~1 and di†erent parameters of the UV background ; (a) a \ 1, (b) a \ 1, (c)
c\ 32 (Mcloud ^9] 108 M_) J21\ 1, J21\ 0.1, J21\ 1,
a \ 5, and (d) evolvingJ21,a \ 1. Di†erent lines indicate the no UV case (dashed), the optically thin case (dotted), and the case with absorption (solid).
direction-dependent absorption by H I, He I, and He II using equations (A15) and (A16) in the Appendix. Having per- formed the frequency and angular integrations of the trans- fer equation neglecting the emission term, the analytical formulae are obtained for the photoionization coefficients and heating rates in the plane-parallel slab. They are simply expressed as a function of column densities of individual species measured from the boundary and lead to a signiÐ- cant reduction in the computational time. By means of these formulae, we solve simultaneously for the ionization equi- librium in each gas shell and the UV radiation Ðeld pro- cessed between the outer boundary and that shell. The ionization state of the gas and the radiation Ðeld are com- puted iteratively until the abundances of H I, He I, and He II all converge to a precision better than 1%.
Note that the above treatment of the radiative transfer systematically overestimates the e†ect of absorption in the following respects : (1) since the solution of the transfer equation in the plane-parallel geometry is applied to a spherical cloud, the photon path lengths from the outer boundary are overestimated ; (2) at each radial point, ion- izing photons coming from the inner 2n steradian of the cloud are ignored ; and (3) the emission (or scatter) of inci- dent photons is neglected. It should thus provide a conser- vative limit in which an external UV Ðeld is maximally weakened and has the minimal e†ects on cloud evolution. This is in fact complementary to a conventional approx-
imation of the optically thin medium (e.g., Thoul & Wein- berg 1996), in which the external UV Ðeld is likely to have the maximal e†ects on the cloud dynamics. In what follows, therefore, we examine both of these limiting cases and perform quantitative comparisons between them. In so doing, we hope to bracket the true answer, which is still very difficult to solve in a fully self-consistent manner.
The approximation of the ionization equilibrium is correct if the recombination timescaletrecis shorter than the dynamical timescaletdyn 4 1/JGo.Assuming a high degree of ionization, this yields the following condition for the elec- tron density n (e.g., Vedel, Hellsten, & Sommer-Larsen 1994) : e
ne[ 7.1] 10~6T41.4
A
2 1 ] XBA
)0/)b
10
B
cm~3 , (8) whereT4 4 (T /104K), and we have adoptedtrec 4 (aHne)~1 using the recombination rate for hydrogenaHgiven in equa- tion (A27). The above condition is satisÐed in most situ- ations considered in this paper except at the outer envelopes of clouds at low redshifts. For example, in a cloud collaps- ing at z \ 3, typically the outmostD5% of the gas has the density below the above value at z \ 3 (see ° 2.3 for the deÐnition of the collapse epoch). For these shells, the assumption of the ionization equilibrium will result in over- estimating the fractions of neutral species and, hence, in
1 2 3 4 5
-7 -6 -5 -4 -3 -2 -1 0
10 12 14 16 18 20 22
10 5 -5
-4 -3 -2 -1 0
1 + z
10 5 1 + z
10 5 1 + z
10 5 1 + z
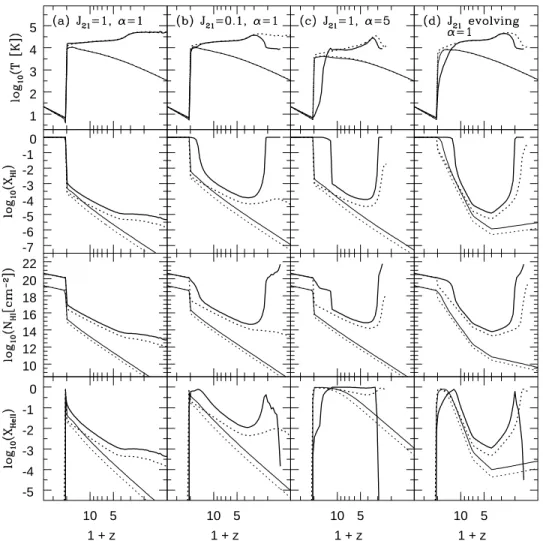
FIG. 2.ÈEvolution of temperature (highest panels),X (second highest panels), (second lowest panels), and (lowest panels) of gas shells enclosing
H I NH I XHe II
0.2% (thick lines) and 90% (thin lines) ofM in the low-redshift collapse for a cloud with km s~1. (a) a \ 1 ; (b) a \ 1 ;
bound (zc\ 0.5) Vc\ 32 J21\ 1, J21\ 0.1,
(c)J21\ 1,a \ 5 ; and (d) evolvingJ21,a \ 1. Di†erent lines indicate the optically thin case (dotted lines) and the case with absorption (solid lines).
overestimating the e†ect of absorption even further. In practice, however, the physical abundances of neutral species in these shells are negligibly small. Thus the approx- imation of the ionization equilibrium is well justiÐed in the present analysis.
2.3. Initial Conditions
We start the simulations when the overdensity of a cloud is still in the linear regime. The initial overdensity proÐle is assumed to have the form of a single, spherical Fourier mode for both baryon and dark matter components :
di(r) \di(0) sin (kr)
kr , (9)
where k is the comoving wavenumber, and d is the i(0) central overdensity. Throughout the paper, we Ðxd
i(0) \ 0.2. Assuming that the initial perturbation is dominated by the growing mode, the initial velocity proÐle is given by
vi(r) \ Hir
A
1 [ d6i(\r)3
B
, (10)whereH is the Hubble parameter at the initial epoch, and is the volume averaged overdensity within radius r.i d6(\r)
The outer boundary is taken at the Ðrst minimum ofd i(r), i.e., kr \ 4.4934, at whichd6(\r) vanishes and the shell ini-
tially expands at the speed H As in Haiman, Thoul, & ir.
Loeb (1996), we deÐne the baryonic mass enclosed within this radius as the bound mass Mbound and that enclosed within the Ðrst zero ofdi(r), i.e., kr \n, as the cloud mass
These masses are related to each other via
Mcloud. Mcloud\
0.342[1 ] 0.304d
i(0)]Mbound\ 0.363Mbound.
Having Ðxed the initial density proÐle, we vary the initial redshiftz and the cloud mass to simulate di†erent
i Mcloud
collapse epochs and mass scales, i.e., circular velocities or virial temperatures. We deÐne the central collapse redshift and the cloud collapse redshift respectively, as the
zc0 zc,
epochs at which the innermost gas shell and the shell enclosingMcloudwould collapse to the center in the absence of thermal pressure. The circular velocityV and the virial temperatureTvirof the cloud are deÐned usingc Mcloudandz as c
Vc\ 15.9
A
Mcloud )0/)b 109 h~1 M
_
B
1@3(1 ] zc)1@2 km s~1 , (11) Tvir\ 9.09] 103
A
k0.59
BA
Mcloud )0/)b 109 h~1 M
_
B
2@3] (1 ] z
c) K . (12)
Unless otherwise stated explicitly, we study three com- binations of z and listed in Table 1. In this table,
i, zc0, zc
TABLE 1
CHARACTERISTIC REDSHIFTS OF SIMULATION RUNS
Simulation z
i zta0 zc0 zta zc
Low-redshift collapse . . . . 40 5.4 3 1.3 0.5 Middle-redshift collapse . . . . 110 16 10 5.4 3 High-redshift collapse . . . . 300 45 28 16 10
we also list the turnaround redshifts corresponding to z
and z and c0
c, zta0 4 22@3(1 ] zc0) [ 1 zta 4 22@3(1 ] zc) [ 1, respectively. In the low-redshift collapse, the gas is exposed to the UV background radiation from the linear regime. In the middle-redshift collapse, the cloud center is close to turnaround at the onset of the UV radiationzUV\ 20. In the high-redshift collapse, the cloud center has already col- lapsed prior to zUV.
At an initial epoch, the gas is assumed to have the uniform temperature given by
Ti\
4
5
6
0 0
2.726(1 ] z
i) if ziº200 548
A
1 ] zi201
B
3(c~1)if zi\ 200 ,
(13)
taking into account that the matter is tightly coupled to the cosmic microwave background atz Z 200(e.g., Anninos & Norman 1994 ; Chieze, Teyssier, & Alimi 1997).
2.4. Boundary Conditions
If the gas is able to lose sufficient energy by radiative cooling, it falls toward the center nearly at the free-fall rate. As the density increases near the center, the cooling time- scaletcool 4uo/o H [ L o and the dynamical timescaletdyn become extremely small, and an inÐnitely large number of time steps are required in the simulation. To avoid this, we introduce the following criteria. If a gas shell reaches below some minimum radius rmin and satisÐes tcool/tdyn \ 0.01, then we regard it as having cooled and collapsed ; we move the shell to the center and ignore it in the rest of the simula- tion, except in the calculation of the gravitational force. When dropping a shell to the center, we assume that the next shell expands inward adiabatically to cover the volume of the dropped shell. The evolution of each shell is traced until both of the above criteria are fulÐlled. We adopt as rmin the radius at which the system attains rotational support (e.g., Padmanabham 1993) :
rmin\ 0.05
A
)b/)0 0.1B
~1
A
j ta 0.05B
2rta , (14)
wherertais the turnaround radius of the gas shell, andjtais the dimensionless spin parameter attained by turnaround. We Ðxjta\ 0.05based on the results of the numerical simu- lations (Efstathiou & Jones 1979 ; Barns & Efstathiou 1987 ; Warren et al. 1992). Equation (14) also gives the scale under
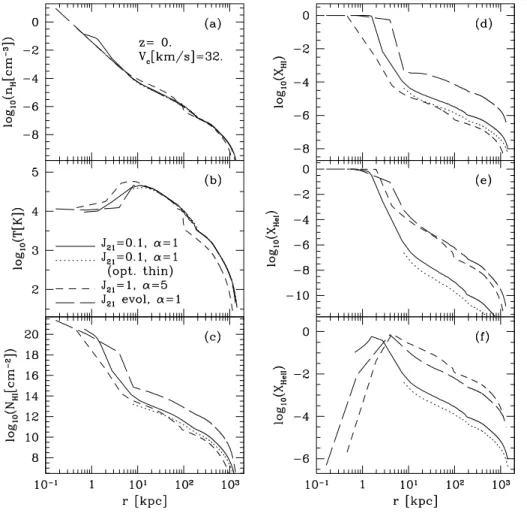
FIG. 3.ÈRadial proÐles at z \ 0 of (a) hydrogen density, (b) temperature, (c) H I column density from the boundary, (d)X (e) and ( f ) in the H I, XHe I, XHe II low-redshift collapse(z for a cloud with km s~1. Lines correspond to di†erent parameters of the UV background as shown in the Ðgure
c\ 0.5) Vc\ 32
(unless indicated explicitly, absorption is taken into account).
FIG. 4.ÈSame as Fig. 1, except for a cloud with (a)V km s~1 c\ 50
and (b) km s~1
(Mcloud ^3] 109 M_), Vc\ 100 (Mcloud ^3] 1010 M_), in the case ofJ21\ 1anda \ 1.
which the assumption of spherical symmetry breaks down. The baryon mass that has collapsed to the center is denoted by Mcoll.
The dynamical timescale also becomes very small when collisionless dark matter shells approach the center. We therefore rebounce the dark matter shells near the center (Spitzer & Hart 1971 ; Gott 1975). As noted by Thoul & Weinberg (1995), it is desirable to choose the rebouncing radiusrrebthat is small enough not to alter the evolution of gas shells, but not too small to degrade energy conserva- tion. To achieve these, we setrrebequal torminof a gas shell that encloses 0.01È0.1Mbounddepending on a run. Through- out each run,rrebis Ðxed at this value.
At the outer boundary, we adopt the free boundary con- dition, i.e., the pressure outside the cloudPoutis zero. We have also performed runs with a mirror boundary condition where is the pressure of the outermost gas (Pout\ P
Nb, PNb
shell) and conÐrmed that our results remain essentially invariant.
3. NUMERICAL RESULTS 3.1. Dynamical Evolution
Figure 1 illustrates the trajectories of gas shell radii in the low-redshift collapse(z for a cloud with km
c\ 0.5) Vc\ 32
s~1(Mcloud ^ 9 ] 108 M_).In the absence of the UV back- ground, the gas shells initially comoving with the Hubble expansion will eventually turn around because of gravity and start to contract. As the virial temperature of the cloud is Tvir ^ 4 ] 104 K, the gas can lose energy efficiently by radiative cooling and collapse toward the center. If the UV background radiation is present, on the other hand, the evolution of the cloud is signiÐcantly altered. Figure 1a shows that the cloud is prohibited from collapsing com- pletely under a constant UV withJ21\ 1anda \ 1. Once, however, the UV amplitude is reduced toJ21\ 0.1and the absorption is taken into account, the inner part of the cloud may start to collapse (Fig. 1b). Alternatively, a softer spec- truma \ 5 enables a larger number of shells to collapse by z \ 0 (Fig. 1c). The cloud collapse is also promoted if the UV background radiation evolves according to equation (7) (Fig. 1d).
In order to study the above mentioned features in more detail, we plot in Figure 2 the evolution of the temperature
T , H I fractionX H I column density
H I4 nH I/(nH I] nH II),
measured from the outer boundaryN and He II fraction H I,
in the runs shown in XHe II4 nHe II/(nHe I] nHe II] nHe III)
Figure 1. For J21\ 1 and a \ 1, temperature rises to T D 104 K, and all the gas is photoionized almost instanta- neously at the onset of the UV backgroundzUV\ 20 (Fig. 2a). At this epoch, the cloud density is still almost equal to the mean of the universe (nH D 2 ] 10~3 cm~3) and the external UV Ðeld can penetrate the cloud center, even if absorption is considered. The thermal pressure of the heated gas takes over the gravity and the cloud keeps expanding.
For a smaller UV amplitude,J21\ 0.1,Figure 2b shows that the cloud evolves very di†erently with/without the absorption. If absorption is considered, the central part of the cloud is not ionized instantaneously but stays neutral until the gas density decreases signiÐcantly because of expansion. It is noticeable that the temperature still rises almost instantaneously to T D 104 K. This is because the timescale for heating is much shorter than that for ioniza- tion (e.g., Gnedin & Ostriker 1997). One can roughly esti- mate the ratio of these timescales in the case ofa \ 1 as
theat tion\
3kBT 2HH I
N
! H I~1\
4 5
6
0
0
0.285T4 optically thin limit , 7.28] 10~2T
4 qH I~1@3 optically thick limit , (15)
whereq is the H I optical depth
H I\ 6.3] 10~18(NH I/cm~2)
at the Lyman limitl and and are photoioniza- H I, !H I HH I
tion coefficient and heating rate derived for the pure hydro- gen gas in Appendix (eqs. [A22], [A23], [A24], and [A25]). AtzUV,the H I column density at the center isN
H ID 1020 cm~2 in Figure 2b, which gives the optical depth ofq
H I\ 630 andtheat/tion\ 8.5] 10~3T4in the above equation. For a softer spectrum, this ratio becomes larger and the heating becomes relatively slower, as is illustrated in Figure 2c. In
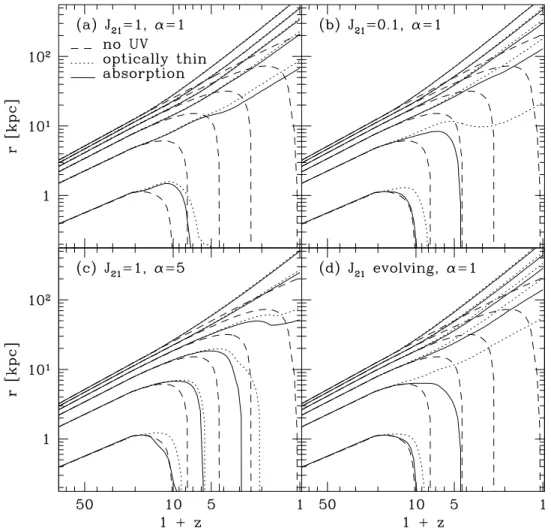
FIG. 5.ÈSame as Fig. 1, except for the middle-redshift collapse(z with km s~1
c\ 3) Vc\ 32 (Mcloud ^2] 108 M_)
this case, the pressure gradient between the cold neutral center of the cloud and the hot ionized envelope causes the gas to push slightly inward near the cloud center at zD 10 (Fig. 1c).
Figure 2b further indicates that as the gravity overcomes the pressure support, the gas shells can turn around and the density starts to rise again. The gas is Ðrst heated by shock and adiabatic compression, but it will start to lose energy and shrink to the center once radiative cooling becomes efficient. Consequently, the neutral core is formed at the center. The absorption of the external UV Ðeld promotes the cloud collapse and the formation of the neutral core by both reducing the number of photoionized ions and lower- ing the heating rate.
The cloud evolution is very sensitive to the spectral index of the UV background. For a softer spectruma \ 5, there are smaller numbers of high-energy photons and, hence, larger numbers of He II than fora \ 1 (Fig. 2c). The larger number of shells are thus able to collapse within a given time fora \ 5.
If the UV background evolves according to equation (7), the gas in the cloud is ionized gradually as in Figure 2d. As the UV intensity drops at z\ 3, the neutral fraction starts to rise again and the inner shells start to collapse to the center.
Figure 3 shows the radial proÐles at z \ 0 in some of the runs discussed above. The shock front (if such exists) is at rD 102 kpc. The density proÐle inside the shock front
agrees well with the self-similar solution oP r~2.25 (Bertschinger 1985). The central part of the cloud is self- shielded against the external UV photons and the gas becomes neutral. In the case of (J21, a)\ (0.1, 1) with absorption, the simulated proÐles ofX and roughly
H I NH I
agree with an analytical estimation for the pure hydrogen gas presented in the Appendix. For instance, inserting into equation (A29) the values read o† from the Ðgure at rD 2 kpc, (nH D 10~2cm~2, T D 104 K, and XH ID 0.1), we
obtainq i.e., cm~2, in good accord-
H ID 2, NH ID 3 ] 1017
ance with Figure 3c. On the other hand, such an estimation breaks down for the softer spectrum (a \ 5) because of the larger abundances of He I and He II.
The e†ects of the UV background radiation become less signiÐcant as the cloud mass increases. Figure 4a shows that the gas collapse is still delayed by the UV radiation for a cloud withV km s~1
c\ 50 (Mcloud ^ 3 ] 109 M_, Tvir ^ 9 ] 104 K). The evolution, however, is altered only slightly for a larger cloud withV km s~1
c\ 100 (Mcloud ^ 3 ] 1010 K). The e†ects of absorption, compared M_, Tvir ^ 4 ] 105
with the optically thin case, also become insigniÐcant at this mass scale as collisional ionization dominates photoionization.
Figures 5 and 6 illustrate the trajectories of gas shells in the middle-redshift collapse(z Since the density of a
c\ 3).
cloud is higher than the low-redshift collapses discussed above, the larger amount of gas is able to collapse for a given circular velocityV km s~1. At the onset of the
c\ 32
1 2 3 4 5
-7 -6 -5 -4 -3 -2 -1 0
10 12 14 16 18 20 22
50 10 5
-5 -4 -3 -2 -1 0
1 + z
50 10 5
1 + z
50 10 5
1 + z
50 10 5
1 + z FIG. 6.ÈSame as Fig. 2, except for the middle-redshift collapse(z with km s~1
c\ 3) Vc\ 32 (Mcloud ^2] 108 M_)
UV backgroundzUV\ 20,the cloud center is about to turn around, and the density is nH D 10~2 cm~3, roughly a factor of 5 larger than the mean density of the universe. At this density, the inner part of the cloud can be kept self- shielded against ionizing photons until it collapses if the absorption is considered (Figs. 6b, 6c, 6d). Even in such cases, the gas is still heated promptly to T D 104 K for a \ 1 because of the high efficiency of the heating process over the ionization mentioned above (eq. [15]).
The e†ects of the UV background radiation are further weakened if one goes to even higher redshifts. Figure 7 shows the gas shell trajectories in the high-redshift collapse At about 10% of have already col-
(zc\ 10). zUV, Mbound
lapsed, and a number of shells either have turned around or are about to turn around. In addition, Compton cooling further promotes the gas collapse at z Z 7.
3.2. Critical Mass Scales for the Collapse
To quantify the results presented in ° 3.1, we plot in Figure 8 the fraction of gas mass that has cooled and col- lapsed to the center after the UV onsetzUV\ 20as a func- tion of circular velocity. The output epochs correspond to
where and is the
t \ 0.5t
c, tc, 2tc, tc\ t0/(1] zc)3@2 t0 present age of the universe. In the low- and middle-redshift collapses(z and 3), there exists a sharp cut-o† in the
c\ 0.5
collapsed fraction and this threshold lies in the range V c\ 20D 50 km s~1, depending on di†erent assumptions on the UV background. In the high-redshift collapse(z on
c\ 10),
the other hand, the threshold is not so distinct and a smaller cloud is able to collapse against the external UV.
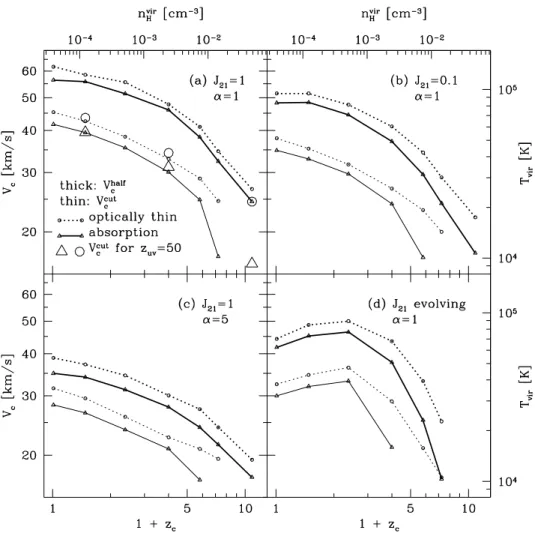
We deÐne the cut-o† velocityV and the half-reduction ccut
velocity V respectively, as the velocities at which the chalf,
mass collapsed between zUV andz is 0.05 and 0.5 of that with no UV. Figure 9 illustrates that these quantitiesc depend most largely on the UV spectral indexa, the evolu- tion of the UV Ñux, and the collapsing redshiftz (we have added to this Ðgure the results for the runs withzc 1.4,
c\ 0, 4.8, and 6.2). Compared with the optically thin cases, the adoption of the radiative transfer systematically lowers V
ccut andV by about 5 km s~1.
chalf
For a constant UV Ñux (Figs. 9a, 9b, 9c), bothV and ccut decrease with increasing because of higher gas
Vchalf zc
density and stronger Compton cooling. At z the cZ7, central part of the cloud begins to collapse prior tozUV,and
falls below 15 km s~1, corresponding to K
Vccut Tvir D 8000
(note thatV and are evaluated from the amount of ccut V
chalf
gas cooled after the UV onset). We simply omit the data points from the Ðgures at such low velocities since it is beyond the scope of our current framework to study these regimes where molecular cooling dominates.
In the presence of the UV evolution (Fig. 9d),V and ccut rise rapidly with time at high redshifts and then begin Vchalf
to drop at low redshifts. However, the peaks of these quan- tities are atz which is much later than the peak of
cD 1.5,
the UV Ñux (z \ 3È6). This is because the kinetic energy of expanding gas particles delays the cloud collapse signiÐ-
FIG. 7.ÈSame as Fig. 1, except for the high-redshift collapse(z with km s~1
c\ 10) Vc\ 32 (Mcloud ^5] 107 M_)
cantly even after the UV Ñux starts to decline. The late infall of gas after the decline of the UV background is therefore suppressed until z
c[1.
So far, we have Ðxed the onset of the UV background at This choice is rather arbitrary given the large zUV\ 20.
uncertainties in the reionization history of the universe. A possibility of much later reionization (smallerzUV)can be covered e†ectively by the UV evolution of the form given in equation (7). To examine an alternative possibility of much earlier reionization, we performed a few runs with zUV\ 50 and added the resultantV to Figure 9a. The di†erences
ccut
from the ÐducialzUV\ 20 runs are signiÐcant only for the high-redshift collapse(z because the gas shells infal-
c\ 10)
ling at z \ 20È50 are mainly a†ected. At such high redshifts, the e†ect of the radiative transfer of UV photons becomes large because the cloud density is very high.
Figure 10 shows the baryon mass Mhalf corresponding to as a function of Also plotted for reference are the
Vchalf zc.
Jeans mass with T \ 104 K and the masses corresponding to 1, 2, and 3p density perturbations in the standard CDM universe with)0\ 1,h \ 0.5,) and The
b\ 0.1, p8\ 0.6. cloud well aboveTvir\ 104K is signiÐcantly a†ected by the UV background radiation. For a constant UV Ñux, Mbhalf rises at a rate faster than(1 ] z which is expected for
c)~3@2,
the Jeans mass with constant temperature. This is because increases with decreasing as shown in Figures 9a,
Vchalf zc
9b, and 9c. For the evolving UV,M keeps growing even bhalf
after the decline of the UV background, and the growth slows down considerably only at z [ 1.
Figure 10 further indicates that the collapse of [2 p density Ñuctuations in the standard CDM universe is highly suppressed at low masses by the UV background radiation. For example, the cooled mass from a 1 p Ñuctuation is reduced to less than 50% atMcloud[109 M and for
_ zcZ2
and at and for
(J21, a)\ (1,1), Mcloud[2] 108 M
_ zcZ3 (see also ° 4.2 for more discussion on the (J21, a)\ (1,5)
implications on structure formation).
4. DISCUSSION
4.1. Comparison with Analytical Estimates
The results of our simulations are compared with analyti- cal estimates on the density-temperature diagrams (e.g., Efstathiou 1992 ; Chiba & Nath 1994) in Figure 11. We divide the simulation results into three categories and denote their virial density nHvir \ 3.80] 10~5 cm~3 and the virial tem- ()bh2/0.025)(X/0.76)(1 ] z
c)3
perature Tvir by di†erent symbols : (1) efficient cooling (circles), if the gas massMcloudcan cool beforet (2)
c] tdyn ; moderate cooling (triangles), ifMcloudcan cool only within the present age of the universet0 ;and (3) inefficient cooling (crosses), if otherwise. For comparison, three analytical rela- tions are computed using the same UV parameters as the simulations except for assuming optically thin in all cases :
(solid line) ; (dashed) ; and tcool\ tdyn tcool\ t0[ t
c Tvir\ Teq
(dotted), whereTeqis the temperature at which the cooling and heating rates balance (H \ L). The former two ana-
FIG. 8.ÈFraction of gas mass collapsed after the onset of the UV backgroundzUV\ 20as a function of circular velocity. Each horizontal row traces the time evolution att \ 0.5t of runs with (top panels), 3 (middle panels), and 10 (bottom panels). Lines and symbols correspond to di†erent
c, tc, 2tc zc\ 0.5
parameters of the UV background as shown in the Ðgure (unless indicated, absorption is considered).
lytical relations are evaluated usingnHvir atz while the last c,
one usesnHta \ nHvir/8at the turnaround epochzta.
Figure 11 shows that our simulation results under a con- stant UV are in reasonable agreement with the analytic estimates deÐned above : (1) efficient cooling lies in the region where tcool \tdyn, tcool \t0[ t and (2)
c, Tvir [Teq ; moderate cooling mainly lies wheretdyn \tcool \t0[ t and
and (3) inefficient cooling lies where c
Tvir [Teq ; tcool [t0[ t
or Tvir \Teq. Such correspondences degrade near thec boundaries of each region. Compared with the optically thin runs, cooling efficiency is systematically enhanced to some extent if the absorption is taken into account.
It should be noted that, in order to achieve above agree- ments, it is essential to evaluate the relationTvir\ Teqatzta, not atz (if evaluated at the dotted lines in Fig. 11 are
c zc,
shifted downward by a factor of 8). This is because the cloud evolution largely depends on the photoionization prior to the collapse. Roughly speaking, whether the gas can con- tract or keeps expanding is determined by the balance between the gravitational force and the thermal pressure gradient when it is ““ maximally exposed ÏÏ to the external UV Ñux, i.e., when the gas attains the maximum value of For the gas exposed to the constant UV Ñux from J21/nH.
the linear regime, this corresponds to the turnaround. The above statement also applies in the presence of the evolu- tion in the UV intensity.
4.2. Cosmological Implications
The suppression of low-mass objects by the UV back- ground radiation has profound implications on cosmology and galaxy formation. Given the fraction of cooled gas in objects of di†erent masses and collapse redshifts from the simulations, we can deduce the abundance distribution of collapsing objects in the entire universe. SpeciÐcally, we compute the baryon mass density that cools and collapses per unit of redshift as a function of the collapsed mass Mcoll of baryons in a halo and the collapse epochz as
d2ocoll(Mcoll, z c c)
dMdz \ Mcoll
d2Nhalof (Mcoll )0/f
coll )b, zc)
dMdz ,
(16) wherefcollis the collapse fraction of a cloud relative to the pressureless case, andd2Nhalof (M, z)/dMdz is the comoving number density of halos with mass M that collapse and form per unit redshift at z. We use the latter quantity rather than a conventional mass function, e.g., that of Press & Schechter (1974) becausefcollobtained in our simulations is more closely related to clouds just collapsing at a given redshift. Unfortunately, there is not yet a fully self- consistent analytical formalism to compute this quantity, although several approaches have been proposed (e.g., Bond et al. 1991 ; Lacey & Cole 1993 ; Sasaki 1994 ; Kitay- ama & Suto 1996a, 1996b ; Manrique & Salvador-Sole
FIG. 9.ÈCritical circular velocitiesV (thin lines) and (thick lines) of the collapse (see text for deÐnitions) with absorption (triangles, solid lines) and
ccut V
chalf
in the optically thin case (circles, dotted lines). (a)J21\ 1,a \ 1 ; (b)J21\ 0.1,a \ 1 ; (c)J21\ 1,a \ 5 ; and (d) evolvingJ21,a \ 1. Larger symbols in panel (a) indicateV in the case of
ccut z
UV\ 50.
1996). In this paper, as a working hypothesis, we adopt the halo formation rate given by equation (15) of Kitayama & Suto (1996a) with the threshold massM (see their
f\ M/2
paper for details). We have checked that our results are qualitatively unchanged by adopting an alternative approach by Sasaki (1994).
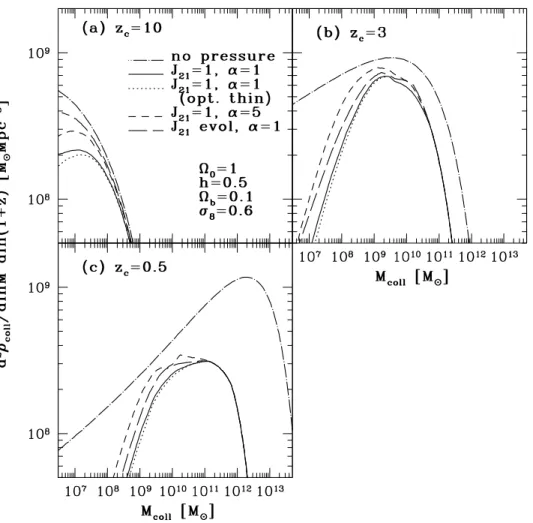
Figure 12 illustrates the baryon mass distribution of col- lapsing objects in the standard CDM universe. In the absence of pressure, collapsing objects have a broad mass distribution with an increasing fraction of high-mass objects at lower redshifts. Once the gas pressure is taken into account, high-mass objects are reduced by the low cooling efficiency, and low-mass objects by the UV background. As a result, the abundance distribution atz agrees well
c[3
with the observed mass range of galaxies. Note that the low-mass end of the distribution has a tail, not a sharp cut-o†. This is because the objects just aboveV can have
ccut
a wide range ofMcoll for almost identicalMcloud.Thus the collapse of dwarf-sized objects of massMcoll[109 M is still possible at z but such objects are expected to_
cD 0.5,
have a lower baryon fraction than normal galaxies. This point can be tested by future observations.
One can integrate the above distribution over mass to obtain the total amount of baryon that is collapsing at a given epoch. Figure 13 shows the evolution of this quantity (denoted by ““ cold gas ] star ÏÏ). We have also deduced simi-
larly from our simulations the baryon mass density that becomes bound by the gravity of clouds but not yet cooled atz Such a component, denoted by ““ hot gas,ÏÏ is contained
c.
mainly in objects corresponding to groups and clusters of galaxies. We further deÐne ““ unbound gas ÏÏ as the gas that becomes unbound because of the UV background but that would have collapsed at z in the absence of pressure. Figure 13 indicates that the production rate (per Hubblec time at a given epoch) of ““ cold gas ] star ÏÏ has a peak at and that it is rather insensitive to the UV param- zcD 2È3
eters. This seems to suggest a high efficiency of star forma- tion activity at these redshifts. On the other hand, the production rate of ““ hot gas ÏÏ and that of ““ unbound gas ÏÏ simply increases and decreases with time, respectively (see also Barkana & Loeb 1999 ; Cen & Ostriker 1999).
Figure 14 further compares the predicted production rate (per year) of ““ cold gas ] star ÏÏ in the standard CDM uni- verse with the observed cosmic star formation rate (SFR, Madau et al. 1996 ; Madau, Pozzetti, & Dickinson 1998 ; Lilly et al. 1996 ; Connolly et al. 1997) compiled by Totani, Yoshii, & Sato (1997) and T. Totani (1999, private communication). This comparison is demonstrative only since the predicted curves simply set an upper limit to the global SFR in the universe and their normalization can be shifted in proportion to the baryon density parameter )
b. Nonetheless, it is noticeable that the predicted production
FIG. 10.ÈBaryon mass corresponding toV as a function of collapse chalf
epoch z (thick lines). Di†erent parameters of the UV background are assumed as shown in the Ðgure (unless indicated, absorption is considered).c Also plotted are the Jeans mass with T \ 104 K (thin, dotÈshort-dashed lines) and the masses corresponding to 1, 2, 3p density perturbations (thin, dotÈlong-dashed lines) in the standard CDM universe with)0\ 1,h \ 0.5, ) and
b\ 0.1, p8\ 0.6.
rates of ““ cold gas ] star ÏÏ under the UV background show a steep rise atz [ 1, in good qualitative accordance with what is actually seen in the SFR data. At higher redshifts, they continue to rise up to zD 4 and then Ñatten. This is somewhat di†erent from a rather sharp decline at zD 2È4 in the observed SFR. It should be kept in mind, however, that these SFR data are still very uncertain because of the dust extinction and may be shifted upward by large factors (e.g., Pettini et al. 1998). Recent detections of star-forming galaxies in the submillimeter band also suggest rather high SFR of Z2] 10~1h M_ yr~1 Mpc~3 at zD 2È4 (Smail, Ivison, & Blain 1997 ; Hughes et al. 1998 ; Berger et al. 1998). More detailed discussion on this subject should await higher precision data from future infrared observations.
4.3. Imprints on Quasar Absorption L ines
The e†ects of the UV background radiation on the inter- galactic medium can be observed most directly by means of absorption lines of quasar spectra. To discuss the impacts of current results on such observations, we plot in Figure 15
the line-of-sight column densities through the cloud N jp ( j \ H I, He I, He II) as a function of impact parameter p. Here, we restrict the observability of these elements to the column densities N cm~2 and deÐne the critical
jp [ 1014
impact parameterpcrt within which the column density is greater than 1014 cm~2. As the column density of each element is too small to be detected except at the central region in the case of J21\ 1 and a \ 1, we focus on the other two cases of UV parameters shown in Figure 15. In Tables 2 and 3, we summarizepcrtand the ratio of its square value, which corresponds to the ratio of area, i.e., the rela- tive expected number. These tables suggest that a large number of helium forest lines are expected, especially under the soft UV spectrum. Recent observations by HST in fact indicate the detections of numerous He II lines (Hogan, Anderson, & Rugers 1997 ; Reimers et al. 1997 ; Anderson et al. 1999).
If we Ðt the lines in Figure 15 atN cm~2 by a jp [ 1014
single power law N then the column-density dis- jpP p~n,
tribution of each absorption line is written as dN/dN jpP withb \ (n ] 2)/n. In Table 4, we summarize n and (Njp)~b
b values. Since these are crude numbers, we merely present the values in the case of evolvingJ21atz and ignore
c\ 0.5 the dependence on redshift and UV parameters. At N
H Ip [ 1016 cm~2, the column-density distribution of He I is similar to that of H I, while that of He II is a little steeper. These points can be checked by future observations.
The above results are also clearly seen in Figure 16, which plots the line-of-sight column densities of He I and He II against the H I column density. The relations among these column densities are rather insensitive to V and
c zc
and are summarized in Table 5 (values are given for V c\ 32 km s~1 andz For the He I lines to be detected at
c\ 0.5).
cm~2, the corresponding H I forest lines are NHe Ip [ 1014
required to have N cm~2. On the other
H Ip [ 1014È1016
hand, He II forest lines are more easily detectable and are even saturated atN cm~2.
H Ip [ 1016
In addition to the high observability of the helium absorption lines at the UV wavelengths, our results further suggest an interesting feature in the H I absorption lines at high column densities. When the line of sight passes near the central region of a cloud that has just collapsed, the gas is expected to be neutral, but the temperature can be as high as 104 K because the timescale of ionization is longer than that of photoionization heating (eq. [15]). It should be kept in mind that if the hydrogen molecules, ignored in the present paper, are present, they could allow cooling below 104 K. In any case, the existence of the warm neutral gas could be checked by the H I absorption lines with a large Doppler parameter and the 21 cm emission line with high
TABLE 2
THE CRITICAL IMPACT PARAMETERpcrtAND THERATIO OF ITS SQUARE FOR THE EVOLVINGJ ANDa \ 1
21
Vc\ 32 km s~1 V
c\ 50 km s~1 REDSHIFT SPECIES pcrt(kpc) Ratio of pcrt2 pcrt(kpc) Ratio of pcrt2
z \ 3 . . . . H I 10 1 10 1
He I 0.8 1/156 1 1/100
He II 20 4 40 16
z \ 0 . . . . H I 40 1 100 1
He I 10 1/16 10 1/100
He II 100 6.25 100 1
clouds in which the cooled gas mass reachesMcloudbeforet (circles), before the present age of the universe (triangles), and otherwise (crosses) ; (a)
c] tdyn t0
a \ 1, optically thin case ; (b) a \ 1, with absorption ; (c) a \ 5, optically thin case ; and (d) a \ 5, with absorption. Lines
J21\ 1, J21\ 1, J21\ 1, J21\ 1,
show the analytic relationst evaluated at (solid), at (dashed), and at (dotted), with the same UV parameters as the cool\ tdyn zc tcool\ t0[ tc zc Tvir\ Teq zta
simulations except for assuming that the medium is optically thin in all cases.
TABLE 3
THE CRITICAL IMPACT PARAMETERp AND THERATIO OF ITS SQUARE FOR THE EVOLVINGJ21crt\ 1 AND a \ 5.
Vc\ 32 km s~1 V
c\ 50 km s~1 REDSHIFT SPECIES pcrt(kpc) Ratio of pcrt2 pcrt(kpc) Ratio of pcrt2
z \ 3 . . . . H I 20 1 30 1
He I 10 0.25 15 0.25
He II 100 25 150 25
z \ 0 . . . . H I 10 1 10 1
He I 7 0.49 7 0.49
He II 200 400 400 1600
TABLE 4
INDICES OF COLUMN-DENSITY DISTRIBUTIONS,N AND jpP p~n dN/dN
jpP (N jp)~b
Vc\ 32 km s~1 V
c\ 50 km s~1
SPECIES j n b n b
H I (N
H Ip \ 1016 cm~2) . . . . 1.5 2.3 1.3 2.5 H I (N
H Ip [ 1016 cm~2) . . . . 3 1.7 24 1.1 He I . . . . 3.7 1.5 18 1.1 He II . . . . 2 2 2.3 1.9
TABLE 5
RELATIONS AMONGN AND INcgs UNITS
H Ip , N
He Ip , N He II p External UV
Background N
H Ip \ 1016 cm~2 N
H Ip [ 1016 cm~2 J21evolving,a \ 1 . . . N
He Ip D 1011(N
H Ip /1014)1.5 N
He Ip D 10~1N H Ip NHe IIp D 10NH Ip NHe IIp D 1018 J21\ 1, a \ 5 . . . . NHe Ip D 1013(NH Ip /1014)1.5 N
He Ip D 10N H Ip NHe IIp D 103NH Ip NHe IIp D 1018
FIG. 12.ÈMass distribution of the baryon density that collapses per Hubble time at (a)z (b) and (c) in the standard CDM model c\ 10 ; zc\ 3 ; zc\ 0.5
with)0\ 1,h \ 0.5,) and Lines indicate the cases of di†erent UV parameters or of no pressure as shown in the Ðgure (unless indicated, b\ 0.1, p8\ 0.6.
absorption is taken into account).
spin temperature. Incidentally, the recent observations of damped Lya systems (Lane et al. 1998 ; Chengalur & Kanekar 1999) suggest the detection of neutral gas with the spin temperatureD103 K, which is much higher than what is found in normal spiral galaxies.
5. CONCLUSIONS
We have shown that the formation of the subgalactic clouds is greatly prevented by the UV background radi- ation even if the transfer of the external UV photons is taken into account. Within the range of parameters investigated in this paper (J21¹1, a \ 1, 5, z the complete
c\ 0È10),
suppression of collapse occurs for the clouds with circular velocities typically in the rangeV km s~1 and the
cD 15È40
50% reduction in the cooled gas mass withV km cD 20È55 s~1. These values depend most sensitively on the collapse redshiftz and the slope of the UV spectruma.
The evolution of the UV background also a†ects thec above thresholds in a signiÐcant manner. The decline of the UV intensity at z [ 3 can decrease the threshold circular velocities at lower redshifts. This e†ect, however, is delayed untilz [ 1.5because of the kinetic energy of gas particles attained at higher redshifts. In fact, whether the gas can contract or keeps expanding is roughly determined by the balance between the gravitational force and the thermal pressure gradient when the gas attains the maximum value of J21/nH.
Insofar as the evolution of the gas down to T D 104 K is considered, the radiative transfer of the ionizing photons has the moderate e†ect. Compared with the optically thin case, the absorption of the UV photons by the intervening medium systematically lowers the above threshold values by*V km s~1. Once the evolution below T D 104 K is
cD 5
taken into account, incorporating the formation and destruction of hydrogen molecules, the radiative transfer is expected to be of greater signiÐcance (Haiman, Rees, & Loeb 1996, 1997). We will investigate the dynamical evolu- tion of the gas clouds in this regime in future publications (T. Kitayama et al., in preparation ; see also Susa & Umemura 2000).
Our calculations are in good accordance with those of Thoul & Weinberg (1996) for the same set of parameters, i.e., in the optically thin case and z This gives an
c\ 2È5.
important cross-check of the current results and conÐrms that they are insensitive to the di†erent choices of initial conditions and central boundary conditions between their calculations and ours (see ° 2.4 and ° 4.1 of Thoul & Wein- berg 1995).
Based on the results of numerical simulations, we have predicted the global production rates of cold gas, hot gas, and unbound gas in the standard CDM universe. The abun- dance distribution of the cold gas matches well the observed mass ranges of dwarfs and galaxies. The global production rate of cooled gas is found to rise steeply from the local
FIG. 13.È(a) Baryon density that cools (thick lines) or becomes bounded (thin lines) per Hubble time under the UV background, normal- ized by that which collapses in the absence of gas pressure. Lines specify di†erent UV parameters as shown in the Ðgure (unless indicated, absorp- tion is considered). The three regions divided by thick and thin lines corre- spond to ““ cold gas ] star,ÏÏ ““ hot gas,ÏÏ and ““ unbound gas,ÏÏ respectively. (b) Production rates of ““ cold gas ] star,ÏÏ ““ hot gas,ÏÏ and ““ unbound gas ÏÏ for the evolvingJ anda \ 1. For both panels, the standard CDM model is assumed. 21
universe to zD 2È3, indicating a higher efficiency of star formation activity at high redshifts.
We further predict that a large number of the He II and He I forest lines may arise in the quasar spectra at the UV
FIG. 14.ÈGlobal production rates of ““ cold gas ] star ÏÏ per year pre- dicted in the standard CDM model (unless indicated, absorption is considered). Also potted for reference are the observed cosmic SFRs (Madau et al. 1996, 1998 ; Lilly et al. 1996 ; Connolly et al. 1997), without corrections for the dust extinction, compiled by Totani et al. (1997) and T. Totani (1999, private communication).
wavelengths, which can be detected by HST and future space missions. Such observations should provide powerful probes of the physical state of the intergalactic medium, such as the gas kinematics, and the UV background spec- trum (e.g., Sargent et al. 1980 ; Rauch 1998). In addition, the existence of the warm neutral gas is inferred, owing to the high efficiency of heating over ionization. The temperature of such gas can be as high asD104 K, and it may be related to the high spin temperatures suggested from the 21 cm absorption-line observations in the nearby damped Lya systems (Lane et al. 1998 ; Chengalur & Kanekar 1999). In testing these predictions, it is essential to perform the multi- line analyses of the absorption systems, which will become possible with greater precision in the near future.
We thank Naoteru Gouda, Izumi Murakami, Tatsushi Suginohara, Hajime Susa, Yasushi Suto, and Masayuki Umemura for discussions, and the referee, Rennan Barkana, for helpful comments. We are also grateful to Masahiro Kawasaki and Hideyuki Suzuki for suggestions on the numerical code and to Tomonori Totani for providing the SFR data. T. K. acknowledges fellowships from the Japan Society for the Promotion of Science.
APPENDIX
AN ANALYTICAL SOLUTION FOR RADIATIVE TRANSFER : PHOTOIONIZATION COEFFICIENTS AND HEATING RATES OF PRIMORDIAL GAS
We derive analytical formulae for the photoionization coefficients and heating rates of a radiation Ðeld penetrating into primordial gas aligned in a plane-parallel geometry with an arbitrary density proÐle. The frequency/direction-dependent radiative transfer caused by the absorption by multiple species is explicitly taken into account. While the gas composed of atomic hydrogen and helium is considered here, the formalism can be extended readily to include other species. The derived
FIG. 15.ÈLine-of-sight column densities through the cloudN ( j \ H I, He I, He II) as a function of impact parameter p for km s~1 (left panels)
jp V
c\ 32
andV km s~1 (right panels). Thick lines are the clouds with viewed at z \ 3, while thin lines those with viewed at z \ 0. Choices of the
c\ 50 zc\ 3 zc\ 0.5
UV parameters (all with absorption) are as indicated in the Ðgure.
formulae are applicable to a variety of problems, e.g., the reionization of the universe and the photoionization of a mini- pancake or low-metallicity gas in galactic haloes.
A1. DERIVATION
Suppose that an isotropic incident radiation Ðeld is processed through a gas slab composed mainly of atomic hydrogen and helium. For simplicity, we neglect the emission and scattering of photons by the intervening medium and consider only the absorption above the ionization energy of each species. We model the incident radiation spectrum as a power law with an indexa :
I0(l)\ I 0(lH I)
A
l lH I
B
~a
, (A1)
whereI is the speciÐc intensity at the ionization frequency of neutral hydrogen Then the processed mean intensity at
0(lH I) lH I.
an arbitrary point inside the slab is written as J(l) \ 1
4n
P
duI0(lH I)A
l lH IB
~ae~q(l,u) , (A2)using the optical depthq(l, u) along a photon path s from the slab boundary to the point in the incident direction u : q(l, u) \ ;
i
pi(l)
P
unids , (A3)wherep and are the photoionization cross section and the number density of the species i (\ 1, 2, 3 or H I, He I, He II, in i(l) ni
the ascending order in its ionization energy), respectively. For simplicity, we approximate the cross sections by a single power law :
pi(l) \ pi(li)
A
l liB
~gi
#(l [ l
i) , (A4)