Distinct neural mechanisms for the control of
thirst and salt appetite in the subfornical
organ
Matsuda, Takashi
Doctor of Philosophy
Department of Basic Biology
School of Life Science
SOKENDAI (The Graduate University for
Advanced Studies)
Distinct neural mechanisms for the control of
thirst and salt appetite in the subfornical organ
Matsuda, Takashi
SOKENDAI
(THE GRADUATE UNIVERSITY FOR ADVANCED STUDIES)
SCHOOL OF LIFE SCIENCE
DEPARTMENT OF BASIC BIOLOGY
A THESIS SUBMITTED FOR THE DEGREE OF
DOCTOR OF PHILOSOPHY
1
Contents
Contents………1
Abstract……….2
Abbreviations………...5
Chapter I General introduction…..……….7
Figures……….….12
Chapter II Roles of AT1a signals in thirst and salt-appetite generation…….…...15
Introduction…….……….….16
Materials and Methods……….….18
Results……….…….….23
Discussion……….…….….27
Figures……….…….….30
Chapter III Distinct neural pathways for the control of thirst and salt appetite in the subfornical organ……….……...………..……...40
Int roduct i on……….….41
Materials and Methods……….….43
Results……….…….….48
Discussion……….…….….53
Figures……….…….….56
Chapter IV Modulations of the neuronal activities of the water and salt neurons in the subfornical organ………...………..………....80
Introduction……….….81
Materials and Methods……….82
Results……….……..….84
Discussion……….……..….88
Figures……….……..….90
Chapter V Summary and conclusion………..97
Figures……….……100
Chapter VI References………..102
Acknowledgements………....………...…….….…112
2
Abstract
Body-fluid conditions are continuously monitored in the brain to regulate thirst and salt-appetite sensations. The central monitoring of body-fluid conditions is considered to be mediated by sensory circumventricular organs (sCVOs), brain regions that lack a blood-brain barrier, but harbor neuronal cell bodies. sCVOs consist of the subfornical organ (SFO), organum vasculosum of the lamina terminalis (OVLT), and area postrema.
Na+-levels in body fluids are sensed by Nax channels expressed in specific glial cells in the SFO. The activation of Nax stimulates the glial cells to release lactate, which functions as a gliotransmitter that activates GABAergic inhibitory neurons in the SFO. It has been postulated that the activation of the GABAergic neurons suppress salt appetite. On the other hand, angiotensin II (Ang II) drives both thirst and salt appetite; however, the neural mechanisms underlying selective water- and salt-intake behaviors remain unknown.
To investigate water- and salt-intake behaviors, I established water- and/or Na-depleted conditions in mice by dehydration (water-depleted), furosemide treatment (water- and Na-depleted), or combining furosemide treatment with water satiation (Na-depleted), respectively. Blood Ang II levels increased to similar levels in all of the three conditions. Under the water-depleted and Na-depleted conditions, the expression of Fos, a marker for neuronal activity, was specifically increased in Ang II receptor type 1a (AT1a)-positive neurons in the SFO and OVLT.
To examine the contribution of the SFO and OVLT to water- and salt-intake behaviors, AT1a gene was site-specifically deleted in the SFO and/or OVLT. The local deletion of AT1a in the SFO resulted in significant reductions in water intake under the
3
water- and Na-depleted condition and in salt intake under the Na-depleted condition. In contrast, the local deletion of AT1a in the OVLT resulted in marked reductions in water intake under the water- and Na-depleted condition, but not salt intake under the Na-depleted condition. These results suggest that AT1a signals in the SFO are involved in both water and salt intake, whereas those in the OVLT are involved only in water intake.
My anatomical analyses revealed that AT1a-positive neurons in the SFO were largely glutamatergic, and they had projections to the OVLT, ventral part of the bed nucleus of the stria terminalis (vBNST), and so on. Notably, Fos-positive neurons under the water-depleted condition overlapped well with the SFO neurons projecting to the OVLT [SFO(→OVLT) neurons]. In contrast, the SFO neurons projecting to the vBNST [SFO(→vBNST) neurons] expressed Fos under the Na-depleted condition. Furthermore,
I tested whether optical manipulations of the specific neural pathways by using channelrhodopsin 2 and archearhodopsin 3 can control the specific intake behaviors. As was expected, water- and salt-intake behaviors were selectively controlled by optogenetic manipulations of neuronal activities of the respective neuronal groups. From these results, I conclude that the SFO(→OVLT) neurons and SFO(→vBNST) neurons control thirst and salt appetite, respectively.
To examine the relationship between Nax signals and AT1a-dependent control of salt appetite, I examined whether the activity of the SFO(→vBNST) neurons is
regulated by Nax signals through GABAergic neurons. As previously reported, Nax-knockout (KO) mice did not show salt aversion under the water-depleted condition. Increased Fos expression was observed in the SFO(→vBNST) neurons of the Nax-KO mice compared with wild-type mice. In addition, electrophysiological experiments
4
demonstrated that the Ang II-induced firing activity of the SFO(→vBNST) neurons was suppressed dependent on the activity of GABAergic neurons by a hypertonic Na solution. The Na-dependent responses were absent in brain slices prepared from Nax-KO mice. Thus, Nax signals suppressed the activity of the SFO(→vBNST) neurons through activation of GABAergic neurons in the SFO.
In addition, I explored inhibitory signals that suppress the activity of the SFO(→OVLT) neurons. I tested cholecystokinin (CCK) because it reportedly inhibits water intake. I found that the Ang II-induced firing activity of the SFO(→OVLT)
neurons was suppressed by application of CCK through activation of GABAergic neurons in the SFO. In line with this finding, CCK levels in the SFO were increased under the Na-depleted condition. Of note, CCK did not affect the activity of the GABAergic neurons which made synapse onto the SFO(→vBNST) neurons. These
results indicate that CCK levels in the SFO modulate the activity of the SFO(→OVLT) neurons through activation of another population of GABAergic neurons.
In summary, I demonstrate that the AT1a-positive SFO neurons projecting to the OVLT and vBNST encode thirst and salt appetites, respectively. I named these two population of driving neurons “water neuron” and “salt neuron”, respectively. The thirst and salt-appetite behaviors are separately controlled dependent on body-fluid conditions. This would provide substantial explanations for the neural mechanisms in the SFO that generate appropriate water- and salt-intake behaviors based on body-fluid conditions.
5
Abbreviations
AAV adeno-associated virus
aca anterior commissure, anterior
AcbC core region of the accumbens nucleus AcbSh shell region of the accumbens nucleus α-CHCA α-cyano-4-hydroxycinnamic acid
Ang II angiotensin II
AP area postrema
ArchT archearhodopsin 3
AT1a angiotensin II receptor type 1a AT1b angiotensin II receptor type 1b
AT2 angiotensin II receptor type 2
CCK cholecystokinin
CCKAR cholecystokinin A receptor
CCKBR cholecystokinin B receptor
ChR2 channelrhodopsin 2
CPu caudate putamen
CTb-555 alexa555-conjugated cholera toxin subunit b
CSF cerebrospinal fluid
Cre cre recombinase
DIO double-floxed inverted orientation
DMD dorsal part of the dorsomedial hypothalamic nucleus
EDTA ethylenediaminetetraacetic acid
EGFP enhanced green fluorescent protein
GABA 4-aminobutanoic acid
GAD67 glutamic acid decarboxylase 67
HSD2 11β-hydroxysteroid dehydrogenase
HiRet highly efficient retrograde gene transfer lentivirus IPSC inhibitory postsynaptic currents
KO knockout
LH lateral hypothalamic area
loxP locus of crossing-over in phage P1 LSD dorsal part of the lateral septal nucleus
MSCV murine stem cell virus
mfb medial forebrain bundle
6
MnPO median preoptic nucleus
MPA medial preoptic area
MPO medial preoptic nucleus
MRI magnetic resonanse imaging
Na sodium
Na-D Na-depleted
NLS nuclear localization signal
nNOS neural nitric oxide synthase
NTS nucleus of the solitary tract
Opt optical exposure
OVLT organum vasculosum of the lamina terminalis
PBS phosphate-buffered saline
PCR polymerase chain reaction
PET positron emission tomography
PVN paraventricular nucleus
RFP red fluorescent protein
RIA radioimmunoassay
RNA ribonucleic acid
sCVOs sensory circumventricular organs
SFO subfornical organ
SON supraoptic nucleus
SSC saline sodium citrate
TRITC Tetramethylrhodamine isothiocyanate
vBNST ventral part of the bed nucleus of the stria terminalis
Vgat vesicular GABA transporter
Vglut2 vesicular glutamate transporter 2
VLPO ventrolateral preoptic nucleus
VTA ventral tegmental area
W-D water-depleted
W/Na-D water- and Na-depleted
WPRE woodchuck hepatitis virus response element
WT wild-type
7
Chapter I
General introduction
8
Thirst and salt appetite are controlled according to the body-fluid conditions Terrestrial animals including humans are generally exposed to the risks of dehydration and salt deficiency. Severe deficits of water and salt in body fluids cause the seeking and ingestion of water and salty substances in order to replenish lost water and salt. Early studies predominantly investigated the water appetite (thirst) on animal behaviors. Dehydrated animals show excessive drinking rapidly (Thracher et al., 1981; McKinley et al., 1983), and this rapid effect also occurs when animals drank hypertonic NaCl solution (Holmes and Gregersen, 1950). Increases in plasma osmolality reflected by plasma Na+ levels ([Na+]) cause proportional increases in water intake in animals (Fitzsimons, 1963). In addition, dehydrated mice exhibit an aversion to saline at concentrations over 0.15 M, more than the physiological level, because of high [Na+] in body fluids (Watanabe et al., 2000).
On the other hand, salt appetite is known to be caused by considerable deficits in body salt, including pregnancy, vomiting, sweating, hemorrhage, diarrhea, and long-term maintenance on a Na-deficient diet (Hurley and Johnson, 2015). Salt appetite is satisfied by ingesting Na but not chloride (Rowland et al., 2004). In experimental conditions, systemic administrations of diuretic agents such as furosemide and of colloids such as polyethylene glycol have been reported to induce salt intake behavior only for several hours (Thunhorst and Johnson, 1994). During the loss of body salt, natriorexigenic hormones and mineralocorticoid hormones are secreted from peripheral tissues, and they stimulate salt-intake behavior and renal reabsorption of Na+ (Fitzsmons, 1998).
Impairment of thirst in elderly people causes severe dehydration and increases risk of death(Kenney and Chiu, 2001). In addition, excessive dietary salt intake by
9
humans has been strongly implicated in the development of heart, renal and liver failure, as well as salt-sensitive hypertension (Geerling and Loewy, 2008; Gabor and Leenen, 2012).
Sensory circumventricular organs monitor the body-fluid conditions
Na+ is the main cation in body fluids (such as plasma and the cerebrospinal fluid) and the main determinant of osmolality. [Na+] in body fluids is continuously monitored in the brain to maintain it within the physiological range (Johnson, 2007). The central monitoring of body-fluid conditions is considered to be mediated by sensory circumventricular organs (sCVOs), brain regions that lack a blood–brain barrier, but
harbor neuronal cell bodies (McKinley et al., 2003). sCVOs are situated in the walls of third and fourth ventricles and accessed the body fluids through a single layer of ependymal cells. These cells have characteristic structures of permeable capillary networks and facilitate tissue penetration to monitor circulating substances (Johnson and Gross, 1993). sCVOs consist of the subfornical organ (SFO), organum vasculosum of the lamina terminalis (OVLT) and area postrema (AP) (Fig. I.1; McKinley et al., 2003). Multiple neuronal populations reside in the SFO, and some of them are known to have connections with distinct brain regions such as the OVLT, median preoptic nucleus (MnPO), paraventricular nucleus (PVN), supraoptic nucleus (SON), and so on (Johnson, 2007; McKinley et al., 2003).
Nax channel modulates salt appetite according to the body-fluid conditions
The Nax channel is an atypical Na channel with low homology to other voltage-gated sodium channels: It shows significant differences of amino acid sequence in the voltage
10
sensors compared with voltage-gated sodium channels (Fig. I.2A; Goldin et al., 2000). Nax lacks some positive charges in the S4 segment, which are important for voltage sensitivity (Fig. I. 2B). By using Scn7a-knockout (KO) (Nax-KO) mice, Prof. Noda’s laboratory identified Nax channels specifically expressed in the glial cells (ependymal cells and astrocytes) of the SFO and OVLT as a brain [Na+] sensor that detects [Na+] elevations in body fluids within the physiological range (Hiyama et al., 2002; Noda and Hiyama, 2005; Noda, 2006; Watanabe et al., 2006; Noda and Sakuta, 2013; Noda and Hiyama, 2015a; Noda and Hiyama, 2015b). The sensitivity of Nax to [Na+] was revealed to be upregulated by endothelin-3 through activation of endothelin receptor B (Hiyama et al., 2013). Noda and his colleagues subsequently revealed that the SFO is the principal site for sensing [Na+] in body fluids to generate salt-avoidance behavior in dehydrated animals (Watanabe et al., 2000; Hiyama et al., 2004; Hiyama et al., 2010). Afterward, they found that the activation of Nax leads to upregulation of Na+/K+-ATPase in the glial cells to release lactate, which functions as a gliotransmitter that activates GABAergic inhibitory neurons in the SFO (Shimizu et al., 2007). From these results, I hypothesized that the GABAergic neurons may suppress the activity of putative neurons encoding salt appetite in the SFO (Fig. I. 3).
Angiotensin II stimulates thirst and salt appetite
Angiotensin II (Ang II) is widely known as an octapeptide that causes vasoconstriction and a subsequent increase in blood pressure (Paul et al., 2006). On the other hand, Ang II has been also known as a powerful stimulus to thirst and salt appetite, because intracranial injections of Ang II have been shown to induce an immediate increase in water intake followed by a slower increase in salt intake (Buggy and Fisher, 1974;
11
Fitzsmons, 1998). sCVOs in the brain have been suggested as the major sites for the signal transduction of circulating Ang II to neural signals, because Ang II receptors (Ang II receptor type 1a (AT1a), AT1b and AT2 in rodents; AT1 and AT2 in humans) are strongly expressed in sCVOs (Premer et al., 2013). However, the Ang II-dependent neural mechanisms underlying selective water- and salt-intake behaviors remain unknown. Therefore, I considered that functional characterization of the neurons expressing Ang II receptors in sCVOs may reveal neural mechanisms to generate thirst and salt appetite.
In this thesis, I visualized and characterized AT1a-positive neurons in sCVOs by using AT1alacZ/+ mice in which Agtr1a encoding AT1a was knocked-out by inserting the lacZ reporter gene in-frame (Sugaya et al., 1995), and demonstrated by using optogenetical and electrophysiological techniques that thirst and salt appetites were controlled by different groups of the AT1a-positive neurons in the SFO. This study explains the neural mechanisms in the SFO that generate appropriate water- and salt-intake behaviors based on body-fluid conditions.
12
Figure I.1 Sensory circumventricular organs.
A schematic drawing of the sensory cicumventricular organs (sCVOs) in the mid sagittal section of mouse brain. sCVOs consist of the subfornical organ (SFO), organum vasculosum of the lamina terminalis (OVLT), and area postrema (AP). These loci are situated in the wall of third and fourth ventricules. 3V, third ventricules. Adapted from Noda and Hiyama, Pflugers. Arch. – Eur. J. Physiol. 467, 465–474 (2015).
13
Figure I.2 Nax channel is a member of the sodium channel family.
(A) Phylogenetic tree of mammalian voltage-gated Na channel α-subunits. (B) Schematic illustrations of Nax channel. The numbers represent amino acid residues. 1–6, putative transmembrane segment (S1–S6) in each repeat (I–IV); P, putative pore-forming regions. Adapted from Goldin et al., Neuron 28, 365–368 (2000) (A), and Shimizu et al., Neuron 54, 59–72 (2007) (B).
14
Figure I.3 Overview of the Na+-sensing mechanism.
A schematic drawing of Na+-sensing mechanism and Nax-dependent regulation of neuronal activities of the salt-appetite control neurons in the SFO. ET-3, endothelin-3; ETBR, endothelin receptor B. Adapted from Noda and Hiyama, Pflugers. Arch. – Eur. J. Physiol. 467, 465–474 (2015).
15
Chapter II
Roles of AT1a signals in thirst and
salt-appetite generation
16
II.1 Introduction
Ang II, an octapeptide hormone, is generated from the precursor molecule, angiotensinogen which is produced in the liver (McKinley and Johnson, 2004). When the renal blood flow is reduced, prorenin in the juxtaglomerular cells in the kidneys is converted to renin, and secreted into the circulation (Sealey et al., 1986). Renin cleaves angiotensinogen and produces Ang I. Subsequently, Ang I is further cleaved to form Ang II by angiotensin converting enzyme (Fitzsimons, 1998). Two receptor subtypes for Ang II, subtype 1 (AT1) and subtype 2 (AT2), have been identified in mammals (Timmermans et al., 1992). Rodents possess two AT1 receptor isoforms, named AT1a and AT1b (Sasamura et al., 1992). A previous study using transgenic mice with overexpression of AT1a in the brain revealed the importance of AT1a for the control of thirst and salt appetite (Lazartigues et al., 2008). However, effects of knockout of the Agtr1a gene encoding AT1a on drinking behaviors have not been reported so far.
Intracranial injection of Ang II stimulates the neural activity of sCVOs and induces water and salt intake(Buggy and Fisher 1974; Avrith and Fitzsimons 1980; Rowland et al., 1996; Sunn et al., 2003). Previous studies reported that some neurons in the sCVOs, where AT1a is abundantly expressed, are activated by systemic Na depletion (Fitzsimons, 1998) and that the neural activities in Na-depleted animals are supressed by intracerebroventricular injection of AT1a antagonists along with the reduction of salt-intake behaviors (Geerling and Loewy, 2008). In the sCVOs, there also exists neurons activated by water depletion (Fitzsimons, 1998), and electrolytic lesions of the sCVOs reduced dipsogenic effects of Ang II (Simpson and Routtenberg, 1975; Lind and
17
Johnson, 1983). These results indicate that the sCVOs are involved in drinking behaviors. However, it has not been elucidated what sCVOs are involved in thirst and/or salt appetite. Moreover, it is not known whether AT1a-positive neurons in the sCVOs are directly involved in the generations of thirst and salt appetite.
In the first chapter, in order to reveal functional differences among the sCVOs, I established water- and/or Na-depleted conditions in mice and examined their water- and/or salt-intake behaviors. Agtr1a-KO (AT1a-KO, AT1alacZ/lacZ) mice (Sugaya et al., 1995) and loxP-flanked Agtr1a (AT1aflox/flox) mice (Matsusaka et al., 2010) wereused to know the effects of global or site-specific deletion of AT1a on the water- and/or salt-intake behaviors. I used the AT1alacZ/+ mouse, in which Agtr1a locus was replaced with the lacZ gene, to visualize AT1a-positive cells in the sCVOs.
18
II.2 Materials and Methods
Experimental animals
All experimental protocols with animals were performed according to the guidelines of the National Institutes of Natural Sciences, Japan (approval numbers 12A051, 13A082, 14A149, 15A164, and 16A025). Adult male mice (>8 weeks old) were used in the present study. Wild-type (C57BL/6J, CLEA Japan), Agtr1a-lacZ (AT1alacZ/+ and AT1alacZ/lacZ)(Sugaya et al., 1995), loxP-flanked Agtr1a (AT1aloxP/loxP) (Matsusaka et al., 2010) mice were used. Mice were housed under a constant room temperature (23ºC) on am 8:00-to-20:00 light cycle with water and mouse chow available ad libitum (Rodent Diet CA-1, CLEA Japan) unless otherwise noted. All the behavioral experiments were performed during the light period after mice had been housed individually at least 3 d. All animals had no special previous history before the surgeries or behavioral analyses.
Reagents
Furosemide (F4381, Sigma-Aldrich) and losartan (120-06111, Wako Pure Chemical Industries) were used.
Quantification of blood Na+ and plasma Ang II concentrations
Mice were killed by decapitation and blood samples were collected. Blood Na+ levels were measured with a blood analyzer (i-STAT, Fuso Pharmaceutical Industries), as previously described (Hiyama et al., 2010). Plasma Ang II levels were determined as previously described (Hiyama et al., 2013), with minor modifications. Briefly, blood samples were collected from unrestrained mice in polypropylene tubes with 0.1%
19
EDTA. Blood plasma was obtained by centrifugation. Ang II was extracted from the plasma with acetone and diethyl ether. This sample was dried in a vacuum chamber, and then dissolved in RIA buffer supplied with the radioimmunoassay (RIA) kit (Peninsula Laboratories, San Carlos, CA). Measurements were performed according to the instructions provided for the kit.
Immunohistochemistry
Mice were perfused transcardially with phosphate-buffered saline (PBS) followed by fixation with 20% formalin neutral buffer solution. Coronal sections of the brain were cut at a thickness of 50 µm with a vibratome (VT-1000S, Leica) or cryostat (CM 3050S, Leica). After blocking with blocking buffer containing 5% normal donkey serum and 0.1% Triton X-100 in PBS at room temperature for 1 h, brain sections were incubated with primary antibodies at 4ºC for 2 d and then washed twice in PBS. Sections were reacted with secondary antibodies at 4ºC for 1 d. The primary antibodies used in this chapter were as follows: rabbit anti-β-gal (1:1,000, 55976, Cappel), goat anti-Fos (1:500, sc-52G, Santa Cruz Biotechnology), and mouse anti-Cre recombinase (1:1,000, MAB3120, Millipore). Brain sections were mounted on slides, and z-stack and tiled images were captured on a Zeiss LSM 710 confocal microscope, Nikon A1Rs confocal microscope, or Zeiss AXIO fluorescence microscope using a 10× or 20× objective.
Recombinant Viral Vectors
AAV (with serotype 5 or DJ, Cell Biolabs) (> 1.0 × 10¹⁰ Genomic Copies /mL) was used for gene transfer in vivo. AAV5-CAGGS-NLS-Cre was used for the expression of
20
Cre recombinase. CAGGS, cytomegalovirus (CMV) early enhancer element and chicken -actin promoter; NLS, nuclear localization signal.
Surgery
Mice were anesthetized with sodium pentobarbital (50 mg/kg body weight, i.p. injection) and placed in a stereotactic frame (Narishige). After exposing the skull via a small incision, a small hole was drilled for injections or infusions. An intracerebroventricular infusion with an osmotic pump was performed as described previously (Hiyama et al., 2013). Briefly, mice were implanted with 30-gauge stainless steel cannulas (330OP, Plastics One) stereotaxically aimed at the lateral ventricle (anteroposterior, -0.2 mm; lateral, +1.0 mm; ventral, +2.5 mm; relative to the bregma). A subcutaneous pocket was then prepared on the back of the mouse, and the osmotic pump was placed into the pocket. The external part of the cannula was fixed to the skull with dental cement, and the wound was sutured. Animals were allowed to recuperate for 3 d before behavioral testing. Osmotic minipumps (1002, ALZET) were used to continuously deliver losartan (40 mg/mL) or vehicle solutions at a rate of 0.25 µ L/h; vehicle was modified Ringer solution containing (in mM): 140 NaCl, 2.5 KCl, 2 CaCl2, 1 MgCl2, 10 HEPES, 10 glucose and 5 NaOH (pH 7.3 with HCl).
Viral injections were performed as described previously, with minor modifications (Hiyama et al., 2004). Briefly, a pulled-glass pipette with a tip diameter of 20–40 µm was inserted into the brain, and virus was injected with a microsyringe pump (Ultra Micro Pump III, World Precision Instruments; AAV, 0.1 µ L/min for 5 min). The coordinates for the viral injection relative to the bregma were as follows: the SFO (anteroposterior, -0.6 mm; lateral, ±0.0 mm; ventral, +2.5 mm), and OVLT
21
(anteroposterior, +0.7 mm; lateral, ±0.0 mm; ventral, +5.0 mm). After the glass micropipette was withdrawn, the skin incision was sutured, and animals were allowed to recover.
Behavioral experiments were performed more than 4 week after the virus injection. All stereotaxic injection sites were verified by immunohistochemistry after behavioral tests. When the virus infection to the target site turned out to be unsuccessful, behavioral data obtained from such individuals were excluded from the analyses.
Behavioral Assays
The amounts of fluid intake were automatically monitored by measurements were performed using a previously described system (Hiyama et al., 2004). Mice were acclimated to the spouts providing distilled water and salt solutions for more than 3 d before the tests. Two-bottle test was conducted in absence of food in the 2 h at the beginning of the dark period.
To generate the water- and Na-depleted condition, mice received subcutaneous injections of furosemide (a loop diuretic; 10 mg/25 g body weight) and were housed without food or water for 3 h. Mice were then housed with free access to the Na-deficient diet (CLEA Diet No. 010, Clea Japan) and distilled water for 24 h to generate the Na-depleted condition: Water intake during the first 6 h was measured. Mice were housed with free access to the normal diet without water for 48 h to generate the water-depleted condition.
22
Statistical analysis
Sample sizes were determined by power calculations using G*Power3.1 (Department of Experimental Psychology, Heinrich-Heine-University, Düsseldorf, Germany) to allow for robust statistical analyses of the data. For each analysis, sample size was determined using a Power > 0.8 and alpha error = 0.05. Values are means ± s.e.m. Statistical analyses were performed by two-sided Mann-Whitney tests or Pearson correlation analysis, using Kyplot (Kyence). Data distribution was assumed to be normal, but this was not formally tested.
Data collection and analysis.
Testing groups for behavioral cohorts were balanced by age and genotype, and randomization of experimental groups was not performed. Intake volumes were monitored automatically and analyses were not performed blind to the conditions of the experiments.
23
II.3 Results
Roles of AT1a signals in thirst and salt-appetite generation
I established water- and/or Na-depleted conditions in mice by dehydration, furosemide treatment, or a combination of furosemide treatment with water satiation, respectively. Firstly, in order to produce the water- and Na-depleted condition, WT mice were subcutaneously injected with furosemide, and then, they were depleted of water and Na in 3 h (Fig. II.1A). This treatment decreased blood [Na+] by ~5 mM, and increased Ang II levels ~3 fold after 3 h (Fig. II.1A). Secondly, to produce the Na-depleted condition without thirst, mice were allowed free access to water and the Na-deficient diet for 24 h after the furosemide injection (Fig. II.1B); during this period, intensive water intake for first 6 h, along with subsequent reduction afterward, were observed. After 24 h, blood [Na+] decreased below normal levels, whereas Ang II levels remained high (Fig. II.1B). Thirdly, to produce the water-depleted condition, WT mice were dehydrated for 2 days; blood [Na+] increased by ~15 mM and plasma Ang II levels increased ~4 fold (Fig. II.1C). Notably, the Ang II levels in blood increased to similar levels in all of the three conditions.
I then examined thirst and salt appetite responses of the mice under these conditions; mice were subjected to a two-bottle test in which they were offered water and 0.3 M NaCl in the absence of food (Fig. II.2). Firstly, the water- and Na-depleted mice consumed abundant volumes of water together with 0.3 M NaCl in 2 h (Fig. II.2A). Under the same condition, water intake by AT1a-KO mice was significantly less than, but still approximately half of, that by WT mice, indicating that water intake is at least in part AT1a-dependent (Fig. II.2A). In contrast, salt intake by AT1a-KO mice was almost negligible, indicating the critical role of AT1a signaling by Ang II in the
24
generation of salt-intake behavior under the water- and Na-depleted condition (Fig. II.2A). Secondly, under the Na-depleted condition, the induction of salt intake, but not water intake, was selectively observed in WT, whereas neither was induced in AT1a-KO mice (Fig. II.2B). This indicates again that salt intake is AT1a-dependent. Thirdly, under the water-depleted condition, WT mice consumed abundant volumes of water together with less amount of 0.3 M NaCl (Fig. II.2C): Salt intake was evidently less than water intake, reflecting “salt avoidance”, due to high [Na+] in body fluids by
dehydration. Under the same conditions, AT1a-KO mice consumed abundant volumes of water to the same level as WT mice, whereas the intake of 0.3 M NaCl was negligible, as was observed under the water- and Na-depleted, and Na-depleted conditions (Fig. II.2). These data suggest that salt intake is completely and water intake is partly AT1a-dependent.
Roles of AT1a neurons in the SFO and OVLT in thirst and salt appetite
I next explored the brain nuclei that are responsible for the generation of thirst and salt appetite mediated by the AT1a signaling. First, I examined the distribution of AT1a-positive neurons in the brain by immunostaining β-galactosidase in the AT1alacZ/+ mice. They were distributed in several brain nuclei, including the three sCVOs (Fig. II.3). The AT1a-positive neurons were successfully visualized together with their neurites by the immunohistochemistry.
The expression of Fos, a marker for neuronal activity, was almost negligible in AT1a-positive neurons in the AT1alacZ/+ mice under the normal water/salt-satiated condition (Fig. II.4A and II.5). Under the Na-depleted condition, in contrast, the number of Fos-positive neurons was significantly increased in the SFO and OVLT but
25
not in AP or PVN, and they were largely AT1a positive: SFO, 81.6 ± 2.9% AT1a-positive; OVLT, 65.1 ± 3.9% AT1a-positive (Fig. II.4A and Fig. II.5). Notably, Fos expression was not observed in these two loci in AT1a-KO mice under the same conditions (Fig. II.4B). Continuous intracerebroventricular infusion of losartan, an AT1 blocker, consistently caused a loss of Fos expression in the SFO and OVLT (Fig. II.6A), and abolished salt intake under the Na-depleted condition (Fig. II.6B).
Under the water-depleted condition, the number of Fos-positive neurons in the AT1alacZ/+ mice was further increased in the SFO and OVLT (Fig. II.4A) compared to what I observed under the Na-depleted condition, and the fractions of β-galactosidase-positive (namely, AT1a-positive) neurons in Fos-positive neurons were
49.7 ± 4.0% in the SFO and 32.7 ± 2.8% in the OVLT. Notably, in AT1a-KO mice under the same condition, a number of Fos-positive neurons were also observed in the SFO and OVLT (Fig. II.4B), but the fractions of AT1a-positive neurons were 27.4 ± 3.3% in the SFO and 19.6 ± 1.0% in the OVLT. This finding supports my observation that AT1a-KO mice indeed drank water after dehydration (Fig. II.2C). The difference in the neuronal activity between AT1alacZ/+ and AT1a-KO mice may therefore be attributable to the presence or absence of AT1a expression.
To achieve the site-specific deletion of the Agtr1a in the SFO or OVLT, an adeno-associated virus (AAV) carrying the gene encoding Cre-recombinase with a nuclear localization signal (NLS) (AAV-Cre) was injected into the respective brain nuclei of AT1aloxP/loxP mice (Fig. II.7A, D, and II.8): AT1aloxP/loxP mice (normal for AT1a expression) showed normal salt and water intakes under the Na-depleted condition (data not shown). The local deletion of the Agtr1a in the SFO and OVLT resulted in significant reductions in water intake after the furosemide injection (Fig. II.7B and E):
26
Here, WT mice injected with the same virus were used as the control mice to estimate the effects of the AAV-Cre injection itself.
When Agtr1a was deleted from the SFO [AT1aloxP/loxP-Cre (SFO)], I observed marked reductions in water and 0.3 M NaCl intake were observed in the two-bottle test (Fig. II.7C). A linear correlation was observed between reductions in 0.3 M NaCl intake and the number of Cre-positive cells in the SFO (Fig. II.7C); notably, in the most effective case, salt intake disappeared. In contrast, when Agtr1a was deleted from the OVLT [AT1aloxP/loxP-Cre (OVLT)], no effects were observed on 0.3 M NaCl intake (Fig. II.7F). These results indicate that the AT1a signals in the SFO are involved in both water and salt intake, whereas those in the OVLT are involved only in water intake.
27
II.4 Discussion
In this chapter, I established the three different body-fluid conditions followed by increases in plasma Ang II levels. The two-bottle tests of mice and Fos expression in the sCVOs under these conditions revealed that salt intake is completely and water intake is partially dependent on AT1a signals. Moreover, the local deletion of Agtr1a in the SFO and OVLT demonstrated that the AT1a signals in the SFO are involved in both thirst and salt appetite, whereas those in the OVLT are involved only in thirst.
Increases in plasma renin activity and Ang II in body fluids are caused by a deficiency in water and/or Na in the body (i.e. dehydration, hypovolemia, or hyponatremia) (Fitzsimons, 1998). The SFO has been reported to sense circulating Ang II to elicit water-drinking and salt-intake behaviors (Simpson and Routtenberg, 1973). The OVLT also has been reported to be involved in water-drinking behavior (McKinley and Johnson, 2004). An intravenous infusion of Ang II induces the expression of Fos in the SFO and OVLT neurons (McKinley, 1992), and AT1a was consistently expressed in the neurons of the SFO and OVLT (Fig. II.3). In this study, AT1a-KO mice showed reduction of salt and water intake induced by furosemide treatment (Fig. II.2A and B). Moreover, the Fos expression under the water-depleted and Na-depleted conditions were decreased in AT1a-positive neurons in the SFO and OVLT of AT1a-KO mice (Fig. II.4). These results demonstrate that AT1a signals in these nuclei are involved in thirst and salt appetite. Consistently, a lesion in the SFO caused decreases in Ang II-induced water drinking and salt intake in rat (Simpson and Routtenberg, 1975), and a lesion in the OVLT also attenuated osmotically-induced water drinking in dog (Thrasher et al., 1982).
28
AT1a neurons in the SFO play important roles in the water intake induced by furosemide treatment, because the deletions of the Agtr1a in the whole body (Fig. II.2A) and locally in the SFO (Fig. II.7B) both reduced water intake by half. It is possible to consider that the remaining half of the water intake is mediated by AT2 neurons, because AT2-KO mice showed a reduction in water intake induced by central injection of Ang II (Li et al., 2003). In contrast, the water intake by dehydration was not reduced in AT1a-KO mice at all (Fig. II.2C). In the water-depleted condition, AT1alacZ/+ and AT1alacZ/lacZ mice showed similar levels of Fos expression in the SFO and OVLT; however, the fraction of originally AT1a-positive neurons in the Fos-positive neurons in AT1a-KO mice was less than half of that in AT1alacZ/+ mice (Fig. II.4). These results may indicate that AT2-receptor dependent mechanism compensates the lack of the Agtr1a in AT1a-KO mice by unknown mechanisms, and the same level of water intake was observed as in WT mice under the dehydrated condition (Fig. II.2C). Besides the SFO, the OVLT has been reported to monitor the levels of Na+/osmolality and dipsogenic hormones in body fluids to evoke water-intake behaviors (Johnson, 2007). Consistently, deletions of the Agtr1a in the OVLT markedly reduced the furosemide-induced water intake (Fig. II.7E). In addition, prof. Noda’s laboratory recently found that Nax signals were also involved in the immediate induction of water intake evoked by an intracerebroventricular administration of a hypertonic NaCl solution (Sakuta et al., 2016); Here, Nax in the OVLT appears to mediate this function (unpublished observation in prof. Noda’s laboratory). Moreover, activation of OVLT neurons expressing vasopressin receptor 1a is reported to be involved in water intake to prevent anticipatory thirst during sleep period (Gizowski et al., 2016). These results
29
may imply that the OVLT have a functional role to regulate drinking behavior independently of the SFO.
In the present study, the genetic deletion of the Agtr1a in the SFO reduced water intake and abolished salt intake induced by the furosemide treatment (Fig. II.7A-C), indicating that the SFO is not a relay point but the principal site for sensing Ang II in blood. In line with this view, a research group recently reported that activation of excitatory neurons in the SFO induced both water and salt intake (Nation et al., 2016).
30
Figure II.1 Blood Na+ and plasma Ang II concentrations in WT mice under the water- and/or Na-depleted conditions.
(A) Experimental protocol to induce the water- and Na-depleted condition (W/Na-D). Blood Na+ and plasma Ang II concentrations in WT mice under the W/Na-D (left: n = 10 mice each; U(Na) = 100, P = 0.0001; right: n = 13 mice each; U(Ang II) = 5, P < 0.0001). (B) Experimental protocol to induce the Na-depleted condition (Na-D). Top: water intake during the first 6 h after furosemide injection (n = 10 mice each; U = 5.5, P = 0.0009). Bottom: blood Na+ and plasma Ang II concentrations in WT mice under the Na-D (left: n = 10 mice each; U(Na) = 100, P = 0.0001; right: n = 13 mice each; U(Ang II)
= 0, P < 0.0001). (C) Experimental protocol to induce the water-depleted condition (W-D). Blood Na+ and plasma Ang II concentrations in WT mice under the W-D (left: n
= 10 mice each; U(Na) = 0, P = 0.0002; right: n = 13 mice each; U(Ang II) = 0, P < 0.0001). bw, body weight; **P < 0.01; Mann-Whitney U-tests. Data show mean ± s.e.m.
31
Figure II.2 Water- and salt-intake behaviors of mice under the water- and/or Na-depleted conditions.
(A) Left: experimental protocol to induce the W/Na-D and subsequent two-bottle test. Middle and right: grayscale heat maps and summary of water and 0.3 M NaCl intakes by WT (n = 10 mice each; U(Water) = 0, P = 0.0001; U(NaCl) = 0, P = 0.0001) and AT1a-KO (n = 10 mice each; U(Water) = 87, P = 0.0058; U(NaCl) = 63.5, P = 0.3099) mice under the W/Na-D (WT vs. AT1a-KO, U(Water) = 91, P = 0.0022; U(NaCl) = 100, P = 0.0001). (B) Left: experimental protocol to induce the Na-D condition and subsequent
32
two-bottle test. Middle and right: grayscale heat maps and summary of water and 0.3 M NaCl intakes by WT (n = 10 mice each; U(Water) = 30.5, P = 0.1508; U(NaCl) = 0, P = 0.0002) and AT1a-KO (n = 10 mice each; U(Water) = 26, P = 0.0695; U(NaCl) = 49, P = 0.9696) mice under the Na-D (WT vs. AT1a-KO, U = 100, P = 0.0001). (C) Left: experimental protocol to induce the W-D and subsequent two-bottle test. Middle and right: grayscale heat maps and summary of water and 0.3 M NaCl intake by WT (n = 8 mice each; U(Water) = 0, P = 0.0009; U(NaCl) = 0, P = 0.0009) and AT1a-KO (n = 8 mice each; U(Water) = 0, P = 0.0009; U(NaCl) = 14, P = 0.0661) mice under the W-D (WT vs. AT1a-KO, U(Water) = 33, P = 0.9581; U(NaCl) = 57, P = 0.0100). bw, body weight; ns, not significant; *P < 0.05; **P < 0.01; Mann-Whitney U-tests. Data show mean ± s.e.m.
33
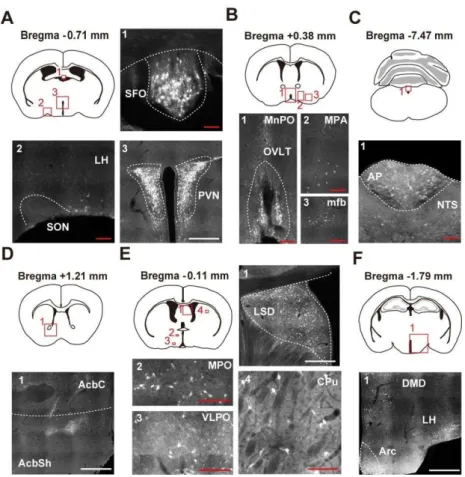
Figure II.3 Visualization of AT1a-positive cells using the AT1alacZ/+ mouse. (A–F) Immunohistochemical detection of β-gal in the mouse brain. Coronal sections at the respective anteroposterior positions from the bregma, -0.71 (A), +0.38 (B), -7.47 (C), +1.21 (D), -0.11 (E), and -1.79 (F) mm of AT1alacZ/+ mice. AcbC, core region of the accumbens nucleus; AcbSh, shell region of the accumbens nucleus; Arc, arcuate hypothalamic nucleus; CPu, caudate putamen; DMD, dorsal part of the dorsomedial hypothalamic nucleus; LH, lateral hypothalamic area; LSD, dorsal part of the lateral septal nucleus; mfb, medial forebrain bundle; MnPO, median preoptic nucleus; MPA, medial preoptic area; MPO, medial preoptic nucleus; NTS, nucleus of the solitary tract; PVN, paraventricular nucleus; SON, supraoptic nucleus; VLPO, ventrolateral preoptic nucleus. Scale bars; 50 µm (red), 250 µm (white).
34
Figure II.4 Fos expression in the AT1a-positive neurons of the SFO and OVLT under the Na-depleted and water-depleted condtions.
(A) Top, left: schematic drawings of mouse coronal brain sections indicating the SFO and OVLT. Top, right: immunohistochemical detection of β-galactosidase (β-gal) and Fos in AT1alacZ/+ mice under the Na-depleted and water-depleted conditions. Bottom: summary of Fos-positive cell counts in the respective brain regions (n = 5 mice for each; control vs. Na-depleted, U(SFO) = 0, P = 0.0090; U(OVLT) = 0, P = 0.0090; Na-depleted vs. water-depleted, U(SFO) = 0, P = 0.0090; U(OVLT) = 24, P = 0.0216). (B) Top: immunohistochemical detection of β-gal and Fos in AT1a-KO mice under the Na-depleted and water-depleted conditions. Bottom: summary of Fos-positive cell counts in AT1a-KO mice in the respective brain regions (n = 5 mice for each; control vs. Na-depleted, U(SFO) = 4, P = 0.0946; U(OVLT) = 10, P = 0.6761; Na-depleted vs. water-depleted, U(SFO) = 0, P = 0.0090; U(OVLT) = 0, P = 0.0090). Scale bars, 50 µm. ns, not significant; *P < 0.05; **P < 0.01; Mann-Whitney U-tests. Data show mean ± s.e.m.
35
Figure II.5 AT1a-positive neurons in the AP and PVN are not activated under the Na-depleted condition.
Left: immunohistochemical detection of Fos in the AP and PVN of AT1alacZ/+ mice under the Na-depleted condition. Right: summary of Fos-positive cell counts in respective brain regions (n = 5 mice each, U(AP) = 6, P = 0.2100; U(PVN) = 16, P = 0.5308). Scale bars, 50 µm. ns, not significant; Mann-Whitney U-tests. Data show mean ± s.e.m.
36
Figure II.6 Inhibition of AT1 signaling in the brain.
(A) Left: Effects of the continuous intracerebroventricular infusion of losartan (10 μg/h) on immunohistochemical detection of Fos in the SFO and OVLT under the Na-depleted condition. Right: summary of Fos-positive cell counts in these brain loci (n = 5 mice each; U(SFO) = 25, P= 0.0090; U(OVLT) = 25, P = 0.0090). (B) Water and 0.3 M NaCl intake by WT mice under the Na-depleted condition (n = 6 mice for vehicle, n = 8 mice for losartan; U(Water) = 38, P = 0.0810; U(NaCl) = 48, P = 0.0024). Scale bars, 50 µm. bw, body weight; ns, not significant; **P < 0.01; Mann-Whitney U-tests. Data show mean
± s.e.m.
37
Figure II.7 AT1a in the SFO is involved in thirst and salt appetite, whereas that in the OVLT is only involved in thirst.
(A) Top: injection of AAV-Cre into the SFO of AT1aloxP/loxP mice. Bottom: immunohistochemical detection of Cre in the SFO. (B) Water intake during the first 6 h after the furosemide injection (n = 9 mice each; U = 75, P = 0.0027). (C) Left: grayscale heat maps of water and 0.3 M NaCl intakes in the two-bottle test by individual mice under the Na-depleted condition. Middle: summary of intake volumes (n = 9 mice each; U(Water) = 65, P = 0.0341; U(NaCl) = 78, P = 0.0011); data are from the mice used in B. Right: the relationship between the number of Cre-positive cells in the SFO and 0.3 M NaCl intake (n = 13 mice each; r(WT) = –0.0085, P = 0.9780; r(loxP-flanked Agtr1a) = –0.8015, P = 0.0009; Pearson correlation analysis). Linear regression lines are
38
shown in black (WT) and red (AT1aloxP/loxP). (D) Top: injection of AAV-Cre into the OVLT of AT1aloxP/loxP mice. Bottom: immunohistochemical detection of Cre in the OVLT. (E) Water intake during the first 6 h after the furosemide injection (n = 8 mice each; U = 59, P = 0.0054). (F) Left: grayscale heat maps of the two-bottle test under the Na-depleted condition. Middle: summary of intake volumes (n = 8 mice each; U(Water) = 34, P = 0.8748; U(NaCl) = 27.5, P = 0.6742); data are from the mice used in E. Right: the relationship between the number of Cre-positive cells in the OVLT and 0.3 M NaCl intake (n = 11 mice each; r(WT) = –0.5188, P = 0.1019; r(loxP-flanked Agtr1a) = –0.2685, P = 0.4247; Pearson correlation analysis). Colors of linear regression lines are the same colors as in C. For the statistical analysis in C and F, mice in which more than 500 Cre-positive cells were detected per mm2 in the SFO, were used. Scale bars, 50 µm. bw, body weight; ns, not significant; *P < 0.05; **P < 0.01; all tests are Mann-Whitney U-test unless otherwise stated. Data show mean ± s.e.m.
39
Figure II.8 The local deletion of Agtr1a in the SFO of AT1aloxP/loxP mouse
Immunohistochemical detection of Cre and in situ hybridization of AT1a mRNA in the SFO of AT1aloxP/loxP mouse with (AAV-Cre) or without (Control) AAV-Cre virus injection. Scale bar, 50 µm. Expression of AT1a proteins was markedly reduced by Cre recombinase.
40
Chapter III
Distinct neural pathways
for the control of thirst and salt appetite
in the subfornical organ
41
III.1 Introduction
The SFO has been reported to be involved in water- and salt-intake behaviors by focal electrolytic lesions (Simpson and Routtenberg, 1975; Thunhorst et al, 1999). Recent studies showed that neural nitric oxide synthase (nNOS)-positive neurons in the SFO are overlapped with calcium/calmodulin-dependent protein kinase II (CamKII)-positive excitatory neurons, and optical excitation of these neurons evoked drinking behaviors (Oka et al, 2015). These studies suggest that the excitatory neurons in the SFO include subsets of neurons for the control of thirst and/or salt appetite; however it is not known whether they express AT1a.
Previous studies indicated that the SFO is constituted by multiple neuronal populations projecting to multiple brain nuclei including the OVLT, ventral part of the bed nucleus of the stria terminalis (vBNST), MnPO, SON, and PVN (Mckinley et al, 2003; Johnson 2007). In the OVLT, there exist some neurons that respond to an increase of osmolality (Ciura and Bourque, 2006), suggesting a role of the OVLT in thirst responses. The BNST is a part of the extended amygdala, which is implicated in emotional behaviors such as anxiety and reward (Stamatakis et al, 2014). Electrolytic destructions of the BNST cause reductions in salt appetite (Reilly et al., 1994), and retrogradely labeled SFO neurons from the BNST are activated by the circulating Ang II in rats (Sunn et al., 2003).
In this chapter, I used a retrograde-transporting virus to label specific neuronal projection by the reporter gene expression. I also used optogenetics, techniques to manipulate the excitability of specific neurons, in that light-sensitive channels or pumps are exogenously expressed. Combination of these two approaches enabled me to
42
examine the functional roles of the SFO neurons projecting to the OVLT and vBNST in thirst and salt appetite generations.
43
III.2 Materials and Methods
Experimental animals
In addition to the mice as described in chapter II, Slc17a6-ires-Cre (Vglut2-Cre) (Vong et al., 2011) (Jackson Labs stock 016963), Gad1-GFP (Δneo) (GAD67-GFP) (Tamamaki et al., 2003), and Slc32a1-ires-Cre (Vgat-Cre) (Vong et al., 2011) (Jackson Labs stock 016962) mice were used. In some optogenetic experiments, multiple behavioral tests were conducted in the same group of mice.
Reagents
In addition to the reagents as described in chapter II, tetramethylrhodamine-conjugated dextran (M.W. 3000) (D-3308, Life Technologies), and Alexa555-conjugated cholera toxin subunit b (CTb-555) (C-34776, Life Technologies) were used.
Immunohistochemistry
In addition to the antibody as described in chapter II, the primary antibodies used in this chapter were as follows: rat anti-GFP (1:1,000, 04404-84, Nacalai Tesque), rabbit anti-RFP (1:500, 600-401-379, Rockland), and goat anti-nNOS (1:1000, ab1376, abcam) antibodies.
In situ hybridization
Mice were perfused transcardially with PBS followed by fixation with 4% paraformaldehyde in PBS. After the immunohistochemical staining with anti-Cre antibody as described above, the free-floating sections were rinsed with PBS and then digested with proteinase K (0.5 mg/mL in 0.1 M Tris-HCl buffer, pH 8.0, containing 0.05 M EDTA) for 10 min at room temperature (20–25 ℃). Digestion was stopped
44
with a solution containing 0.25% acetic anhydride in 0.1 M triethanolamine containing 0.3% Triton X-100 for 15 min. After a wash with saline sodium citrate (SSC) and prehybridization in a hybridization buffer (5XSSC, 2% blocking reagent (Roche), 50% formamide, and 0.1% N-lauroylsarcosine) without probe at 60°C for 1 h, the sections were hybridized with the digoxigenin-labeled RNA probes for AT1a in the hybridization buffer at 60°C for more than 16 h. The template used for the probe preparation was the 757-bp fragment of mouse Agtr1a (nucleotide residues 1,485–2,242; GenBank accession number NM_177322). The sections were then washed and incubated with peroxidase-conjugated sheep anti-digoxigenin antibody (1:5000, 11-207-733-910, Roche) at 4°C for 16 h. Bound anti-digoxigenin antibodies were detected with TSA-Plus Fluorescein System (NEL741, Perkin Elmer) according to the manufacturer’s protocol.
Recombinant Viral Vectors
In addition to the virus as described in chapter II, a highly efficient retrograde gene-transfer lentivirus (HiRet)(Kato et al., 2011), a pseudotyped lentiviral vectors with the rabies virus glycoprotein, (> 1.0 × 10¹⁰ Genomic Copies /ml) was used for gene transfer in vivo. HiRet-MSCV-NLS-Cre-WPRE was used for the expression of Cre recombinase. AAVDJ-CAGGS-DIO-EGFP and HiRet-MSCV-EGFP-WPRE were used for the expression of EGFP. HiRet-MSCV-mCherry-WPRE was used for the expression of mCherry. AAVDJ-CAGGS-DIO-ChR2(H134R)-EGFP, HiRet-MSCV-ArchT-GFP-WPRE, and HiRet-MSCV-DIO-ChR2(H134R)-EGFP-WPRE were used for the optical manipulation. FCK-ArchT-GFP, which was used to construct the virus vector, was a gift from Dr. Edward Boyden (Cambridge University, USA)
45
(Addgene plasmid # 31177) (Han et al., 2011). DIO, double-floxed inverted orientation; MSCV, murine stem cell virus promoter; WPRE, Woodchuck hepatitis virus response element.
Surgery
Viruses or tracer dyes were injected with a micro syringe pump (AAV, 0.1 µ L/min for 5 min; HiRet, 0.1 µL/min for 10 min) or by iontophoresis (7 µA, 7-sec on/off positive pulses for 15 min). In addition to the injection sites as described in chapter II, following the coordinates relative to the bregma were used for the viral injection: the vBNST (anteroposterior, +0.3 mm; lateral, ±1.0 mm; ventral, +4.6 mm), PVN (anteroposterior, -0.7 mm; lateral, ±0.3 mm; ventral, +4.9 mm), and SON (anteroposterior, -0.7 mm; lateral, ±1.2 mm; ventral, +5.5 mm).
Immunohistochemical experiments were performed more than 1 week after the virus injection, while behavioral experiments were conducted after more than 4 weeks. Mice used for optogenetic experiments were surgically implanted with stainless steel cannulas (C311G, Plastics One) targeting the SFO or OVLT more than 3 weeks after the virus injection; the cannula was fixed to the skull with two screws and dental acrylic. All stereotaxic injection sites were verified by immunohistochemistry after behavioral tests. When the virus infection or tracer injection to the target site turned out to be unsuccessful, behavioral data obtained from such individuals were excluded from the analyses.
For labeling with dyes, tetramethylrhodamine-conjugated dextran (3000 M.W., 5% in PBS) or Alexa555-conjugated cholera toxin subunit b (CTb-555, 1.0 µg/µ L in PBS) was injected into the SFO or vBNST (unilaterally), as described above. The time from
46
the injection to fixation was 3 d for dextran and 7 d for CTb-555.
To induce electrolytic lesions, a tungsten monopolar electrode (80–100 kOhm
resistance and tip diameter of ~5 μm; Unique Medical) was inserted into the vBNST. A positive current (0.5 mA) was passed for 20 s from a current source (53500, Ugo Basile). After the completion of surgery, animals were allowed to recover for more than 7 d. Brains were sectioned at a thickness of 300 µm after the behavioral experiments and images were obtained using a microscope (Biozero, Keyence) with the 2× objective to validate the lesions.
Behavioral Assays
For in vivo photoillumination of freely moving mice, laser light was delivered through plastic optic fibers with an optical swivel (COME2-UFC, Lucir), which was connected to a yellow light laser (577 nm, 3000 mW, CW) (Genesis Taipan 577, Coherent) or blue light laser (445 nm, 1000 mW, CW) (KaLaser). To achieve the optical inhibition with ArchT, the laser output was maintained at 7–10 mW/mm2 as measured at the tip of the fiber. The laser output (20 Hz; 25 msec light ON duration) for optical activation of ChR2 was maintained at 5–10 mW/mm2 as measured at the tip of the fiber. The
optical power of blue and yellow lights in the SFO and OVLT was estimated using the online brain tissue light transmission calculator available at http://web.stanford.edu/group/dlab/optogenetics/. In my experiments, the distance from the optical fiber tip to the target tissue was set at 200–500 μm, and the expected
optical power was 1.20–3.64 mW/mm2.
In the test under the euhydrated condition, optical stimulation was delivered for 10 min, starting 10 min after the start of the two-bottle test. In each test under the water-
47
and/or Na-depleted conditions, the optical stimulation was started 5 min before the start of the two-bottle test. Optical excitation and silencing were observed in cell-attached recordings of action potential firing in ChR2- and ArchT-positive SFO cells. After optical excitation of axon fibers, intensive Fos expression was observed at the target nucleus, indicating that optical excitation successfully evoked synaptic transmission and activated neurons in the target nucleus. I also confirmed that Fos expression was not observed in the ArchT-GFP-expressing neurons after optical silencing, though Fos expression was observed in GFP-expressing neurons under the Na-depleted condition.
48
III.3 Results
SFO→OVLT pathway controls water intake
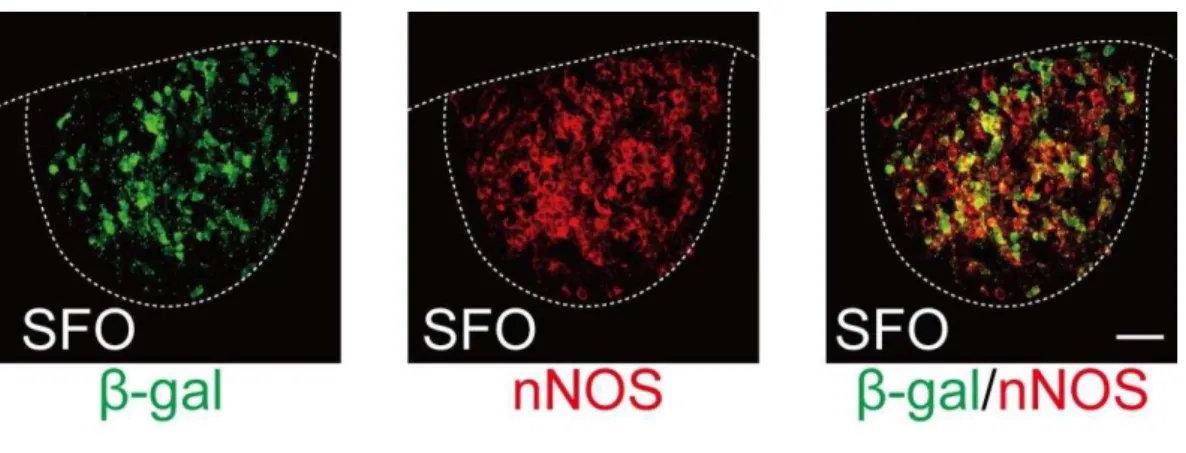
To identify the neuronal types of AT1a-expressing cells in the SFO, I generated Vglut2-Cre;AT1alacZ/+ (Fig. III.1A) and GAD67-GFP;AT1alacZ/+ (Fig. III.1B) mice by crossing the AT1alacZ/+ mouse with the vesicular glutamate transporter 2 (Vglut2; its gene is Slc17a6)-Cre mouse or with glutamic acid decarboxylase 67 (GAD67; Gad1)-green fluorescent protein (GFP) mouse (GAD67GFP/+), respectively. In Vglut2-Cre;AT1alacZ/+ mice that received an injection of the AAV carrying the double-loxP-flanked inverted orientation (DIO)-EGFP into the SFO (n = 4 mice), β-galactosidase signals largely overlapped with EGFP in glutamatergic neurons (Fig. III.1A): over 80% of neurons showed EGFP–β-galactosidase overlap, depending on the
infection rate. Notably, most though not all AT1a-positive neurons expressed nNOS, a marker of excitatory neurons in the SFO (Oka et al., 2015): 75.7 ± 2.9% (n = 5 mice) of the AT1a neurons were nNOS-positive (Fig. III.2). On the other hand, AT1a-positive neurons did not overlap with GFP in GAD67-GFP;AT1alacZ/+ mice (Fig. III.1B). These results indicate that AT1a neurons in the SFO are glutamatergic (excitatory) but not GABAergic (inhibitory) neurons.
I then examined the projection targets of glutamatergic SFO neurons by injecting the AAV carrying DIO-EGFP into the SFO of Vglut2-Cre mice (Fig. III.3A). This revealed that glutamatergic SFO neurons had projections to the OVLT, MnPO, vBNST, PVN, and SON (Fig. III.3A). I confirmed these results by using the highly efficient retrograde gene transfer lentiviral vector (HiRet; Kato et al., 2011) carrying the EGFP (Fig. III.3B–E). The OVLT received intensive neural connections from AT1a-positive SFO neurons: 56.8 ± 3.9% (n = 4 mice) of the SFO neurons projecting to the OVLT
49
[hereafter referred to as SFO(→OVLT) neurons] were AT1a-positive (Fig. III.4A). On the other hand, when the targets of GABAergic neurons were examined using vesicular GABA transporter (Vgat; Slc32a1)-Cre mice as the recipient, a small number of fibers were detected in the OVLT and MnPO; however, no fibers were observed in the vBNST, PVN, or SON (Fig. III.3F). These results were reproduced by injecting the anterograde tracer, tetramethylrhodamine-conjugated dextran (TRITC-Dextran), into the SFO (Fig. III.3G).
Fos-positive neurons under the water-depleted condition overlapped well with the SFO neurons that were retrogradely labeled from the OVLT: 52.0 ± 4.6% (n = 4 mice) of the SFO(→OVLT) neurons were Fos-positive (Fig. III.4B). Therefore, I presumed that the SFO→OVLT neural pathway controlled thirst responses under dehydration. I optically silenced the SFO(→OVLT) neurons using archearhodopsin 3 (ArchT), a
yellow-light drivable proton pump (Fig. III.5). The HiRet lentiviral vector carrying ArchT-GFP was injected into the OVLT of WT mice, and the cell bodies of SFO neurons with ArchT-GFP was exposed to yellow light under awake and free-moving conditions (Fig. III.6A). In the absence of the light, mice typically showed enhanced water intake under the water-depleted condition (Fig. III.6B). However, the optical silencing of SFO neurons significantly reduced water intake (Fig. III.6B). I confirmed that furosemide-induced water intake was AT1a-dependent (Fig. III.7A) and that this water intake was also reduced by the specific deletion of the Agtr1a (Fig. III.7B) and the optical silencing of the SFO→OVLT pathway (Fig. III.7C). In contrast to water intake, salt intake under the Na-depleted condition was not affected by the optical silencing of the same pathway (Fig. III.8).
I next investigated the effects of the optical excitation of the SFO→OVLT pathway
50
on the water- and salt-intake behaviors using channelrhodopsin 2 (ChR2), a blue-light gated cation channel. In these experiments, an AAV carrying DIO-ChR2-EGFP was injected into the SFO of Vglut2-Cre mice, and the axon fibers innervating the OVLT were optically stimulated (Fig. III.5, III.9A, and III.10). Here the optical stimulation induced rapid water-intake behavior in mice in the two-bottle test under the normal water-satiated condition (Fig. III.9B). The termination of water intake within several minutes is presumably due to feedback neural suppression from the oropharynx and/or hepatic portal vein(Stricker and Sved, 2000). When light stimulation was terminated shortly after the initiation of drinking, most mice immediately stopped drinking and left the spout (data not shown), indicating that the neural stimulation is directly related to the drinking behavior (or drives the recognition of thirst). In contrast, 0.3 M NaCl intake was not affected by the optical excitation of the SFO→OVLT pathway (Fig.
III.9B). Together, these data indicate that the SFO→OVLT pathway mediates thirst control but not salt-appetite control.
SFO→vBNST pathway controls salt appetite
Some glutamatergic SFO neurons projected to the vBNST as described above (Fig. III.3A). They specifically projected to the ventral but not dorsal part of the BNST (Fig. III.11). Dual injection of HiRet-EGFP and HiRet-mCherry to the OVLT and vBNST, respectively, revealed that the two neuronal populations projecting to the vBNST (hereafter refered to as SFO(→vBNST) neurons) and OVLT (SFO(→OVLT) neurons) had an intermingled distribution in the SFO (Fig. III.12). When I injected a retrograde tracer, Alexa555-conjugated cholera toxin subunit b (CTb-555), into the vBNST of the AT1alacZ/+ mouse (Fig. III.13), most of the CTb-555-positive neurons in the SFO were