sustainability
ISSN 2071-1050 www.mdpi.com/journal/sustainability ArticleAssessing Heat Health Risk for Sustainability
in Beijing’s Urban Heat Island
Weihua Dong 1,*, Zhao Liu 1,2, Lijie Zhang 1, Qiuhong Tang 3, Hua Liao 1 and Xian’en Li 1
1 State Key Laboratory of Remote Sensing Science, Beijing Key Laboratory for Remote Sensing of Environment and Digital Cities & School of Geography, Beijing Normal University,
Beijing 100875, China; E-Mails: [email protected] (Z.L.); [email protected] (L.Z.); [email protected] (H.L.); [email protected] (X.L.)
2 The State Key Laboratory of Earth Surface Processes and Resource Ecology, Beijing Normal University, Beijing 100875, China
3 Institute of Geographic Sciences and Natural Resources Research, Chinese Academy of Sciences, Beijing 100875, China; E-Mail: [email protected]
* Author to whom correspondence should be addressed; E-Mail: [email protected]; Tel./Fax: +86-10-5880-9246.
External Editors: Yuejing Ge and Shangyi Zhou
Received: 15 June 2014; in revised form: 11 October 2014 / Accepted: 16 October 2014 / Published: 23 October 2014
health risk assessment. We recommend that policy makers should develop efficient urban planning to accomplish Beijing’s sustainable development.
Keywords: land use/cover; social vulnerability; UHI; health risk assessment; sustainability
1. Introduction
The past decades have been marked by an increasing number of deaths caused by extreme high summer temperatures resulting from global warming trends [1]. Numerous publications have documented the threat of heat waves. Robine et al. reported that there were more than 70,000 deaths across Europe due to heat waves during the summer of 2003 [2]. Other recent heat extremes have also occurred in many countries such as the USA, China and Russia [3–5]. High temperatures can cause physical discomfort and induce certain diseases and death both directly and indirectly. Typical direct heat-related diseases such as skin rashes, heat exhaustion, heat cramps, heat syncope and heat stroke [6–8] could lead to immediate deaths if not treated in a timely manner. Studies also suggested that high temperatures could increase the morbidity and mortality of cardiovascular, respiratory, circulatory, renal, and nervous system diseases [9–13].
According to the statistical data from the Emergency Events Database (EM-DAT [14]), 3100 people died, while 159,118 people were affected by heat waves each year between 1980 and 2008 on average. The top three extreme heat events reported in this database happened in Europe in 2003: Italy (20,089 deaths), France (19,490 deaths) and Spain (15,090 deaths). Despite the severe heat waves that happened in Europe in 2003, there were many other historically significant heat waves. For example, over 55,730 people died during the 2010 Russian heat wave [15]; 374 excess deaths occurred in Melbourne, Australia from January to February in 2009 [16]; at least 700 heat-related deaths happened in Chicago in July 1995 [3].
Heat waves are more severe and are characterized by a higher intensity, higher frequency and longer duration in cities [17] because of the urban heat island (UHI) effect, which is known as a warmer urban area than its surrounding rural areas due to replacing the natural land with impervious surfaces through the process of urbanization [18]. An increasing number of people living in cities are threatened by a higher risk level of extreme high temperature events [19].
waves [26]. Normalized difference vegetation index (NDVI), vegetation and water fractions were all negatively correlated with the land surface temperature (LST) [27]. With the urban modification to the natural land use/cover, the ambient air temperature in the urban area increases significantly in contrast with that in the suburbs. Simultaneously, the heat-related morbidity and mortality are usually higher in central cities than in their surroundings [28].
Meanwhile, the borderland between urban and rural area, which is called rural-urban fringe zone, also need to pay more attention. The heat health risk of the borderland is higher than the rural area and lower than the urban area. While in the hotter years, the risk in borderland area grows faster than the urban and rural area, because these areas have higher population density and higher impervious area ratio than the rural area, higher immigrant population density, lower income and lower awareness of heat wave prevention than the urban area.
Ecosystems can make important contributions to mitigate the impact of heat waves [29]. For example, a park could be 0.94 °C cooler than the surroundings in the day on average [30]. On average, an urban green area is 1–2 °C cooler than the non-vegetated zones [30,31]. From experience, as a rule, a 10% increase in the ratio of green area in a city is expected to bring a 0.8 °C reduction in the ambient air temperature [32]. Many studies have reported on the quantitative relationships of land use/cover and temperature. For instance, Burkhard et al. [33] and Gong et al. [34] analyzed the relationship between the UHI and land use/cover types using remote sensing data and geographic information system (GIS) technology. These studies provided references to measure the impact of land use/cover on the heat health risk.
Assessing the heat health risk is of vital importance not only to educate people on self-protection but also to support government’s policy-making. This paper aimed to integrate the UHI effect into a heat health risk assessment methodology and assess heat health risk at the sub-district level to help policy makers make wiser decisions in urban planning and disaster prevention. To make this method easily transferable to any urban area exposed to heat waves in China, we studied Beijing as a sample and relied upon meteorological data and national census data.
2. Methods
2.1. Study Area
to CY District. From the view of social factors, such as economy and population, it is more developed than its surrounding sub-districts in SY District. Although the Capital Airport Sub-district is located inside the SY District geographically, it belongs CY District essentially. Therefore, this sub-district belongs to the borderland area and is excluded from rural area.
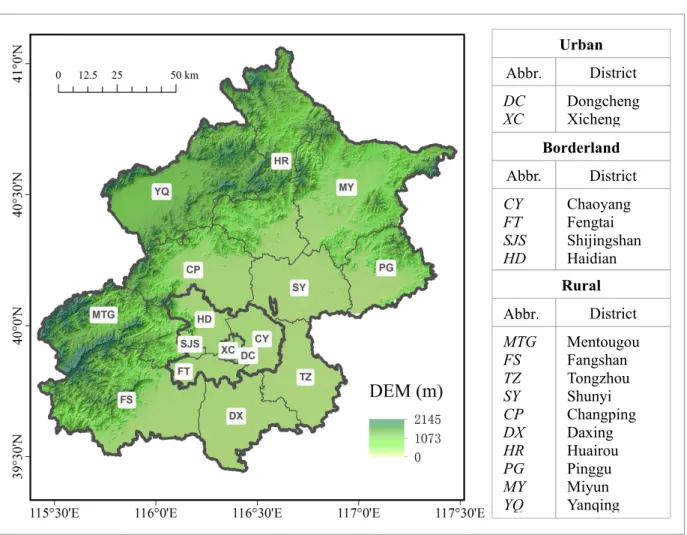
The lowest level of Beijing’s census is sub-district in the urban and borderland area and township in the rural area. Beijing is divided into 136 sub-districts (urban and borderland), 180 townships (rural) and 3 development zones. Sub-district and township are the lowest administrative unit used in this paper and collectively called as the sub-district. This level is equivalent to census block groups in western countries. In this paper, the district-level analysis is used to study the difference of heat health risk between urban, borderland and rural area. While the sub-district level analysis is to specifically study the risk distribution, the effect of different land use/cover and the relationship between different vulnerability and environment factors in the urban borderland area.
Figure 1. Districts and DEM in Beijing.
Note: Abbr.: Abbreviation.
2.2. Hazard
There is no universal definition of a heat wave, but a critical temperature combined with a lag of time is a common way to define a heat wave [6,40]. The World Meteorological Organization (WMO [41]) defines a heat wave as a period in which the daily maximum temperature is higher than 32 °C for more
Abbr. District DC XC Dongcheng Xicheng MTG FS TZ SY CP DX HR PG MY YQ Mentougou Fangshan Tongzhou Shunyi Changping Daxing Huairou Pinggu Miyun Yanqing Urban
Abbr. District Rural Abbr. District
than three continuous days; Netherlands defines a heat wave as a period in which the daily maximum temperature exceeds 25 °C for more than five days, provided that at least three days in this period the maximum temperature exceeds 30 °C [42]. The China Meteorological Administration (CMA [43]) adopts a daily maximum temperature above 35 °C as the criterion for high temperature weather, and high temperatures that last for more than 3 days are defined as a heat wave.
Exposure to extremely high temperatures may cause severe heat stroke and even death in hours [44]. Therefore, extremely high temperature days need to be considered as one of the hazard factors. Furthermore, continuous days of high temperature weather, i.e., heat waves, could lead to disease aggravation and deaths. Thus, a heat wave is another hazard factor. Based on the above considerations, we adopted a combined definition of heat wave day and high temperature day from the WMO and CMA in this study. The heat wave days refer to the days when the daily maximum temperature exceeds 32 °C for at least three continuous days, and the extremely high temperature days refers to the days when the daily maximum temperature exceeds 35 °C.
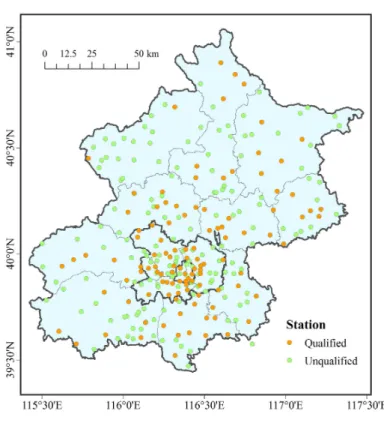
The daily temperature data of 280 weather stations in Beijing during 2008–2011 were provided by the Beijing Meteorological Bureau. As this study needs to count the days of heat wave and extreme high temperature, we have to guarantee that the valid data of each station is over 360 days each year. The stations with missing data or with low quality data were removed and 113 stations that passed quality control were used in this study. Most of the qualified stations are located in the urban districts and most of the unqualified stations are located in the suburbs (see Figure 2). One reason for this phenomenon was that the total area of suburbs is much larger than the urban area, so the total number of stations is greater than in the urban area. Another reason was that the meteorological stations in the urban area were better preserved, thus the quality of these data was higher than that in the suburbs. The daily temperature data were interpolated to the study area using the radial interpolation algorithm. The extremely high temperature days and heat wave days in each year during 2008–2011 were calculated based on the interpolated data. The hazard index was calculated:
(1) where DH is the number of heat wave days in a year and DE is the number of extremely high temperature
days in a year, and the hazard index is the average value of them. It should be noted that there might be some overlap but not all days overlap. This is because we focus the two aspects of the heat hazard. One is the duration of the hazard as represented in DH (consecutive days which daily maximum temperature
exceeds 32 °C). And the other is the intensity of the hazard as represented in DE (the number of extremely
high temperature days which the daily maximum temperature exceeds 35 °C). We could imagine that the consequence would be much severer if one day’s maximum temperature exceeds 35 °C and lasts for a long duration. Therefore, although there may be overlap days, it indicates a condition of longer lasting and higher intensity of the heat hazard and would result in more serious consequences. So we argue that this overlap is reasonable for heat hazard measurement in the present study.
2 D D
Figure 2. Distribution of meteorological stations.
2.3. Vulnerability
When the people are exposed to the heat hazard, there will be risk. The vulnerability of population is estimated using Beijing’s census data in this study, which varies with population characteristics such as age, population density, physical conditions, behavioral factors, living environment and socio-economic factors [6,29,45–47]. Many studies have shown that high population density may be considered the initial vulnerable reason for heat health risk [48–50]. Furthermore, some studies suggest that high population density implies high temperature and consequently higher risk [22], which is because increasing population density could lead to higher temperatures from an anthropogenic heat release [51]. These suggest that people living in high population density areas are likely more vulnerable to heat health risk. The elderly are more vulnerable to heat waves because of the intrinsic weakness in their regulatory systems and there is a higher proportion of illness or disability among the elderly [6]. High temperatures were observed to be correlated with the mortality from some diseases among the elderly, such as coronary artery disease and cerebral infarction [52,53]. Because the ability of thermoregulation typically decreases with age, the reduced thermoregulatory capacity leads to increased mortality and morbidity in the elderly [54]. In summary, the elderly have a lower affordability for heat waves and a higher risk of dying in heat waves; therefore, the elderly are usually considered to be a vulnerable group in many studies [46,55,56]. The aged people usually are divided into three stages: <65 years old, 65 to 74 years old and ≥75 years old in the studies on heat risk and the mortality model [57].
information [47]. People living in poor areas are less adaptable and have a higher risk of succumbing to heat waves [46,47,60,61].
From the above, the vulnerability index was estimated using three social sub-indicators: population density, aged ratio and income level. The area, total population, and population over 65 years old for each sub-district and the average income of each district in Beijing were obtained from the census data released by China's National Bureau of Statistics in 2010. The vulnerability index is the equal-weighted linear sum of the three sub-indicators following Tomlinson’s study [45]:
(2) where P stands for the population density, A refers to the aged population ratio and I is the income level. All the three sub-indicators are normalized to 0–1 using linear normalization algorithm before calculating the sum.
2.4. Environment
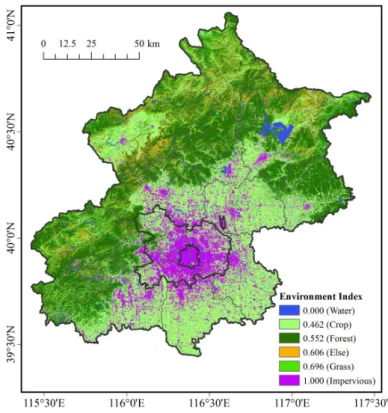
The land use/cover data were obtained from the Center For Earth System Science (CESS [62]) at Tsinghua University [63]. The original data of land use/cover was observed in the summer and autumn. Most of the city center and northern suburbs were observed at 5 June 2010, whereas the rest areas were observed at August and September. As heat waves primarily happen in summer, there is no mismatch phenomenon in this study. The land use/cover data were reclassified into six land use/cover classes by the CESS: crop, forest, grassland, impervious, water and other. Using remote sensing data and GIS technology, Gong et al. [34] analyzed the relationship between the UHI effect and land use/cover types using the retrieval land surface temperature data from the TM infrared remote sensing data and acquired the average temperature for each land use/cover type in Beijing. The environment index over the impervious, grassland, forest, crop, water and other types was set as 1.000, 0.696, 0.552, 0.461, 0.000, and 0.606 respectively according to the linearly normalized temperature in Gong et al. [34].
2.5. Spatial Heat Health Risk Assessment
Geographical information system (GIS) is widely used in branches of Geography, such as Physical Geography, Human Geography, Atmospheric science and Hydrology by providing researchers with knowledge, mechanism and applications. The spatial risk assessment of natural disasters is a growing field for GIS including floods [64], droughts [65], hurricanes [66], geological hazards [67] and providing real-time disaster decision supports for policy makers [68]. Spatial analyze methods are widely used in analyzing and assessing the risk from disasters.
Winser et al. [47] systematically summarized the relationship between regional resources development and natural disasters from three aspects: hazard-formative factors, environmental stability, and a hazard-affected body. Because of this relationship, we further improved the risk model based on the improvement of Tomlinson et al. [45] upon the risk framework developed by Crichton [69]. In Crichton’s framework, risk is described as a function of hazard, exposure and vulnerability. A hazard factor is usually expressed by the high temperature or heat wave days using remote sensing data [45,70] or meteorological station data [9,46,57,71], whereas the vulnerability factor is evaluated with various data [28] such as population density, age, illness, economic status, social isolation index, education levels
I)/3 A P
and other sub-factors [45,46]. In addition to these two factors, we introduced land use/cover data as the third factor to characterize the impact from the environment.
Former studies of heat health risk mainly considered land use/cover as a sub-factor of vulnerability. For example, green space was used to indicate land use/cover as a vulnerability factor along with other social factors [72]. Burkhard [33] utilized remote sensing data and analyzed the temperature variation above different types of land use/cover. Based on this research, Depietri [29] considered the land use/cover as a part of the vulnerability of heat waves and determined the vulnerability spatial patterns of the Cologne urban area. Because the resolution of meteorological data is often very low, the usage of land use/cover data can improve the accuracy of the urban heat health risk distribution calculated from meteorological data.
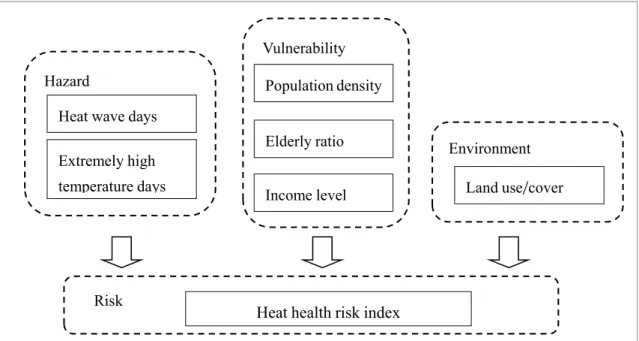
In this study, the factors from three aspects, i.e., hazard, vulnerability, and the environment, are all taken into account for the heat health risk assessment. Different from Tomlinson’s study, we adopted the risk equation of Risk = Hazard × Vulnerability from the United Nations Disaster Relief Coordinator [73] and multiplied environmental factor behind. The assessment method is shown in the following equation and Figure 3.
(3) where R refers to the final heat health risk index, H is the hazard index, V is the vulnerability index and E is the environment index. The formulations of H, V and E are described in the former subsections. The heat health risk index is a dimensionless number and was classified into five levels equally: very high (>40), high (30–40), moderate (20–30), low (10–20) and very low (0–10), and these four years used the same standard. The standard using in urban area to classify the heat health index was defined differently: very high (>50), high (40–50), moderate (30–40), low (20–30) and very low (10–20). Because the average risk in the inner city is much higher than that in the whole city, the classification standards are different to display maps better.
Figure 3. Flowchart of the integrated spatial heat health risk assessment (Adapted and developed from Tomlinson et al. [45]).
E V H
R
Risk
Heat health risk index
Environment
Land use/cover Hazard
Heat wave days Extremely high temperature days
Vulnerability
Elderly ratio
3. Results
3.1. Hazard
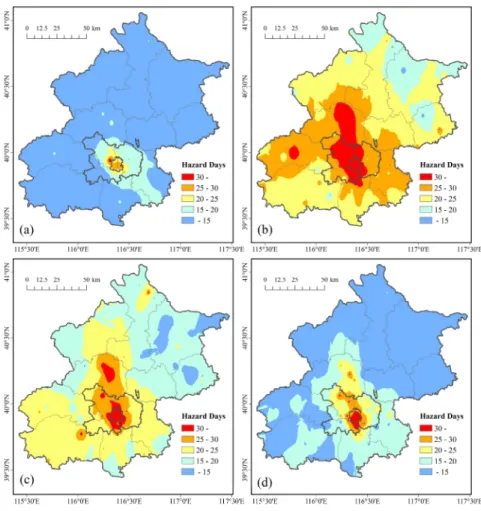
Compared the hazard index in 2008–2011, the heat hazard was generally higher in the urban areas than the rural areas (see Figure 4). High hazard areas are shown in a northwest-southeast distribution surrounding the urban districts. The CP district, which is located in the northwest of Beijing’s city center, had higher hazard than the other rural districts. The northeast suburbs had the lowest heat wave hazard. The average number of hot days in most areas in 2008 was below 15 days, whereas in 2009, the average number of hot days was above 20 days in most areas and is greater than a month in the urban districts and some borderland districts. DC and XC districts are the hottest areas with an average number of hot days of over 20 days even in the coldest year of 2008.
Results show that the higher hazard areas increased sharply between 2008 and 2009, and declined slightly from 2010 to 2011. The hottest year was 2009. However the heat wave hazard in 2011 was still higher than that in 2008. These four years can be divided into two groups: one was the representation of hotter years, including 2009 and 2010, and the other represented the colder years, including 2008 and 2011. These two groups can be used to show the differences between colder years and hotter years. Compared to the hotter years and colder years, it is apparent that the CP city was the second heat core other than downtown Beijing, especially in 2010. As shown in Figure 4, the heat hazard is spreading from the urban area to the center of rural districts in hotter years.
3.2. Vulnerability
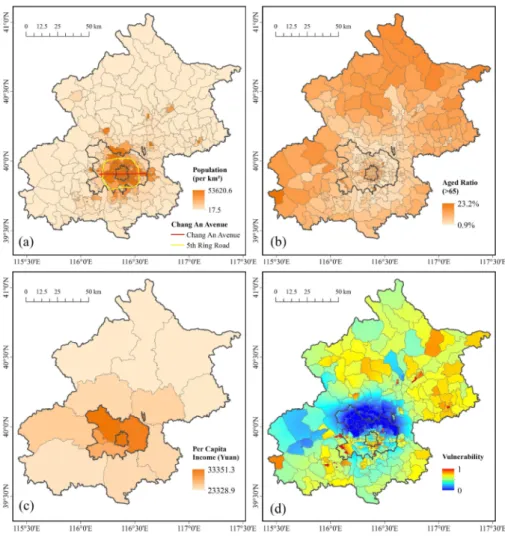
Overall, the urban and borderland districts (e.g., XC, DC, CY, HD, and SJS) have a higher population density than the rural districts (e.g., YQ, HR, MY and PG) (Figure 5a). More specifically, most areas with higher population density are located inside the 5th Ring Road (Figure 5a). The population density in several of the downtown core sub-districts is relatively lower than their neighboring sub-districts. This is probably because there are many ancient buildings and scenic places in the downtown area, such as the Forbidden City.
Figure 5. The spatial pattern of population density (a), the proportion of aged people (b), the average income level (c) in 2010, and the mean estimated heat vulnerability index (d) during 2008–2010 in Beijing. The yellow line in panel (a) shows the Chang An Avenue and the 5th Ring Road.
their parents and children in their hometown, which is a common phenomenon under the process of urbanization in China.
The districts with high per capita income are mainly distributed in the urban and borderland area (Figure 5c). The per capita income in rural area is generally lower than that in the city center. The per capita income was highest in HD District, and lowest in YQ District. The high-income people can afford air conditioner and other cooling facilities during heat waves, and usually have a relatively comfortable work environment. The low-income people may work without cooling facilities and even have to work outdoors under the summer sun during extreme heat events. Generally, the vulnerability to heat is relatively low for high-income people and relatively high for low-income people.
The spatial pattern of the vulnerability shows that the southern borderland area and the rural area have a higher vulnerability (Figure 5d). The northern borderland area has a lower vulnerability primarily because the per capita income of this area is high. The spatial pattern of the vulnerability shows that most of the highest areas were discretely distributed. The patterns are different from each spatial pattern of the three sub-indicators because they are the combination of these three sub-indicators.
3.3. Environment
The spatial pattern of environment index was estimated from the land use/cover data (Figure 6). We analyzed the Pearson Correlation of the impervious area ratio and mean hazard days, taking the sub-district as the unit. The impervious area ratio refers to the proportion of the impervious area to the total area of a sub-district. The mean hazard days refers to the average hazard days for 2009 to 2011. The result shows that these two parameters have a high correlation score of 0.796, which is significant at the 0.01 level. This confirms that the impervious area significantly increased the UHI effect and the intensity of the urban heat waves.
3.4. Heat Health Risk in Beijing
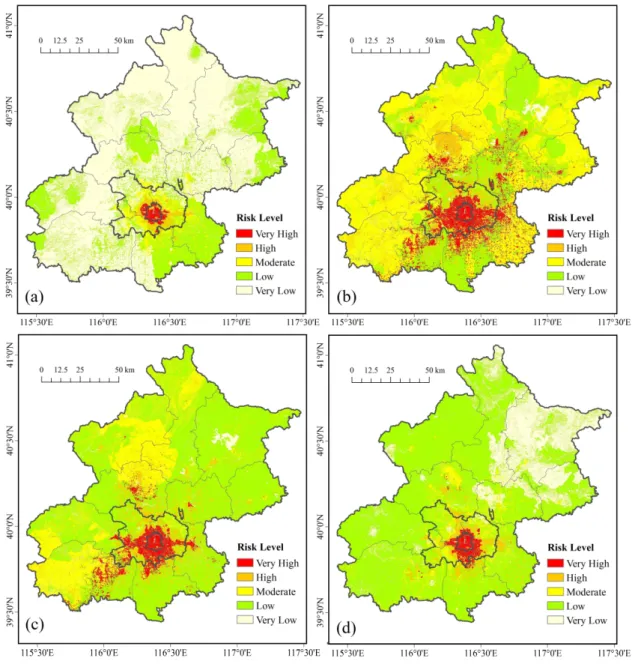
The classified spatial patterns of the assessed heat health risk for each year during 2008–2011 (Figure 7) shows that in general, the city center had a higher heat health risk than the suburbs; the northwest and west suburbs had a significantly higher heat wave risk than the northeast and south suburbs.
Figure 7. The final heat health risk of Beijing in (a) 2008; (b) 2009; (c) 2010; and (d) 2011.
In 2008, high heat health risk occurred primarily in the urban and borderland districts (see Figure 1). Among these districts, DC and XC districts experienced the highest heat health risk, where the temperature and population density are the highest and the proportion of elderly people is relatively high, too. Furthermore, the environment index is high because of the widespread impervious land cover such as cement roads and high buildings, and the lack of water surfaces and trees spread in these districts. These factors together made the urban area become the riskiest area in Beijing.
primarily due to the change in hazard index. Specifically, the risk level in some areas of the CP District increased to level very high and some areas in the nearby YQ and HR Districts increased to level high. The reasons for the changes were different. For the CP District, it was the hazard intensity of the heat wave that lead to the level increase, whereas the land use is mostly impervious, which also contributes to the final risk. In the YQ and HR Districts, the heat wave days and extreme high temperature days were not very high, but the proportion of elderly people was higher than the other areas. Therefore, the risk in these areas was also high.
The high-risk area spread widely with an obvious high-risk belt pattern from the east to the west in 2009 and 2010. The high-risk belt is centered at the most famous road, Chang An Avenue, and the first subway in Beijing, Subway Line 1 (see Figure 5a). Areas around this belt are more developed than other areas. Thus, the heat health risk was higher there than other areas. In relative colder years, the high heat health risk only concentrated in the most central part of Beijing, whereas the south part and the belt from east and west along the Subway Line 1 were more likely to be the high risk areas in hotter years.
After calculating the areas of each risk level, their proportions were determined by dividing by the total area. Figure 8 shows that the area experienced the high heat health risk grew quickly from 2008 to 2009, and then decreased a little in 2010. The area of very high-level risk grew from 0.7% in 2008 to 8.8% in 2009 and decreased to 4.6% in 2010. The area experienced moderate to very high level risk covered almost 70% area of Beijing in 2009, which signifies that residents living in 70% of the total area of Beijing were once exposed to heat waves and were at high risk to heat waves.
Figure 8. The area proportion of each heat health risk level in Beijing during 2008–2011.
Figure 9 shows the mean risk of the districts ordered from high to low. The district with the highest risk was the DC District and the lowest was the MY County. Mean risk of the two urban districts, DC and XC Districts, were significantly higher than the rest districts. Excluding the two urban districts, the mean risk of four borderland districts gradually declined to 20–30, only approximately half of DC and XC districts. The rural districts had similar mean risk index and all of them were below 20.
66.56% 2.64% 2.66% 20.24% 26.91% 29.91% 61.05% 67.43% 4.48% 52.34% 24.95% 7.28% 1.28% 6.22% 6.73% 3.34%
0.77% 8.88% 4.61% 1.71%
0% 10% 20% 30% 40% 50% 60% 70% 80% 90% 100%
2008 2009 2010 2011
Persentage
of the area of every
level
Figure 9. The ranking of the mean heat health risk for Beijing during 2008–2011 at the district level.
3.5. Comparison of the Borderland Area and Urban Area
We used ArcGIS to zonal analysis the mean risk at sub-district level during 2008–2011 to analyze the heat health risk in different area of Beijing. Figure 10 shows that the heat health risks in two urban districts and four borderland districts. The black circles in bold are boundaries between urban, borderland and rural area, which are same with Figure 1. The risk was high in the city center and low outside the center. The very center of the heat health risk distribution was noticeably deflected to the south. In 2008, there were only 2 sub-districts whose level was very high and 64 sub-districts experienced moderate-level to very high-level risk. In 2009, there were 60 sub-districts of level very high and 109 sub-districts experienced moderate-level to very high-level risk. The difference of heat health risk distribution between relative hotter year and colder year was very explicit.
Places closer to the city center had a higher heat wave risk, but there were some exceptions. Some borderland sub-districts had higher heat health risk than the urban area. Take 2010 year as an example (see Figure 10c), Donggaodi Sub-district and Jiuxianqiao Sub-district belong to the borderland area but were at high heat wave risk level same as some urban sub-districts, because they had very high proportion of elderly people. On the contrary, Shichahai Sub-district and Xichang’anjie Sub-district, which are located in the very center of Beijing, but had a lower risk than their surrounding sub-districts because there is a large area of lake called the Six Seas. Furthermore, places where the vegetation cover ratios were higher, such as Tiantan Sub-district (marked in Figure 10a), had a lower heat wave risk. Sub-districts that had higher population density, higher proportion of elderly people and less land use/cover type of water and green area had higher heat wave risk. Increase the water surface area and forest area in the city center is a good way to reduce heat health risk.
To summarize and analyze the main factors that influence the heat health risk of Beijing and their relationships, we abstracted five influencing sub-factors for the mean heat health risk: population density, elderly ratio, impervious area ratio, income index and mean hazard (Figure 11). The population density, elderly ratio and income index were sub-factors of the vulnerability; the impervious area ratio was used to represent the environment; and the mean hazard was the average of the hazard days during 2009–2011. It can be seen from Figure 11 that the urban area has the highest population density, elderly ratio, impervious area ratio, and mean hazard resulting in the highest risk. On the contrary, the rural area
53.1 51.1
30.9
27.4 26.2 22.3
19.7 19.0 19.0 17.5
16.3 16.2 15.9 15.1 14.6 13.2
0.0 10.0 20.0 30.0 40.0 50.0 60.0
DC XC FT CY SJS HD TZ DX CP FS MTG YQ SY HR PG MY
Heat Health risk index
has the lowest population density, impervious ratio and mean hazard leading to the lowest risk although it has the highest income. Borderland falls between the urban and rural area.
The asterisks and circles in Figure 11 represent the outliers, which also should be paid attention to risk reduction. It can be note that for population density and income index, rural area has more outliers, which are mainly distributed near borderland areas or in the downtown core sub-districts of the rural districts indicating unbalanced distribution of population and economic development. There were both very high and very low elderly ratios (i.e., high variance) in the rural area, which means the population composition of rural area was very complicated. The two outliers of impervious area ratio in urban area were sub-districts where the water or forest area was high while the outliers in the rural area were mainly the downtown core sub-districts. In addition, high variance of borderland in population density, income index, impervious ratio (i.e., high variance in vulnerability) leads to high variance in risk distribution in borderland areas. In general, mean risk in urban area was the highest and in the rural area was the lowest. The highest risky sub-district located in the borderland area.
Figure 11. Comparison of normalized influencing (A) and consequence (B) factors between urban and rural area. Normalized all six factors to range 0–1 (n of urban = 32, n of borderland = 98, n of rural = 189).
3.6. Validation
Due to the privacy policy of the government, the heat-related mortality or hospitalization data was inaccessible for us to conduct an accurate validation. We can only access to the total mortality data of each district, which is aggregated from all types of mortality. Excess mortality can be used to substitute the heat-related mortality because it is hard to define heat-related death [74–76]. The results show that the method proposed in this paper considering environments in heat health risk assessment got better correlation than the old methods without considering environment factor.
Within the scope of the study time, 2008 and 2011 are colder years. So we use the average death toll of 2008 and 2011 as the basic death toll. As vulnerability and environment data both were obtained in 2010, we used 2010’s death toll minus basic death toll and then divided by total population and area, thus we got the mean excess mortality rate as one parameter. Then we used the zonal statistic tool in ArcGIS to get each district’s mean risk as the other parameter. These two parameters are highly correlated with a correlation coefficient of 0.884, statistically significant at the confidence level of 0.01. It indicates that with the increasing of the risk, the mortality increases.
By contrast, we calculated the heat health risk with no environment factor by changing equation “R = H × V × E” to “R = H × V”. The correlation coefficient of heat health risk with no environment and mean excess mortality rate was 0.876 (p < 0.01), which was lower than 0.884.
4. Discussion and Conclusions
and 2011. Comparing hazard maps from 2008 to 2011, the changes in heat waves were primarily diffused or contracted from urban area to rural area. It can be concluded from the heat health risk distributions that the city center had a higher heat health risk, which was affected not only by hazard factors but also by vulnerability and environmental factors. But by comparing the difference between colder years and hotter years, it was noticed that areas where the risk level changed needed to pay more attention. These areas were mainly distributed in the borderland area between urban area and rural area, and the downtown core sub-districts in the rural area. The lowest risky areas in Beijing’s downtown were sub-districts with high percentile of water and forest area.
China’s urbanization process started to increase from the 1970s. The nation’s population dwelling in cities is expected to reach to 60% by 2020 [77]. Such rapid urbanization brings many social problems, including economy, medical treatment, education, health, resource and environment. Land use/cover will change along with urbanization, thus the UHI effect will be enhanced especially under the background of climate change [78]. Therefore, it can directly lead to a dramatic increase in people’s heat health risks in the cities. Especially in the borderland, cropland will be replaced by urban land and the population density will grow very fast, thus the heat health risk will grow faster than the urban area and rural area. It is a very important topic to guarantee the sustainable development between climate change and people’s health in China’s rapid urbanization. This study demonstrates a simple and flexible method to assess the heat health risk in cities, and can provide support to study the sustainable development of people’s health risk in the process of urbanization.
As shown in the former paper, we divided these four years into two groups, one is colder years and the other group is hotter years. In China, census data and land use/cover data is only collected once every 10 years because these two kinds of data change slowly. On the contrary, weather changes every day, and has it’s up and down trends year by year. So hazard data should have higher accuracy than the two other kinds of data. Besides, people live in areas where there are at low risk in colder years but high risk in hotter years are more dangerous than people live in areas where there always are at high risk. Because these people have less experience in confronting heat waves.
capita income instead. Although these two factors are not exactly correlated with each other, the trends of them are alike because per capita income reveals the purchasing power of air conditioning.
The correlation of factors exists in the vulnerability field. Cutter et al. developed a general index for social vulnerability to environmental hazards called the Social Vulnerability Index for the US (SoVI) [80]. Cutter et al. listed 42 socioeconomic and demographic variables and reduced them to 11 independent factors that explained 76% of the variance using factor analysis. They also conducted spatial comparison of the SoVI and concluded that these factors contribute differently to the vulnerability for different county. To be more specific to the extreme heat vulnerability, Johnson et al. proposed an extreme heat vulnerability index (EHVI) [81]. The EHVI is the principal components of 25 census data and remotely sensed variables employing principal component analysis (PCA). These components accounted for 80% of the total variance. Such discussion can also be found in many other studies (e.g., Reid et al., 2009) [72]. However, there is no consistency of the contribution of each factor to the vulnerability in literature. Different from the above-mentioned studies, which are dedicated to analyzing the vulnerability factors (usually dozens of factors are involved, and consequently, factor reduction or PCA are required), we establish vulnerability as one component of the risk assessment and only adopt three factors to measure vulnerability. With only a few factors for risk calculation (and these factors are essential and cannot be excluded), we decided not to conduct such factor analysis or PCA to assess the risk, as many other heat risk assessment studies did [45,46].
In terms of the population density, it is highly related with temperature, parts of the reason is that increasing population density could lead to higher temperatures from an anthropogenic heat release such as vehicles and air conditioning use, that will in turn enhance the UHI effects, resulting in higher heat risk. [51,82]. But the population density is not the only influencing factor of the UHI effects. As explained in the paper, UHI has its own formation and operation mechanism. Therefore, it is very difficult to measure the part of the contribution of the population density partly though it’s association with the UHI effects. So we separate the UHI effects as an independent variable and modeled it in the Environment component of the risk assessment because of its fundamental relation to land use/cover types (see Section 2.5). Based on the above considerations, we think it is reasonable to use the proposed method to calculate the risk regardless of the overlap of some factors.
For weight of factors, multiple studies have used the equal weighted method to calculate vulnerability. For instances, Collins et al. selected 14 factors from four aspects including population and structures, access to resources, socioeconomic status and institutional capacity etc. [83]. They calculated the vulnerability by adding these 14 factors with equal weight. Tomlinson et al. combined four factors (namely, socio-economic status, extreme age, population density, and old buildings) into vulnerable index with equal weight [45]. Vescovi et al. simply added four sub-indices (namely, age, poverty, social isolation, and education) into social vulnerability [46]. Although the literature shows that the contribution of social indices differ and that autocorrelation exists among them, there is no commonly acknowledged standard weight of each index [72,80,81] and therefore we combined these indices with equal weight.
are different ways to reduce the risk (see Box 1). Fundamentally, not only for Beijing but also for other cities, several means are listed in Box 2 to decrease the heat health risk.
Box 1. Ways to mitigate the heat health risk for different districts in Beijing.
Box 2. General ways to mitigate the public heat health risk.
In summary, this study shows that the city center has the highest heat health risk. There are two general ways to reduce the heat wave risk. One is to change the environment, such as by improving city planning and planting more trees in the city. The second way is to reduce the vulnerability, such as by caring for vulnerable people, such as the elderly, poor and susceptible people. The essential solution is to reduce the consumption of fossil fuels and protect the environment, realizing real sustainable development, which will fundamentally solve the climate change problem.
(a) The high heat wave risk of some seats of government, such as the PG, MY and YQ towns is
primarily as result of the high population density. Limiting the number of people moving onto
these streets is the best way to control the heat wave risk.
(b) The high proportion of elderly people results in the high heat wave risk of the DC, XC, HR,
YQ and MTG Districts. Building well-equipped nursing homes to provide good care to elderly
people is the best way. Besides to reduce the heat health risk. Furthermore, increasing the
proportion of water and forest areas can also decrease the heat wave risk.
(c) The low-income areas, such as the FS, YQ, HR, MY and PG Districts, also have a high heat
wave risk. Developing the economy and increasing the per capita income of these areas can
help decrease the heat wave risk.
(a) The authorities should consolidate the related laws and regulations, refine the local heat health
warning systems, and intensify the prevention measures. The power supply departments
should ensure the power supply during heat wave days. Moreover, it is essential that clean
drinking water is guaranteed by the municipal water-supply departments.
(b) Furthermore, publicize health protection knowledge against heat-related diseases and ensure
that people learn how to save themselves or others in time. Vulnerable groups, especially the
elderly, should be cared for during extremely hot days. People should change their habits in
the hot days.
(c) People should extend their efforts towards increasing the proportion of urban green areas,
especially by planting more forests. The urban planning administration is responsible for
effectively guiding the design and planning the quantity, species and distribution of urban
green space. City planning should increase the proportion of green spaces in poor areas and
increase the living conditions of poor people.
(d) People’s homes and hospitals should implement cooling measures. Plant trees around houses
to reduce the solar heat gain. Water the plants more and by water evaporation will reduce the
temperature. Thicken curtains and paint houses with temperature-minimizing materials. It is
Acknowledgments
This research was supported by the National Basic Research Program of China (973 Program) (Grant No. 2012CB955403), Beijing Nova Program (Grant No. 2011044) and National Natural Science Foundations of China (NSFC, Grant No. 41471382). Comments from the reviewers are appreciated, which helped in the improvement of the article’s quality.
Author Contributions
Weihua Dong played an important role in the conception of the study, performing the data analyses, drafting and revising the manuscript. Zhao Liu and Lijie Zhang contributed to the conception of the study and played an important role in interpreting of the results and approved the final version. Qiuhong Tang and Hua Liao contributed a lot to framework of the methodology and the revision of the manuscript. Xian’en Li contributed to process the environment and climate station data.
Conflicts of Interest
The authors declare no conflict of interest. References
1. Gosling, S.N.; Lowe, J.A.; McGregor, G.R.; Pelling, M.; Malamud, B.D. Associations between elevated atmospheric temperature and human mortality: A critical review of the literature. Clim. Chang. 2009, 92, 299–341.
2. Robine, J.-M.; Cheung, S.L.K.; Le Roy, S.; van Oyen, H.; Griffiths, C.; Michel, J.-P.; Herrmann, F.R. Death toll exceeded 70,000 in Europe during the summer of 2003. Comptes Rendus Biol. 2008, 331, 171–178.
3. Semenza, J.C.; Rubin, C.H.; Falter, K.H.; Selanikio, J.D.; Flanders, W.D.; Howe, H.L.; Wilhelm, J.L. Heat-related deaths during the july 1995 heat wave in Chicago. N. Engl. J. Med. 1996, 335, 84–90. 4. Huang, W.; Kan, H.; Kovats, S. The impact of the 2003 heat wave on mortality in Shanghai, China.
Sci. Total Environ. 2010, 408, 2418–2420.
5. Meehl, G.A.; Zwiers, F.; Evans, J.; Knutson, T.; Mearns, L.; Whetton, P. Trends in extreme weather and climate events: Issues related to modeling extremes in projections of future climate change. Bull. Am. Meteorol. Soc. 2000, 81, 427–436.
6. Koppe, C.; Kovats, S.; Jendritzky, G.; Menne, B. Health and Global Environmental Change Series, No. 2 Heat-Waves: Risks and Responses; World Health Organization: Geneva, Switzerland, 2004. 7. Barrow, M.W.; Clark, K.A. Heat-related illnesses. Am. Fam. Physician 1998, 58, 749–756. 8. Bouchama, A.; Knochel, J.P. Heat stroke. New Engl. J. Med. 2002, 346, 1978–1988.
9. Tian, Z.; Li, S.; Zhang, J.; Guo, Y. The characteristic of heat wave effects on coronary heart disease mortality in Beijing, China: A time series study. PLoS One 2013, 8, e77321.
11. Vaneckova, P.; Beggs, P.J.; de Dear, R.J.; McCracken, K.W. Effect of temperature on mortality during the six warmer months in Sydney, Australia, between 1993 and 2004. Environ. Res. 2008, 108, 361–369.
12. Fouillet, A.; Rey, G.; Laurent, F.; Pavillon, G.; Bellec, S.; Guihenneuc-Jouyaux, C.; Clavel, J.; Jougla, E.; Hmon, D. Excess mortality related to the august 2003 heat wave in France. Int. Arch. Occup. Environ. Health 2006, 80, 16–24.
13. Hansen, A.L.; Bi, P.; Ryan, P.; Nitschke, M.; Pisaniello, D.; Tucker, G. The effect of heat waves on hospital admissions for renal disease in a temperate city of Australia. Int. J. Epidemiol. 2008, 37, 1359–1365.
14. Centre for Research on the Epidemiology of Disasters (CRED). Emergency Events Database (EM‐DAT). Available online: http://www.emdat.be/ (accessed on 15 June 2014).
15. Guha-Sapir, D.; Vos, F.; Below, R.; Ponserre, S. Annual disaster statistical review 2010. Available online: http://www.cred.be/sites/default/files/ADSR_2010.pdf (accessed on 15 June 2014).
16. World Meteorological Organization (WMO). 2001–2010: A decade of climate extremes. Available online: http://library.wmo.int/pmb_ged/wmo_1103_en.pdf (accessed on 15 June 2014).
17. Meehl, G.A.; Tebaldi, C. More intense, more frequent, and longer lasting heat waves in the 21st century. Science 2004, 305, 994–997.
18. Weng, Q. Fractal analysis of satellite-detected urban heat island effect. Photogramm. Eng. Rem. Sens. 2003, 69, 555–566.
19. Field, C.B.; Barros, V.; Stocker, T.F.; Dahe, Q. Managing the Risks of Extreme Events and Disasters to Advance cliMate Change Adaptation: Special Report of the Intergovernmental Panel on Climate Change; Cambridge University Press: Cambridge, UK, 2012.
20. Kim, H.H. Urban heat island. Int. J. Rem. Sens. 1992, 13, 2319–2336.
21. Seto, K.C.; Shepherd, J.M. Global urban land-use trends and climate impacts. Curr. Opin. Environ. Sustain. 2009, 1, 89–95.
22. Coutts, A.M.; Beringer, J.; Tapper, N.J. Impact of increasing urban density on local climate: Spatial and temporal variations in the surface energy balance in Melbourne, Australia. J. Appl. Meteorol. Climatol. 2007, 46, 477–493.
23. Stabler, L.B.; Martin, C.A.; Brazel, A.J. Microclimates in a desert city were related to land use and vegetation index. Urban For. Urban Green. 2005, 3, 137–147.
24. Grossman-Clarke, S.; Zehnder, J.A.; Loridan, T.; Grimmond, C.S.B. Contribution of land use changes to near-surface air temperatures during recent summer extreme heat events in the Phoenix metropolitan area. J. Appl. Meteorol. Climatol. 2010, 49, 1649–1664.
25. Wong, N.H.; Yu, C. Study of green areas and urban heat island in a tropical city. Habitat Int. 2005, 29, 547–558.
26. Tan, J.; Zheng, Y.; Song, G.; Kalkstein, L.S.; Kalkstein, A.J.; Tang, X. Heat wave impacts on mortality in Shanghai, 1998 and 2003. Int. J. Biometeorol. 2007, 51, 193–200.
27. Buscail, C.; Upegui, E.; Viel, J.-F. Mapping heatwave health risk at the community level for public health action. Int. J. Health Geogr. 2012, doi:10.1186/1476-072X-11-38.
29. Depietri, Y.; Welle, T.; Renaud, F.G. Social vulnerability assessment of the cologne urban area (Germany) to heat waves: Links to ecosystem services. Int. J. Disaster Risk Reduct. 2013, 6, 98–117. 30. Bowler, D.E.; Buyung-Ali, L.; Knight, T.M.; Pullin, A.S. Urban greening to cool towns and cities:
A systematic review of the empirical evidence. Landsc. Urban Plan. 2010, 97, 147–155.
31. Taha, H. Urban climates and heat islands: Albedo, evapotranspiration, and anthropogenic heat. Energy Build. 1997, 25, 99–103.
32. Dimoudi, A.; Nikolopoulou, M. Vegetation in the urban environment: Microclimatic analysis and benefits. Energy Build. 2003, 35, 69–76.
33. Burkhard, B.; Kroll, F.; Müller, F.; Windhorst, W. Landscapes’ capacities to provide ecosystem services—A concept for land-cover based assessments. Landsc. Online 2009, 15, 1–22.
34. Gong, A.; Chen, Y.; Li, J.; Hu, H. Study on relationship between urban heat island and urban land use and cover change in Beijing. J. Image Graph. 2007, 12, 1476–1482.
35. Karl, T.R.; Diaz, H.F.; Kukla, G. Urbanization: Its detection and effect in the United States climate record. J. Clim. 1988, 1, 1099–1123.
36. Wang, Y.; Hu, F. Variations of the urban heat island in summer of the recent 10 years over Beijing and its environment effect. Chin. J. Geophys. 2006, 49, 61–68.
37. Yang, P.; Ren, G.; Liu, W. Spatial and temporal characteristics of Beijing urban heat island intensity. J. Appl. Meteorol. Climatol. 2013, 52, 1803–1816.
38. Ren, G.; Chu, Z.; Chen, Z.; Ren, Y. Implications of temporal change in urban heat island intensity observed at Beijing and Wuhan stations. Geophys. Res. Lett. 2007, 34, 1–5.
39. Wang, F.; Zhang, W. Population distribution and its change of Beijing since the reform and opening up policy. Popul. Res. 2001, 25, 62–66. (In Chinese)
40. Robinson, P.J. On the definition of a heat wave. J. Appl. Meteorol. 2001, 40, 762–775.
41. World Meteorological Organization (WMO). International Meteorological Vocabulary, No. 182. Available online: http://www.wmo.int/ (accessed on 15 June 2014).
42. Garssen, J.; Harmsen, C.; de Beer, J. The effect of the summer 2003 heat wave on mortality in The Netherlands. Eurosurveillance 2005, 10, 165–167.
43. China Meteorological Administration (CMA). Heat wave meteorological level forecast implementation plan. Available online: http://www.cma.gov.cn/ (accessed on 15 June 2014).
44. Katnich, L.O.; Quirante, F.P. Fatal heat stroke in a schizophrenic patient. Case Rep. Crit. Care 2012, doi:10.1155/2012/924328.
45. Tomlinson, C.J.; Chapman, L.; Thornes, J.E.; Baker, C.J. Including the urban heat island in spatial heat health risk assessment strategies: A case study for Birmingham, UK. Int. J. Health Geogr. 2011, doi:10.1186/1476-072X-10-42.
46. Vescovi, L.; Rebetez, M.; Rong, F. Assessing public health risk due to extremely high temperature events: Climate and social parameters. Clim. Res. 2005, 30, 71–78.
47. Wisner, B. At Risk: Natural Hazards, People’s Vulnerability and Disasters; Psychology Press: East Sussex, UK, 2004.
48. Harlan, S.L.; Brazel, A.J.; Prashad, L.; Stefanov, W.L.; Larsen, L. Neighborhood microclimates and vulnerability to heat stress. Soc. Sci. Med. 2006, 63, 2847–2863.
50. Hajat, S.; Kosatky, T. Heat-related mortality: A review and exploration of heterogeneity. J. Epidemiol. Comm. Health 2010, 64, 753–760.
51. Smith, C.; Lindley, S.; Levermore, G. Estimating spatial and temporal patterns of urban anthropogenic heat fluxes for UK cities: The case of Manchester. Theor. Appl. Climatol. 2009, 98, 19–35.
52. Pan, W.-H.; Li, L.-A.; Tsai, M.-J. Temperature extremes and mortality from coronary heart disease and cerebral infarction in elderly Chinese. Lancet 1995, 345, 353–355.
53. Saez, M.; Sunyer, J.; Catellsague, J.; Murillo, C.; Anto, J.M. Relationship between weather temperature and mortality: A time series analysis approach in Barcelona. Int. J. Epidemiol. 1995, 24, 576–582.
54. Havenith, G. Temperature regulation and technology. Gerontechnology 2001, 1, 41–49.
55. Poumadere, M.; Mays, C.; Mer, S.L.; Blong, R. The 2003 heat wave in France: Dangerous climate change here and now. Risk Analysis 2005, 25, 1483–1494.
56. Vaneckova, P.; Beggs, P.J.; Jacobson, C.R. Spatial analysis of heat-related mortality among the elderly between 1993 and 2004 in Sydney, Australia. Soc. Sci. Med. 2010, 70, 293–304.
57. Peng, R.D.; Bobb, J.F.; Tebaldi, C.; McDaniel, L.; Bell, M.L.; Dominici, F. Toward a quantitative estimate of future heat wave mortality under global climate change. Environ. Health Perspect. 2011, 119, 701–706.
58. Jones, T.S.; Liang, A.P.; Kilbourne, E.M.; Griffin, M.R.; Patriarca, P.A.; Wassilak, S.G.F.; Mullan, R.J.; Herrick, R.F.; Donnell, H.D., Jr.; Choi, K. Morbidity and mortality associated with the july 1980 heat wave in St Louis and Kansas City, Mo. JAMA J. Am. Med. Assoc. 1982, 247, 3327–3331. 59. Kilbourne, E.M.; Choi, K.; Jones, T.S.; Thacker, S.B. Risk factors for heatstroke. Jama 1982, 247,
3332–3334.
60. Bassil, K.L.; Cole, D.C.; Moineddin, R.; Craig, A.M.; Wendy Lou, W.; Schwartz, B.; Rea, E. Temporal and spatial variation of heat-related illness using 911 medical dispatch data. Environ. Res. 2009, 109, 600–606.
61. Stafoggia, M.; Forastiere, F.; Agostini, D.; Biggeri, A.; Bisanti, L.; Cadum, E.; Caranci, N.; de Donato, F.; de Lisio, S.; de Maria, M. Vulnerability to heat-related mortality: A multicity, population-based, case-crossover analysis. Epidemiology 2006, 17, 315–323.
62. Center for Earth System Science (CESS). Finer Resolution Observation and Monitoring—Global Land Cover. Available online: http://data.ess.tsinghua.edu.cn/ (accessed on 15 June 2014).
63. Gong, P.; Wang, J.; Yu, L.; Zhao, Y.; Zhao, Y.; Liang, L.; Niu, Z.; Huang, X.; Fu, H.; Liu, S. Finer resolution observation and monitoring of global land cover: First mapping results with landsat Tm and Etm+ data. Int. J. Rem. Sens. 2013, 34, 2607–2654.
64. Thumerer, T.; Jones, A.; Brown, D. A gis based coastal management system for climate change associated flood risk assessment on the east coast of England. Int. J. Geogr. Inf. Sci. 2000, 14, 265–281. 65. Wilhelmi, O.V.; Wilhite, D.A. Assessing vulnerability to agricultural drought: A Nebraska case
study. Nat. Hazards 2002, 25, 37–58.
66. Taramelli, A.; Melelli, L.; Pasqui, M.; Sorichetta, A. Estimating hurricane hazards using a GIS system. Nat. Hazards Earth Syst. Sci. 2008, 8, 839–854.
68. Zerger, A.; Smith, D.I. Impediments to using GIS for real-time disaster decision support. Comput. Environ. Urban Syst. 2003, 27, 123–141.
69. Crichton, D. The risk triangle. In Natural Disaster Management: A Presentation to Commemorate the International Decade for Natural Disaster Reduction (IDNDR), 1990–2000; Ingleton, J., Ed.; Tudor Rose: Leicester, UK, 1999; pp. 102–103.
70. Kestens, Y.; Brand, A.; Fournier, M.; Goudreau, S.; Kosatsky, T.; Maloley, M.; Smargiassi, A. Modelling the variation of land surface temperature as determinant of risk of heat-related health events. Int. J. Health Geogr. 2011, 10, 1–9.
71. Le Tertre, A.; Lefranc, A.; Eilstein, D.; Declercq, C.; Medina, S.; Blanchard, M.; Chardon, B.; Fabre, P.; Filleul, L.; Jusot, J.-F. Impact of the 2003 heatwave on all-cause mortality in 9 French cities. Epidemiology 2006, 17, 75–79.
72. Reid, C.E.; O’Neill, M.S.; Gronlund, C.J.; Brines, S.J.; Brown, D.G.; Diez-Roux, A.V.; Schwartz, J. Mapping community determinants of heat vulnerability. Environ. Health Perspect. 2009, 117, 1730–1736.
73. United Nations Disaster Relief Organization (UNDRO). Mitigating Natural Disasters: Phenomena, Effects and Options : A Manual for Policy Makers and Planners; United Nations: New York, NY, USA, 1991.
74. Corobov, R.; Sheridan, S.; Opopol, N.; Ebi, K. Heat-related mortality in Moldova: The summer of 2007. Int. J. Climatol. 2013, 33, 2551–2560.
75. Davis, R.E.; Knappenberger, P.C.; Michaels, P.J.; Novicoff, W.M. Changing heat-related mortality in the United States. Environ. Health Perspect. 2003, 111, 1712–1718.
76. Dessai, S. Heat stress and mortality in Lisbon part 1. Model construction and validation. Int. J. Biometeorol. 2002, 47, 6–12.
77. Xuemei, B.; Peijun, S.; Yansui, L. Realizing China’s urban dream. Nature 2014, 509, 158–160. 78. Grimm, N.B.; Faeth, S.H.; Golubiewski, N.E.; Redman, C.L.; Wu, J.; Bai, X.; Briggs, J.M. Global
change and the ecology of cities. Science 2008, 319, 756–760.
79. Lundgren, K.; Kjellstrom, T. Sustainability challenges from climate change and air conditioning use in urban areas. Sustainability 2013, 5, 3116–3128.
80. Cutter, S.L.; Boruff, B.J.; Shirley, W.L. Social vulnerability to environmental hazards. Soc. Sci. Q. 2003, 84, 242–261.
81. Johnson, D.P.; Stanforth, A.; Lulla, V.; Luber, G. Developing an applied extreme heat vulnerability index utilizing socioeconomic and environmental data. Appl. Geogr. 2012, 35, 23–31.
82. Luber, G.; McGeehin, M. Climate change and extreme heat events. Am. J. Prev. Med. 2008, 35, 429–435.
83. Collins, T.W.; Grineski, S.E.; de Lourdes Romo Aguilar, M. Vulnerability to environmental hazards in the Ciudad Juárez (Mexico)—EI Paso (USA) metropolis: A model for spatial risk assessment in transnational context. Appl. Geogr. 2009, 29, 448–461.