Interactive Relationship Between Urban Development and
Population Mobility in China from Multi-scale Perspective
マルチスケールの視点から
中国における都市開発と人口移動の関係に関する研究
北九州市立大学国際環境工学研究科
2021 年 02 月
杨 禛
YANG ZHEN
Interactive Relationship Between Urban Development and
Population Mobility in China from Multi-scale Perspective
February 2021
ZHEN YANG
The University of Kitakyushu
Faculty of Environmental Engineering
Department of Architecture
Gao Laboratory
This study takes Chinese cities as the research objects and explores the interactive
relationship between urban development and population mobility. In particular, we
emphasize the importance of studying the interaction between population mobility and
urban development at different scales. Combined with official statistics and emerging
big data, we describe the temporal and spatial dynamics of population mobility between
cities and within cities. With the help of spatial econometric model and other
mathematical statistical models, we analyze the urban development factors affecting
population mobility, including urban economy, urban policies, urban built up
environment and urban public services. Our empirical results provide a certain
reference for the promotion of China’s urbanization process and the sustainable
development of cities in the new period.
It is a great experience for me to come to Japan and follow Prof. Weijun GAO in the
University of Kitakyushu. The past three years is very memorable time for me. I would
like to extend heartfelt gratitude and appreciation to the people who helped me bring
my study into reality.
Firstly, I would like to express the deepest appreciation to my advisor, Prof. Weijun
GAO, for his great support and motivation for the work. His optimistic attitude and
guidance have helped me greatly these years. In addition, Prof. Gao provides me a free
space to develop my knowledge and teaches me how to become a matured researcher.
Apart from the study, he also gives me much help and instruction for my daily life. I
will always remember Prof. Gao’s kindness.
Also, I would like to express my thanks to all university colleagues, especially Dr.
Jinming JIANG, Dr. Xue FANG, Mr. Jian’an LIU, Mr. Xudong XIE, who give me the
help, cooperation, and supports of research and daily life in Japan. And thanks to all the
members of Gao Laboratory, especially Dr. Rui WANG, Dr. Daoyuan WEN, Mr.
Fanyue QIAN, et al for their help and supporting during the study and life.
Finally, many thanks to my family for their love and encouragement which is beyond
words.
Population Mobility in China from Multi-scale Perspective
ABSTRACT
Development is the primary issue facing cities in the world today. Urban
development is inseparable from the support of labor. The population mobility between
regions provides a guarantee for the sustainable development of the city. Therefore, the
interactive relationship between urban development and population mobility requires
more in-depth research. The background of the development of China’s urbanization,
the intersection of interdisciplinary methods and the emergence of new data enable
more extensive research on this topic.
This research combines official statistics data and emerging big data to study the
interactive relationship between urban development and population mobility at the
macro, meso and micro levels. In addition, with the help of exploratory spatial data
analysis methods, the spatial effects between urban development and population
mobility, including spatial dependence and spatial heterogeneity are captured. The use
of spatial econometric models reveals the driving force that affecting population
mobility. The results of the empirical analysis can provide a theoretical reference for
the future development of urbanization in China.
In chapter one, the background and significance of studying the interactive
relationship between population mobility and urban development is demonstrated from
three aspects: the development status of China’s urbanization, the changes in population
mobility, and the emergence of new data and new methods. Then we reviewed the
previous studies. Finally, the purpose of this research is proposed.
In chapter two, after introducing the concept and application of geographic
information system (GIS), the exploratory spatial data analysis method based on GIS is
explained in detail. In addition, we also focused on the principles and applications of
spatial econometric models, social network analysis and logistic regression models.
Finally, we introduced the data used in this paper, including official statistics, emerging
big data, and national migrant population dynamic monitoring and survey data.
In chapter three, we studied the scale of population mobility in 290 prefecture-level
cities in China since 2000 based on national statistics. In particular, we focused on the
changes in population mobility after 2010, and depicted the spatial patterns of China’s
domestic population mobility in the past 20 years. In addition, we have developed a
mixed model to capture spatial effects and explore their impacts on population mobility
and heterogeneity effects from three different aspects of urban development, namely,
public policy, habitant environment and social economy. The results show that the
spatial patterns of population mobility in China has changed significantly since 2010.
Although economic differences between regions are an important factor in attracting
population mobility, the impact of urban habitant environment seems to be more and
more important after 2010. Public policies, such as population control policies, have a
weak positive impact on population mobility in megacities. These findings contribute
to our understanding of China’s population mobility patterns and their interaction with
urban development at the macro level, and provide valuable information for
governments and planners while developing effective strategies to promote sustainable
urban development.
In chapter four, with the help of Tencent location big data, we describe the population
mobility network of prefecture-level cities in China during the Spring Festival in 2019,
and analyze the characteristics of the population mobility network with social network
analysis method. In addition, by using the mixed model, we focus on the impact of
urban socio-economic development on population mobility. The results show that the
population mobility network presents a diamond structure, the top of the diamond is
located in the four major urban agglomerations in China, and the population mobility
network has a typical “small world” characteristic. The results of the mixed model show
that urban social economy has a strong attraction for population mobility. Specifically,
the wage level of the city, the development of the tertiary industry and foreign
investment have a significant role in promoting the population inflow. The research
results not only expand the application of big data, but also have a deeper understanding
of the relationship between population mobility network and urban development.
In chapter five, we empirically analyze the impact of population inflow on regional
and urban development at the city scale. In particular, we focus on China’s Yangtze
River Delta region and explore how population mobility affects urban economic
development. The results of the panel model show that the urban GDP increases by
0.259% for every 1% increase of population inflow in the Yangtze River Delta urban
agglomeration. Our results also show that the transmission mechanism of population
inflow affects urban economy. Urban population inflow can transform industrial
structure, promote residents’ consumption, improve scientific and technological
innovation ability and increase labor market employment, so as to realize the rapid
growth of urban economy. Our results confirm the interactive relationship between
population mobility and urban development, and supplement the research on urban
population.
to the impact of urban built environment on urban population mobility. In particular, on
weekdays, the urban population presents the characteristics of central aggregation in
the daytime and diffusion in the nighttime, while on the weekends, the opposite is true.
The regression results show that the urban built environment quantified by 5Ds has a
significant impact on the urban population mobility. The spatial form of buildings
(Design), the diversity of urban functional facilities (diversity), the density of urban
functional facilities (density), the intersection and density of urban road network
(destination accessibility), and the transfer of regional center or public transport hub
(distance to transit) can positively affect the flow of population in the city. Our results
highlight the important role of the built environment in maintaining and increasing
urban vitality. The flow of population in the city greatly promotes the prosperity of
urban vitality, which is affected by the built environment of the city. Our results can
provide inspiration for urban designers and urban planners, and provide theoretical
support for them to plan a vibrant city.
Preface
Acknowledgement
Abstract
Chapter 1. Background and purpose of the study
1.1 Introduction ... 1-1 1.2 Research background and significance ... 1-6 1.2.1 The complexity and diversity of urban development in China in the new era ... 1-6
1.2.2 Significant changes have taken place in population mobility in China ... 1-7 1.2.3 The potential of emerging big data in spatiotemporal behavior research ... 1-10 1.2.4 Research significance ... 1-12 1.3 Review of previous study ... 1-14 1.3.1 Study on the urban development ... 1-14 1.3.2 Study on the population mobility and its relationship between urban development ... 1-14 1.4 Purpose and content overview of this study ... 1-17
Reference ... 1-22
Chapter 2. Methods and data in the research of interactive relationship between
urban development and population mobility
2.1 Introduction ... 2-1 2.2 Methods and implications of Geographic Information system (GIS) ... 2-3 2.2.1 Theories and development of GIS ... 2-3
2.2.2 Explanatory spatial data analysis (ESDA) in GIS ... 2-4 2.3 Spatial econometric model ... 2-11 2.4 Social network analysis (SNA) ... 2-18 2.5 Logistic regression model ... 2-22 2.6 Data... 2-24
2.5 Summary ... 2-28
Reference ... 2-29
Chapter 3. Spatiotemporal characteristics and driving forces of population
mobility in urban China from 2000-2018
3.1 Introduction ... 3-1 3.2 Research framework ... 3-3 3.2.1 Research area and data ... 3-3
3.2.2 Definitions ... 3-3
3.2.3 Methods... 3-4
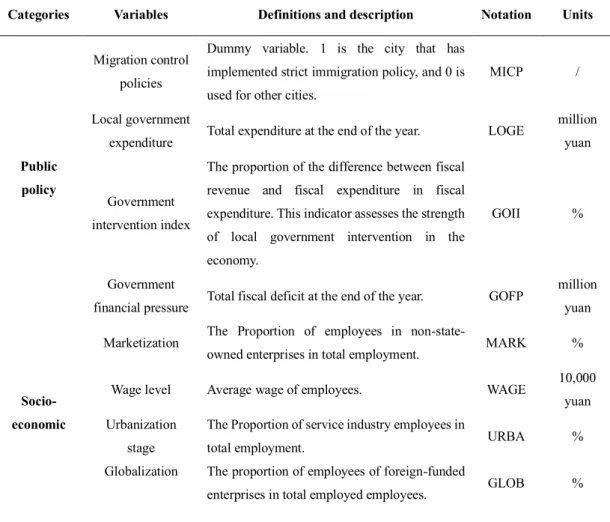
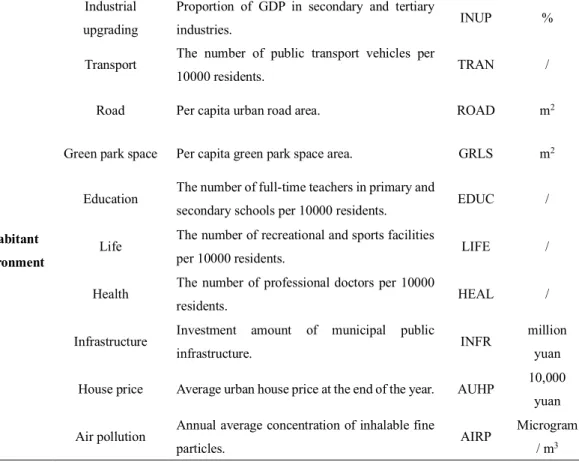
3.2.4 Independent Variables Selection ... 3-4
3.2.5 SGWR model construction ... 3-7 3.3 Empirical results ... 3-8
3.3.1 Spatiotemporal patterns of population migration ... 3-8
3.3.2 Changes in the driving force of population migration ... 3-18
3.4 Summary ... 3-28
Reference ... 3-31
Chapter 4. Spatiotemporal patterns of population mobility and its determinants
in urban China during Spring Festival of 2019
4.1 Introduction ... 4-1 4.2 Study areas and data ... 4-4
4.3 Research methods, variables and selection ... 4-6 4.3.1 Research methods ... 4-6 4.3.2 Mobile-data-based population mobility variation (MBPMV) ... 4-7 4.3.3 Independent variables selection and model construction ... 4-8 4.4 Results ... 4-11
4.4.2 Semiparametric geographically weighted regression (SGWR) model results ... 4-16 4.5 Summary ... 4-23
Reference ... 4-25
Chapter 5. Empirical Analysis on the Mechanism of Population Mobility
Promoting Urban Development in China
5.1 Introduction ... 5-1 5.2 Study area, methods and materials ... 5-4 5.2.1 Study areas ... 5-4
5.2.2 variable selection and research data ... 5-5 5.3 Empirical analysis of population mobility promoting urban development ... 5-9 5.4 Transmission mechanism and robustness test of population mobility promoting urban
development ... 5-14 5.4.1 Transmission mechanism of population mobility promoting urban development ... 5-14 5.4.2 Robustness test of population mobility promoting urban development ... 5-15 5.4.3 Heterogeneity analysis of population mobility promoting urban development ... 5-17
5.1 Summary ... 5-18
Reference ... 5-20
Chapter 6. Spatiotemporal dynamics of population mobility and mechanism
analysis at street block scale: A case study in Qingdao, China
6.1 Introduction ... 6-1 6.2 Study areas and data ... 6-4
6.2.1 Study areas ... 6-4 6.2.2 Research data ... 6-4 6.3 Methods ... 6-8 6.4 Results ... 6-11
6.4.1 Spatiotemporal patterns of urban vitality ... 6-11 6.4.2 Impacts of urban built environment on urban vitality ... 6-14 6.5 Summary ... 6-19
Reference ... 6-21
Chapter 7. Conclusion
Fig. 1-1 Urban and rural population of the world, 1950-2050 ... 1-1 Fig. 1-2 Urban and rural population as proportion of total population ... 1-2 Fig. 1-3 Percentage of population in urban and rural areas in China ... 1-3 Fig. 1-4 Growth rate of the percentage urban, 1950-2018 ... 1-3 Fig. 1-5 Urban population by size class of urban settlement in China ... 1-4 Fig. 1-6 The scale and average annual change rate of population mobility in China ... 1-4 Fig. 1-7 The volume and average annual change rate of GDP in China ... 1-5 Fig. 1-8 The changing process of population mobility structure, scale and policy ... 1-9 Fig. 1-9 Trajectory map of population mobility across regions based on mobile phone signaling data ... 1-11 Fig. 1-10 Real time distribution map of urban population based on location service ... 1-11 Fig. 1-11 Chapter name and basic structure ... 1-17 Fig. 1-12 Brief chapter introduction... 1-17
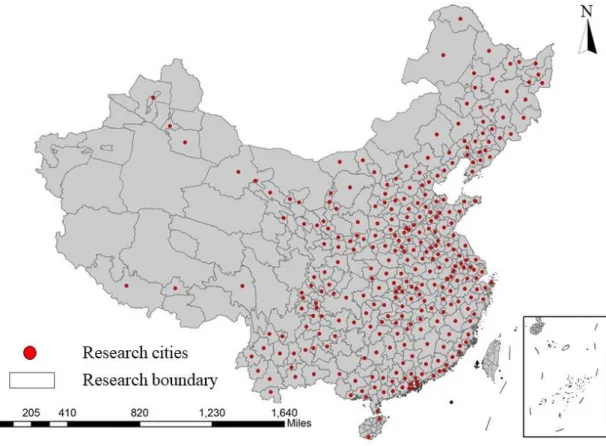
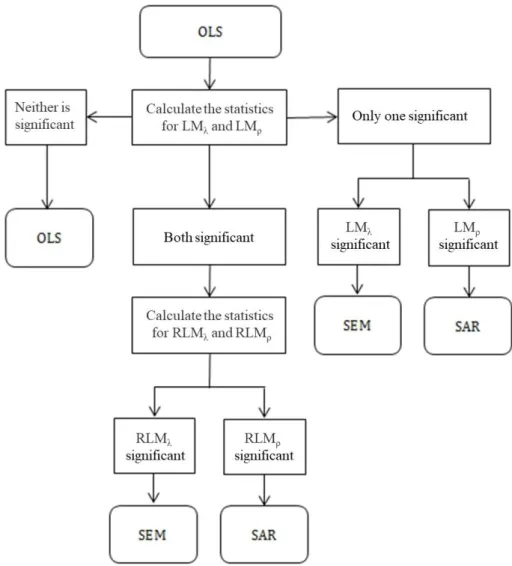
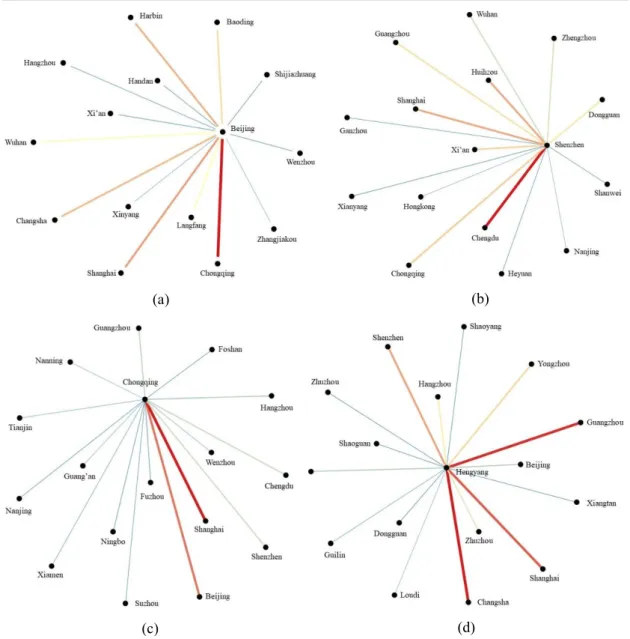
Fig. 2-1 The distribution of China’s prefecture level cities in this paper ... 2-7 Fig. 2-2 200m fishnet in main urban area of Qingdao, China ... 2-8 Fig. 2-3 Three spatial autocorrelation types and samples ... 2-9 Fig. 2-4 Sample of autocorrelation analysis report in GIS ... 2-10 Fig. 2-5 The selection process and criteria of the spatial error model and the spatial lag model . 2-14 Fig. 2-6 Main population direction and intensity in four sample cities before and after the Spring Festival ... 2-25
Fig. 3-1. Research areas in this study ... 3-3 Fig. 3-2 Flow chart of the research ... 3-4 Fig. 3-3 The scale of net population migration of prefecture-level cities in China in 2000 ... 3-8 Fig. 3-4 The scale of net population migration of prefecture-level cities in China in 2010 ... 3-8 Fig. 3-5 The scale of net population migration of prefecture-level cities in China in 2018 ... 3-9 Fig. 3-6 Scale and average annual growth rate of population immigration in China’s prefecture-level cities from 2000 to 2010 ... 3-11 Fig. 3-7 Scale and average annual growth rate of population emigration in China’s prefecture-level cities from 2000 to 2010 ... 3-12 Fig. 3-8 Scale and average annual growth rate of population immigration in China’s prefecture-level
cities from 2010 to 2018 ... 3-13 Fig. 3-9 Scale and average annual growth rate of population emigration in China’s prefecture-level cities from 2010 to 2018 ... 3-14 Fig. 3-10 Changes in population migration of prefecture-level cities in China from 2000 to 2010 and 2010 to 2018 ... 3-15 Fig. 3-11 Global Moran’I statistics from 2000 to 2010... 3-17 Fig. 3-12 Global Moran’ I statistics from 2010-2018 ... 3-17 Fig. 3-13 Local Moran’I statistics from 2000 to 2010 ... 3-18 Fig. 3-14 Local Moran’I statistics from 2010 to 2018 ... 3-18 Fig. 3-15 Local R2 based on SGWR model from 2010 to 2018 ... 3-22 Fig. 3-16 Local estimated coefficient of wage level ... 3-23 Fig. 3-17 Local estimated coefficient of transport ... 3-24 Fig. 3-18 Local estimated coefficient of health ... 3-24 Fig. 3-19 Local estimated coefficient of air pollution ... 3-25 Fig. 3-20 Local estimated coefficient of government financial pressure ... 3-26 Fig. 3-21 Local estimated coefficient of migration control policy ... 3-26
Fig. 4-1 Research areas in this chapter ... 4-5 Fig. 4-2 Flow chart of this research ... 4-6 Fig. 4-3 Population inflow and outflow of cities before Spring Festival ... 4-7 Fig. 4-4 Population inflow and outflow of cities after Spring Festival ... 4-8 Fig. 4-5 The bivariate relationship between the intensity of population mobility in the two time periods of all the cities ... 4-11 Fig. 4-6. Grading map of the net flow of population during the Spring Festival ... 4-13 Fig. 4-7. hierarchical map of cities in population mobility network ... 4-13 Fig. 4-8 Distribution map of network community structure ... 4-15 Fig. 4-9 Local R2 based on SGWR model ... 4-18
Fig. 4-10. Local estimated coefficient of value-added secondary and tertiary industry ... 4-20 Fig. 4-11. Local estimated coefficient of foreign capital ... 4-20 Fig. 4-12. Local estimated coefficient of value-added primary industry ... 4-21 Fig. 4-13. Local estimated coefficient of average wage ... 4-22
Fig. 5-1 GDP and growth rate of YRD Urban Agglomeration from 2005 to 2017 ... 5-4 Fig. 5-2 Population volume and growth rate of YRD Urban Agglomeration from 2005 to 2017 .. 5-4 Fig. 5-3 Location of the research area ... 5-5 Fig. 5-4 The scale of population mobility and economic development with mega cities (Shanghai) in YRD urban agglomeration from 2005 to 2017 ... 5-9
Fig. 5-6 The scale of population mobility and economic development with medium-sized cities in YRD urban agglomeration from 2005 to 2017 ... 5-10 Fig. 5-7 The scale of population mobility and economic development with medium-sized cities in YRD urban agglomeration from 2005 to 2017 ... 5-11
Fig. 6-1. Study area: Qingdao, China (QCA: Qingdao central area; QMA: Qingdao municipal area) ... 6-4 Fig. 6-2. (a) Analysis grid in the central area of Qingdao. (b) Building footprints in the central area of Qingdao. (c) Road network in the central area of Qingdao ... 6-6 Fig. 6-3 Research flow chart of this chapter ... 6-9 Fig. 6-4 Urban vitality in Qingdao central area (during daytime on weekdays) ... 6-11 Fig. 6-5. Urban vitality in Qingdao central area (during nighttime on weekdays) ... 6-12 Fig. 6-6. Urban vitality in Qingdao central area (during daytime on weekends) ... 6-12 Fig. 6-7 Urban vitality in Qingdao central area (during nighttime on weekends) ... 6-13 Fig. 6-8 Global spatial autocorrelation of urban vitality. (a) UVDW. (b) UVNW. (c) UVDE. (d) UVNE ... 6-13
CONTENTS OF TABLES
Table 2-1. Four kennel type options available in the software of GWR4 ... 2-6 Table 2-2. Sample data of the Tencent location big data (after processed) ... 2-25
Table 3-1. The detailed information of the explanatory variables in this research... 3-5 Table 3-2. The results of VIF and correlation test of the variables ... 3-6 Table 3-3. Types of cities based on population migration ... 3-16 Table 3-4. Accuracy evaluation for the OLS, GWR and SGWR model ... 3-19 Table 3-5. Summary of the global regression model output from 2000 to 2010 ... 3-19 Table 3-6. Summary of the global regression model output from 2010 to 2018 ... 3-20
Table 4-1. Variance inflation (VIF) and correlation coefficient of all independent variables ... 4-9 Table 4-2. Details of the dependent and independent variables ... 4-9 Table 4-3. Different city types based on population inflow and outflow statistics ... 4-12 Table 4-4. Summary of the city’s hierarchy in population mobility network... 4-14 Table 4-5. Summary of the city’s community structure ... 4-15 Table 4-6. Summary of OLS, GWR, and SGWR model outputs ... 4-16 Table 4-7. Summary of the global regression model outputs ... 4-17 Table 4-8. Summary of the SGWR model estimation coefficients ... 4-17
Table 5-1. City classification in the YRD urban agglomeration ... 5-5 Table 5-2. Description of all variables in this chapter ... 5-8 Table 5-3. Benchmark regression and panel model selection ... 5-13 Table 5-4. An empirical analysis on the transmission mechanism of regional economic growth affected by population mobility ... 5-14 Table 5-5. Robustness test of benchmark model and extended model ... 5-16 Table 5-6. Analysis of the Heterogeneity of population mobility on economic growth... 5-17
Table 6-1. Categories of POIs ... 6-5 Table 6-2. Descriptive statistics for the variables in grid ... 6-7 Table 6-3. List of variables used in analysis ... 6-8
environment ... 6-15 Table 6-6. SAC model for the relationship between urban vitality on weekends and urban built environment ... 6-15
1.1 Introduction ... 1-1 1.2 Research background and significance ... 1-6 1.2.1 The complexity and diversity of urban development in China in the new era ... 1-6
1.2.2 Significant changes have taken place in population mobility in China ... 1-7 1.2.3 The potential of emerging big data in spatiotemporal behavior research ... 1-10 1.2.4 Research significance ... 1-12 1.3 Review of previous study ... 1-14 1.3.1 Study on the urban development ... 1-14 1.3.2 Study on the population mobility and its relationship between urban development ... 1-14 1.4 Purpose and content overview of this study ... 1-17
1.1 Introduction
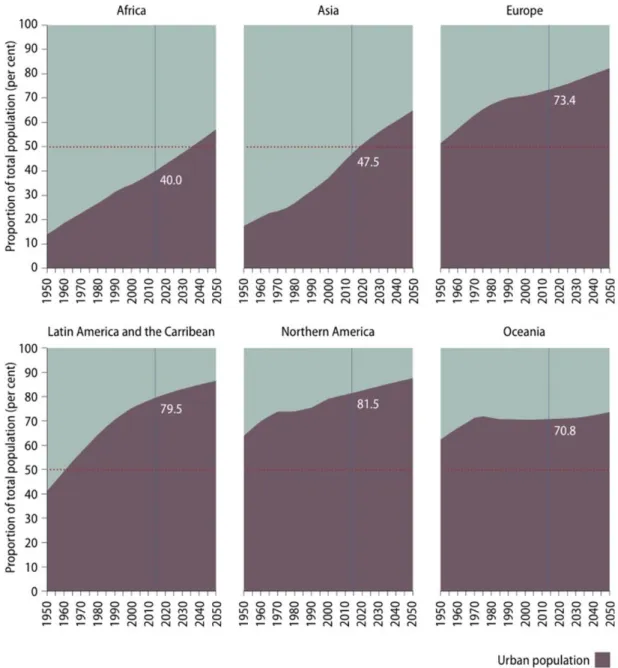
Urban development is a complex system, initially proposed by demography experts, and urbanization is a direct external indicator to measure urban development. At present, from the global perspective, more people live in urban areas than in rural areas. In 2007, for the first time in history, the global urban population exceeded the global rural population, and the world population has remained predominantly urban thereafter (Fig. 1-1) [1]. The planet has gone through a process of rapid urbanization over the past six decades. In 1950, more than two-thirds (70 percent) of people worldwide lived in rural settlements and less than one-third (30 percent) in urban settlements. In 2014, 54 percent of the world’s population is urban. The urban population is expected to continue to grow, so that by 2050, the world will be one-third rural (34 percent) and two-thirds urban (66 percent), roughly the reverse of the global rural-urban population distribution of the mid-twentieth century [2].
However, levels of urbanization vary greatly across regions. In 2014, high levels of urbanization, at or above 80 percent, characterized Latin America and the Caribbean and North ern America. Europe, with 73 percent of its population living in urban areas, is expected to be over 80 percent urban by 2050 (Fig. 1-2). Africa and Asia, in contrast, remain mostly rural, with 40 percent and 48 percent of their respective populations living in urban areas. Over the coming decades, the level of urbanization is expected to increase in all regions (also referred to as major areas), with Africa and Asia urbanizing faster than the rest. Nevertheless, these two regions, which are projected to reach 56 and 64 percent urban by mid-century, respectively, are still expected to be less urbanized than other regions of the world. Africa and Asia are urbanizing more rapidly than other regions of the world. The rate of urbanization, measured as the average annual rate of change of the percentage urban, is highest in Asia and Africa, where currently the proportion urban is increasing by 1.5 and 1.1 percent per annum, respectively. Regions that already have relatively high levels of urbanization
Fig. 1-1 Urban and rural population of the world, 1950-2050 (Source: UN World urbanization prospects: The 2018 revision).
CHAPTER ONE: BACKGROUND AND PURPOSE OF THE STUDY
are urbanizing at a slower pace, at less than 0.4 percent annually (Fig. 4). In general, the pace of urbanization tends to slow down as a population becomes more urbanized [1].
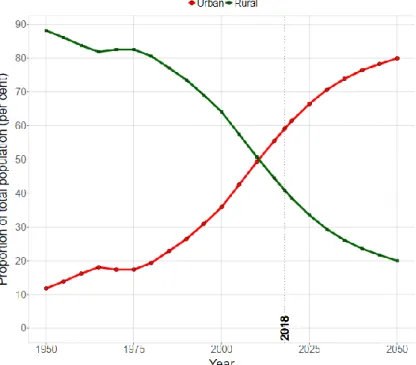
China, as the largest country in Asia and the largest developing country in the world, has attracted great attention in its domestic urban development. Before 1978, the process of urbanization in China was quite slow and even declined. Between 1950 and 1980, the urbanization rate of developing countries rose from 16.2 percent to 30.5 percent, while that of China only rose from 11.2 percent to 19.4 percent. After the reform and opening up in 1978, the national economy developed rapidly, and the influx of labor force made the urban population surge, thus accelerating the process of urbanization. Since the beginning of the 21st century, China’s urbanization rate has grown at an average annual rate of over 1%, much higher than the Asian average (Fig. 1-3 and Fig. 1-4).
Fig. 1-2 Urban and rural population as proportion of total population (Source: UN World urbanization prospects: The 2018 revision).
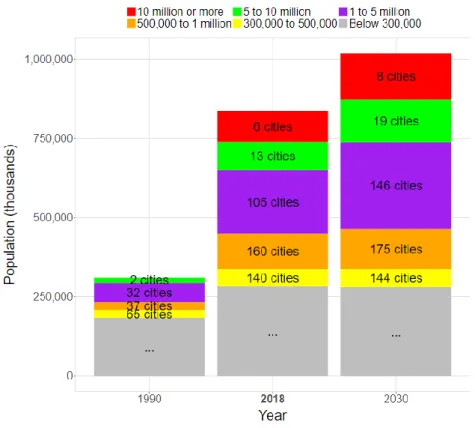
Urbanization has also led to significant changes in the number of cities in China. In 1990, China had no megacities with a population of more than 10 million, and the number of large, medium-sized, and small cities was 2,32, and 37, respectively. However, by 2018, China has six cities with a population of more than 10 million, and the number of large cities, medium-sized cities and small cities has reached 13,105 and 160 respectively. It can be predicted that whether from the perspective of urbanization rate or the number of cities, there is still a huge space for China’s urban development in the future, which will also become the most noticeable problem (Fig. 1-5) [3, 4].
Fig. 1-3 Percentage of population in urban and rural areas in China (Source: UN World urbanization prospects: The 2018 revision).
Fig. 1-4 Growth rate of the percentage urban, 1950-2018 (Source: UN World urbanization prospects: The 2018 revision).
CHAPTER ONE: BACKGROUND AND PURPOSE OF THE STUDY
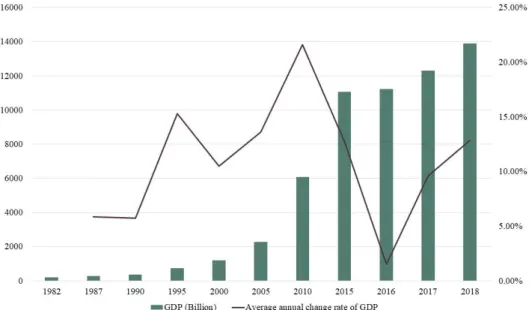
Different from western countries such as Europe and the United States, China’s urbanization process has its own uniqueness. In the past 40 years, the flow of population from rural to urban areas and between regions has provided continuous impetus for the progress of China’s economic and social development and the process of urbanization. Hundreds of millions of floating populations have realized China’s urbanization through the way of “population flow”. It can be said that China’s “economic miracle” has been supported by large-scale population mobility and aggregation in the past (Fig. 1-6, 1-7) [5].
Population is the main body of economic activities, and labor force is an important element of economic development. As a barometer of the rise and fall of cities, population is not only the
Fig. 1-5 Urban population by size class of urban settlement in China (Source: UN World urbanization prospects: The 2012 revision).
Fig. 1-6 The scale and average annual change rate of population mobility in China.
builders, producers and consumers of cities, but also the creators of new knowledge, the disseminators of new ideas and the applicators of new technologies. As the core of urban development, population mobility and aggregation have a significant impact on national economic geography, urban morphology and production mode, which is also the focus of urban economics and urban geography research [6, 7]. Cross regional population flow provides sufficient labor force for the development of the city, which is directly reflected in the rapid development of urban economy. At the same time, the rapid development of cities has become the “thrust” of population inflow, which continues to attract the input of labor force. Therefore, it is of great strategic significance to study the interactive relationship between population mobility and urban development for promoting the current urbanization process and maintaining the balanced development among regions.
CHAPTER ONE: BACKGROUND AND PURPOSE OF THE STUDY
1.2 Research background and significance
1.2.1 The complexity and diversity of urban development in China in the new era
Since the founding of the People’s Republic of China, especially since the reform and opening up, China has experienced the fastest economic development and the most profound changes in its history, among which the large-scale mobility of population and labor force is one of the most important changes. At present, population mobility has become an important issue in regional economy and urban development, and the large-scale population mobility in China has become the focus of attention.
People are increasingly aware of the close relationship between population mobility and urban development. The expansion of population mobility has not only improved the regional economy, but also accelerated the urbanization process. However, different from developed countries, population mobility in China is restricted by multiple factors such as economic level, social structure and household registration system, showing certain complexity [8]. In addition, foreign views on population mobility and urban development are mainly used to explain the relationship between spontaneous population migration and economic and social development under the condition of full market economy, which cannot be fully applied to the conditions in China.
People oriented new urbanization has become the focus of national strategy. In the previous paper, based on historical data, we found that compared with developed countries in the world, China’s urbanization level is not only low, but also low quality. In 2014, China’s urbanization level just reached the world average level, while the urbanization rates of Japan, Britain, South Korea, the United States, France and Germany were 93%, 82%, 82%, 81%, 79% and 75%, respectively [2]. In addition, due to the restrictions of China’s unique household registration system, many floating populations cannot enjoy the same treatment as urban residents, thus forming the “semi-urbanization” [9]. If the urbanization rate is counted according to the urban household registration population, in fact, China’s urbanization level is only about 40%, which is much lower than that of developed countries [10]. It can be seen that China’s urbanization level still has a large room for improvement in the future. To improve the quantity and quality of urbanization in the future will be a major practical problem faced by urban development, and it will also be the focus of multiple concerns.
In the 21st century, the macro background of urban development in China has changed, and the domestic and international economic situation has created new requirements for urban development. At the same time, it is also urgent to solve many social, environmental and ecological problems arising in the process of urbanization. Although the new urbanization emphasizes people-centered, insufficient attention has been paid to the interaction between population mobility and urbanization. Previous studies mainly focused on population agglomeration to cities, but ignored the location of agglomeration, which is of great significance to urban development, especially the urbanization process. Urban development and population mobility as a multi-dimensional complex social space
process, it is necessary to carry out in-depth research from the perspective of multiple levels and two-way interaction.
1.2.2 Significant changes have taken place in population mobility in China
Since the 1980s, China’s population mobility policy has gone through three stages. The first stage, from 1984 to the beginning of the 21st century, belongs to the stage of gradual opening up. Since 1984, farmers were allowed to work and do business in towns and market towns below the county level. The reform of citizenship management and food supply system also facilitated the flow of population. After the 1990s, the number of floating populations increased rapidly. At this stage, the policy of population mobility has been relaxed to a certain extent, but the degree is very limited, and it is mainly promoted by the central government from the top to the bottom, and the enthusiasm of local governments to support population mobility is not high [11].
From 2003 to 2012, it belongs to the stage of fair treatment of population mobility. In the 21st century, the concept of fair treatment of floating population has been put forward and implemented in this period, and a series of important changes have taken place in relevant policies. In 2006, the State Council issued the first systematic document on the issue of migrant workers, “some opinions on solving the problem of migrant workers”, which put forward the basic principle of “fair treatment and equal treatment”. In May 2012, the State Council issued the “12th Five Year Plan” of the national basic public service system, which provided a reliable system guarantee for the floating population to enjoy equal basic public services.
Since 2012, it belongs to the third stage, which is the stage of comprehensively promoting citizenization. The government report put forward “accelerating the reform of registered residence system, promoting the citizenization of agricultural transfer population in an orderly way, and striving to achieve the full coverage of the permanent resident population of urban basic public services”. In March 2014, the CPC Central Committee and the State Council issued the national new urbanization plan (2014-2020). Subsequently, the State Council issued the “opinions on further improving the service for migrant workers” and “opinions on further promoting the reform of registered residence system”. The policy framework for solving the floating population problem is clearer, and the sense of gaining and happiness of floating population is growing. The report of the 19th National Congress of the Communist Party of China further emphasizes breaking down the barriers hindering the flow of population and promoting the development of citizenization. It particularly requires that “the drawbacks of the system and mechanism hindering the social flow of labor force and talents be removed, so that everyone has the opportunity to realize their own development through hard work”.
At the same time, the current status of population mobility in China has also changed significantly. Since the 1980s, the change process of the scale of population mobility in China can be roughly divided into three periods: The first period was from the early 1980s to the early 1990s. With the release of the notice on the issue of farmers entering market towns and settling down, the state
CHAPTER ONE: BACKGROUND AND PURPOSE OF THE STUDY
relaxed the restrictions on the rural population entering small and medium-sized cities and towns to promote the rural population’s rural-urban transfer. China’s population mobility scale increased from 6.57 million in 1982 to 21.35 million in 1990, with an average annual growth of about 7%. In the second stage, from 1990 to 2010, the scale of population mobility increased at a faster speed, from 21.35 million in 1990 to 221.43 million in 2010, with an average annual growth of about 12%. The third stage is from 2010 to now, which is relatively mild. The growth rate of population mobility scale from 2010 to 2015 has decreased significantly, with an average annual growth of about 2%. Since 2015, new changes have taken place in the development of the population mobility. In 2015, the National Bureau of Statistics announced that the scale of population mobility in China was 247 million, down about 6 million compared with 2014; in 2016, the scale of floating population decreased by 1.71 million compared with 2015, and continued to decrease by 820000 in 2017.
In addition to the significant changes in the policy and scale of population mobility, the problems hidden behind the population mobility began to surface. Among them, the elderly population flow, children population flow and left behind children become the focus of attention. Among the population mobility, the scale of the elderly floating population has increased rapidly since 2000, from 5.03 million in 2000 to 13.04 million in 2015, with an average annual growth of 6.6%. The proportion of middle-aged and elderly floating population in China increased slightly from 2000 to 2015, 4.9% in 2000 and 5.3% in 2015.
Similar to the growth of floating population, the scale of migrant children in China has also experienced a transition from rapid growth to steady decline. From the overall scale, the total number of migrant children increased from 2.54 million in 1982 to 35.81 million in 2010, and then decreased. In 2015, the total number of migrant children was 34.26 million, which was 1.55 million lowers than that in 2010, with a decrease rate of about 4%. This is in contrast with the change direction of the national floating population, which increased by nearly 12% from 221 million to 247 million from 2010 to 2015. According to the sample data of the sixth population census of China in 2010, there are 61.255 million left behind children in rural areas, accounting for 37.7% of rural children and 21.88% of national children. Since 2010, the state has successively introduced a series of policies to solve the problems of left behind children in the population mobility. As of 2018, the number of left behind children in China is still close to 7 million (Fig. 1-8).
Fi g. 1 -8 T he c ha ngi ng proc es s of popu la ti on m ob il ity s tru ct ure , s ca le a nd pol ic y.
CHAPTER ONE: BACKGROUND AND PURPOSE OF THE STUDY
1.2.3 The potential of emerging big data in spatiotemporal behavior research
Population census and 1% population sampling survey are the most important data sources in the study of population mobility [12]. However, the data format restricts the spatial and temporal accuracy of the study. In the time dimension, population mobility is a large-scale social behavior with significant diversity in the process of time and space. The format of census data leads to the limitation of two-dimensional static perspective of related research. Due to the lack of a relatively complete data of population mobility in a relatively complete time, the current research results in the average situation of population spatial distribution pattern in different stages, which further leads to the fact that the specific links, evolution rules, spatial effects and influencing factors in the process of China’s population mobility pattern have not been fully revealed for a long time. On the other hand, the 10-year census also has obvious time lag under the background of rapid urbanization in China.
In the spatial dimension, the accuracy of the research is improved through sampling survey and questionnaire survey in the meso scale [13]. The decision-making factors, social effects and spatial differences of micro themes are discussed in depth. However, the sampling survey brings fine research, but there are also some problems, such as the selection of research object is one-sided, regional aggregation and so on. Therefore, this kind of research is enough as an empirical analysis of local areas, and has insufficient explanatory power to the macro characteristics. At the macro scale, previous research conclusions such as: China’s floating population shows the obvious characteristics of flowing from Anhui, Henan, Sichuan, Hunan, Guangxi and other central and western regions to the eastern coastal areas, and has formed the Yangtze River Delta, the Pearl River Delta, Beijing Tianjin Hebei and other highly concentrated floating population areas. This is not only an academic consensus, but also a common-sense cognition of the society [14, 15]. However, from the perspective of the spatial characteristics of China’s population flow, the key points of the study are how the floating population changes in the process of aggregation and diffusion in the places of immigration and emigration, and the relationship between the them.
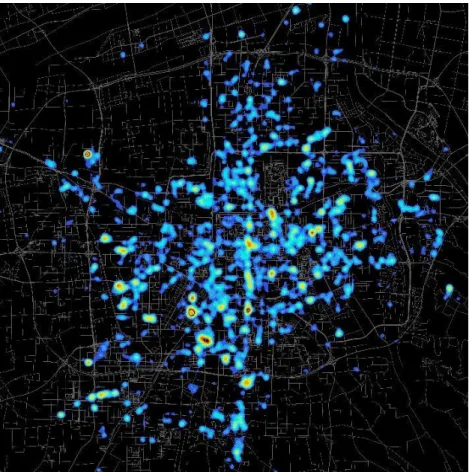
The emergence of emerging big data makes it possible to obtain human movement patterns from massive spatiotemporal trajectories based on individual granularity. The development of GPS, LBS and other technologies provides technical support for the observation of spatiotemporal characteristics of large-scale population behavior. Although there are significant uncertainties in human social activities, the data based on large-scale, large sample, dynamic space-time and relational positioning make the huge amount of human activities have rules to follow at the overall level [16, 17]. The big data with individual granularity spatiotemporal markers (including mobile phone call data, bus card data, social networking site check-in data, taxi track data, etc.) and the highly accurate spatiotemporal information of people, time and place in it provide sufficient research samples and precision for the research on population mobility. Based on this, this paper will try to combine the new big data to study the interaction between population mobility and urban
development. Figs. 1-9 and 1-10 show the cross regional trajectory of population and the urban
Fig. 1-9 Trajectory map of population mobility across regions based on mobile phone signaling data.
Fig. 1-10 Real time distribution map of urban population based on location service.
CHAPTER ONE: BACKGROUND AND PURPOSE OF THE STUDY
population distribution map at a specific time based on mobile phone data. 1.2.4 Research significance
Urban development usually refers to the change and growth process of the status, role, attraction and radiation force of a city in a certain region, and it is also a process to meet the multi-level population growth. Generally speaking, the progress of economic level reflects the growth of “quantity” of cities, while the level of urbanization reflects the improvement of “quality” of cities. Previous studies also measure the development of a city from its economic level and urbanization level. However, the development of the city is a complex dynamic process, both external development and internal development. Although economy and urbanization can represent urban development to a certain extent, they are still not comprehensive enough. The progress of urban level should be reflected in the “soft power” of the city, such as the supply of public services and the planning and construction of the city. In this paper, we build the multi-scale analysis model, respectively from the macro, meso and micro perspective to investigate the population mobility and interactive relationship of urban development, this aspect can start from the external environment for the development of the city, especially urbanization provides the result of empirical analysis, at the same time, emphasize the inner cities “soft power” on the appeal of the important role that highlights the importance of the city in terms of population mobility.
As we all know, there is a two-way relationship between population mobility and urban development. The large-scale inflow of population promotes the growth of regional economy and makes cities develop rapidly. At the same time, the developed cities become the destination of other floating population. In the long run, the relationship between population mobility and urban development has become more and more complex. Previous studies only based on macro statistical data, or investigate the impact of population mobility on urban development, or analysis of the attractiveness of urban development to population mobility, but lack of systematic and comprehensive understanding. This paper examines the two-way impact of population mobility and urban development, and focuses on the impact of urban development on population mobility, aiming to provide some data reference for the development of cities in that the population mobility scale decline.
At the same time, compared with the previous official data channels such as census, statistical yearbook and sampling survey, this paper attempts to use the emerging big data to study the spatial pattern of population mobility in China, which has expanded the previous research perspective and has certain practical value. we used the spatial econometric model to analyze the interaction between population mobility and urban development after considering the spatial effect of spatial data, which provides a new way for the research of the current urbanization process. Urban development, urbanization and population mobility are the key research topics in urban geography, demography, urban economics and other disciplines. For China, which is transformed under the background of globalization, information and rapid urbanization, the spatial pattern change of floating population
is not only shaping the spatial pattern of Chinese population for a long time, but also has a significant impact on the process of urbanization in China. It is of great practical significance to study the special phenomenon of population flow by combining various data and systematically for understanding the evolution trend of urbanization development in China and guiding the future urban construction and urban policy making. As an important part of global economic and regional development issues, population mobility has become the core issue of concern for scholars, policy makers and urban planners.
CHAPTER ONE: BACKGROUND AND PURPOSE OF THE STUDY
1.3 Review of previous study 1.3.1 Study on the urban development
As a separate object, urban development is mainly studied from the perspective of urbanization. As we all know, in the past few decades, the world is experiencing rapid urbanization, especially in China [18, 19]. With the continuous migration of urban and rural population and the continuous expansion of cities, more and more megacities and big cities have emerged in China [20, 21]. However, the urbanization level of different cities in China is quite different. With the rapid development of urbanization and modernization, urban built-up land has been replaced by natural landscape, resulting in a series of “urban diseases”, such as water pollution, air pollution, greenhouse gas increase, fossil fuel energy consumption increase, urban heat island and traffic congestion [22-24]. Therefore, urbanization does not appear alone, but is accompanied by a series of environmental problems from the perspective of urbanization [25-27]. With the close economic ties and transportation, regional studies based on urban agglomerations have gradually replaced single cities and become the focus of research, such as Beijing Tianjin Hebei urban agglomeration, Yangtze River Delta urban agglomeration and Pearl River Delta urban agglomeration [28].
As a complex urban problem, urbanization cannot be evaluated only by population [29]. Economic and social factors are the important contents of evaluating urbanization and quantifying urban development [30-33]. At present, many studies start from the evaluation system of regional urbanization, trying to use AHP, fuzzy comprehensive evaluation method, entropy method and gray correlation method to comprehensively compare the level of regional urbanization [34-37]. In the urbanization coupling coordination model, population, economic development and social development are regarded as three independent and integrated subsystems, which are nonlinear and interactive. They are widely used as a new standard to judge the level of urbanization [38].
1.3.2 Study on the population mobility and its relationship between urban development
In the research on the interaction between population mobility and urban development, many scholars have studied the attraction of economic development of destination cities to population mobility from the perspective of economic benefits. Many influential theories and methods have been proposed to explain the origin, mechanism and development of population migration. The representative theories include “immigration law”, “push-pull theory”, “macro-neoclassical theory”, “micro-neoclassical theory”, “equilibrium theory” and Lewis-Fei-Ranis model. Ravenstein’s immigration law first proposed civilized laws and regulations related to population migration, and systematically analyzed the phenomenon of population migration from the aspects of migration reasons, distance and characteristics [39]. Bogue [40] tries to use push-pull theory to explain the internal mechanism of population migration from the the aspects of convenient employment, familiar social network, high-risk unemployment rate and so on. Macro-neoclassical theory holds that the expected income level of the future destination is the main driving force of population migration [41, 42]. Micro-neoclassical theory abstracts population migration as a form of capital
investment, which aims to maximize personal interests [43]. The equilibrium theory emphasizes that the amenities (environment, service and living) of the destination are more likely to have an impact on population migration than the income differences among regions [44, 45]. The structural approach that originated in the Lewis-Fei-Ranis model [41, 42] is another method to study population migration [46]. This approach emphasizes the importance of labor market segmentation, unbalanced economic opportunities and the background of immigration system. Compared with the previous migration theories, the structural approach highlights the influence of national institutional factors and emphasizes that state intervention has a great impact on internal migration [47, 48].
Recent studies have also highlighted the impact of urban amenities, public services, social integration and subjective feelings of migrants on regional migration [49-54]. The migration of “lifestyle” and “social relations” has been growing steadily, but in the case of little difference in economic level, family factors (such as family size), social factors (such as industry, social security) and social network factors have gradually become the focus of attention [55-57]. It can be seen that with the deepening of the research, in addition to the development of urban economy, the social development of the city also has a greater impact on the regional population mobility.
A large amount of papers has studied the phenomenon and mechanism of population migration in China since the reform and opening up. Due to China’s unique institutional factors and economic development process, macroeconomic development and national institutional intervention have become the two most in-depth and comprehensive research areas.
Economic factors also play an important role in promoting China’s population migration [58, 59]. The coastal development strategy, reform and opening policy allow some areas to be developed first, thus the regional development focus is shifted to the southeast coastal areas. After making full use of the advantages of location and technology, the rapid economic growth has appeared in the Pearl River Delta, Yangtze River Delta and Beijing-Tianjin-Hebei region, which makes the regional development gap between the eastern, central and western regions more and more large, so there is an obvious phenomenon of inter-provincial migration [60-63]. The continuous improvement of economic conditions has brought more opportunities for immigrants in the above-mentioned areas and has become the preferred destination for population migration [64]. After the 21st century, with a series of problems, such as economic transformation, industrial upgrading and investment costs, labor-intensive industries began to transfer to the central and western regions, which to a certain extent attracted the population migration, while the eastern coastal areas, relying on the high-end industries and service industries, has an advantage in attracting technical talents [65].
However, with the reduction of population mobility scale, the change of population mobility structure and various problems in the process of urbanization, regional economy has no longer become the only factor to attract population inflow. Recent studies have pointed out that changes in inhabitant environment can also affect population migration between regions. Lin, Zhu, Ke and Wang [54] explored the impact of urban basic public services on population migration in eastern 6 provinces based on micro-survey data. Jianan [52] and Wang [50] emphasized that the social
CHAPTER ONE: BACKGROUND AND PURPOSE OF THE STUDY
integration of migration destinations is an important factor affecting population migration. In addition, individual factors, family factors and social network factors can affect the regional population migration [55-57, 66]. For the first and second tier cities, housing prices, air quality and traffic conditions are increasingly becoming the important indicators of their immigration destinations [67]. However, we still don’t know the changes of these factors in spatial and temporal dimension.
In addition to inter-city and inter-regional population mobility, intra-city population mobility is also noteworthy. The population mobility between different regions within a city usually reflects the urban vitality. With the emergence of emerging big data, urban vitality characterized by urban residents' activity trajectory has become the focus of research. Mobile phone data, location-based service (LBS) data, social media data, and geotagged data, have provided significant advantages, allowing us to capture the dynamic interaction between residents and urban spaces. The research based on the above data sources have been widely conducted in urban space, like Long and Zhou [68]used mobile phone data, Li, et al. [69]used mobile phone positioning records, Wu, et al. [70] combined GPS tracking data, Zheng, et al. [71] adopted catering establishment data and Shen and Karimi [72] used housing price records. These new datasets can generate specific images of urban vitality, allowing us to explore the characteristics and internal mechanism of urban vitality from many aspects.
The multi-source data mining, which reflects the trajectory of population mobility and population information, provides data support for us to study the interaction between population mobility and urban development at different scales. Data sources with different precision are selected in different research scales. For example, at the national scale, the support of national statistical yearbook and Tencent location big data provide guarantee for us to study population mobility and urban development at a macro scale. At the local level, with the help of the heat map data reflecting the real-time population distribution and the questionnaire data for the floating population, we can explore the relationship between population mobility and urban development from the perspective of urban planning design and urban development policies.
1.4 Purpose and content overview of this study
This study focuses on the interactive relationship between population mobility and urban development in China. In particular, we not only focus on population mobility between cities, but also use emerging big data to depict the current situation of population mobility within cities. On this basis, the bidirectional relationship between population mobility and urban development is studied on different scales. We are particularly concerned about the changing attractiveness of urban development to mobility, which is crucial to China’s future urbanization process. At the same time, we also emphasize how urban planning and design can influence population mobility in the region in order to guide the healthy development of cities. The chapter names and basic structure of this study are shown in Fig. 1-11. The brief chapters are shown in Fig. 1-12.
Fig. 1-11 Chapter name and basic structure.
CHAPTER ONE: BACKGROUND AND PURPOSE OF THE STUDY
In Chapter 1, research background and purpose of the study:
Since the reform and opening up, China’s population mobility has greatly promoted the development of regions and cities. However, with the change of China’s population structure, the prominent problems in the process of urbanization and the change of population mobility, China’s demographic bonus is gradually decreasing. Therefore, we need a comprehensive and systematic description of the interaction between population mobility and urban development. Previous studies have suggested that large-scale population mobility has changed regional economy and promoted urban prosperity. However, previous studies are more based on unilateral analysis. Population mobility and urban development are a process of mutual influence. Only considering the single link in the analysis will inevitably make the analysis incomplete. At the same time, the correction of population mobility within the city should be concerned, because it can put forward new suggestions from the perspective of urban planning. Therefore, after introduced the research background, we reviewed the previous research literature. Finally, we proposed the purpose of this study and expounded the research content.
In Chapter 2, research methods and data description:
Firstly, the concept and application of GIS was introduced. Secondly, we introduced the spatial analysis method based on GIS, that is exploratory spatial data analysis method. Because of the spatial effect of population mobility and urban development, we used spatial econometric model to explore the urban development factors that affect population mobility. In particular, we also introduced the social network analysis method and the logistic regression model, which are used to identify the spatial and temporal patterns of population mobility, and the empirical analysis based on the survey data. Finally, we introduced the data used in this paper in detail, including official statistics data, Tencent location big data, Baidu heat map data and national migrant population dynamic monitoring survey data.
In Chapter 3, spatiotemporal patterns and driving forces of population mobility in China during 2000-2018:
In the third chapter, we systematically summarize and sort out the population mobility in China in the past, especially supplement the changes of population mobility pattern after 2010. With the help of national official statistics, we describe the change characteristics of China’s cross regional population mobility from 2000 to 2010 and from 2010 to 2018. At the same time, we empirically analyze the impact of urban development on population mobility and its change process from three different aspects of urban development, namely, public policy, social economy and inhabitant environment. Our results show that China’s cross regional population mobility presents different spatial and temporal patterns in the above two periods. Although the scale of population mobility in the eastern region is still the largest, with the rise of the central and western regions and industrial migration, the growth rate of the increase shows a significant downward trend. At the same time,
the provincial capital cities and the first and second tier cities in the central and western regions have become new destinations for population mobility. Our results also show that the impact of urban development on population mobility is different in different time periods. Before 2010, the economic level of cities was the main driving force to attract population inflow. However, with the change of population structure in China, the impact of public policies and inhabitant settlements on population mobility seems to be greater.
In Chapter 4, spatiotemporal patterns and determinants of population mobility in China during Spring Festival of 2019:
In this chapter, we try to describe the spatiotemporal network of population mobility by combining Tencent location big data with high spatial and temporal resolution. Specifically, compared with the official statistics, Tencent location big data not only ensures high accuracy in time and space, but also carries the temporal and spatial attributes of the target, which can more clearly describe the network structure of population mobility. At the same time, we limit the research time to the Spring Festival of 2019, which is the most appropriate time to study population mobility, because before and after Spring in China, a large number of people go back and forth between work place and home. With the help of location big data, this phenomenon can be easily captured. The analysis results show that the population mobility presents a spatial structure of “two horizontals and three verticals”. The major cities in the four urban agglomerations in China occupy an absolute core position in the population mobility network hierarchy, and the population mobility forms 11 different community structures. regression model results show that population mobility is significantly related to the value-added of secondary and tertiary industries, foreign capital, average wage, urbanization rate and value-added of primary industries. when the spatial heterogeneity and non-stationarity was considered, the socio-economic factors that affect population mobility exhibited differentiation among different regions and cities. With the help of emerging big data, we successfully describe the temporal and spatial pattern of population mobility in a short period of time, making up for the limitations of official statistical data analysis. At the same time, we also empirically analyze the impact of urban development, especially urban economic development, on population mobility with the help of spatial econometric model.
In Chapter 5, empirical analysis on the mechanism of population mobility promoting urban development in China—Case study in Yangtze River Delta urban agglomeration:
In the first two chapters, we used different data sources to describe the spatial-temporal patterns of population mobility in China at the regional scale, and analyze the impact of urban development on population mobility. However, there is a certain interaction between population mobility and urban development. While urban development affects population mobility, the influx of labor forces promotes the development of regional economy. Therefore, in this chapter, we study the impact of population mobility on urban development from the city scale. In order to express the urban development intuitively, we use the GDP of the city as the index to measure the urban development,
CHAPTER ONE: BACKGROUND AND PURPOSE OF THE STUDY
and take the Yangtze River Delta urban agglomeration as the research object. Our results show that population mobility has a significant role in promoting regional economy. Specifically, for every 1% increase in population mobility scale, regional GDP will increase by 0.259%. We also found that regional population mobility promotes economic growth by transforming industrial structure, increasing residents’ consumption, increasing technological innovation and improving employment. Therefore, in this part, we empirically analyze the impact of population mobility on urban development and its transmission mechanism, which provides a supplement for the study of the interaction between them.
In Chapter 6, Spatiotemporal dynamics of population mobility and mechanism analysis at street block level:
The level of urban economy as a macro performance of urban development is discussed in the previous chapters. To some extent, urban design can also be regarded as the embodiment of urban development. Therefore, in this chapter, we focus on the street block level analysis of how urban design affects urban population mobility. We empirically analyze the impact of urban built environment (design, density, diversity, transfer distance and destination accessibility) on population mobility by combining Baidu heat map data and spatial econometric model that reflecting the change of urban population real-time distribution. Our study found that there were significant differences in the patterns of population mobility in working days, rest days, daytime and nighttime, and showed a polycentric distribution. To some extent, this reflects the characteristics of urban residents’ daily commuting. It is important that the urban built environment has a significant impact on the population mobility within the city. Specifically, the morphology of buildings, the density of road intersections, the density of urban function and the accessibility of road network can improve the population flow in the region. These analyses can help urban decision makers and planners to optimize the urban spatial layout, which has important practical significance for high-quality urban design and social welfare.
In Chapter 7, conclusion and prospects:
This part summarized the research of previous chapters. And based on the conclusions, the future research of population mobility and urban development as well as the prospect of further research are put forward.
Reference:
1. Nations, U., Revision of World Urbanization Prospects. United Nations: New York, NY, USA 2018.
2. Nations, U., World Urbanization Prospects: The 2014 Revision.: United Nations. New York. In 2018.
3. Habitat, U., State of the world's cities 2012/2013: Prosperity of cities. Routledge: 2013. 4. Nations, U., The World’s Cities in 2018‐Data Booklet. 2018.
5. Zhang, K. H.; Shunfeng, S., Rural–urban migration and urbanization in China: Evidence from time-series and cross-section analyses. China Economic Review 2003, 14, (4), 386-400. 6. Chan, K. W., China: internal migration. The encyclopedia of global human migration 2013. 7. Liang, Z., The age of migration in China. Population and development review 2001, 27, (3),
499-524.
8. Yang, Z., Floating population and urbanization. Population and economy 1996, 05, 33-38. 9. Wang, C., The Problem of Semi-Urbanization of Rural Floating Population. Sociological
research 2006, 5, 107-123.
10. Li, K., Deeply implement the strategy of expanding domestic demand in the process of reform and opening up. Seeking truth 2012, 4, 3-10.
11. Commission, N. H., China’s Migrant Population Development Report. In China Population Publishing House: Beijing, China: 2018.
12. Li, S.-M., Population migration and urbanization in China: A comparative analysis of the 1990 population census and the 1995 national one percent sample population survey. International
Migration Review 2004, 38, (2), 655-685.
13. Tian, M., Spatial moblity of agricultural transfer population and urban integration. Population
research 2013, 37, (4), 43-55.
14. Tong, Y.; Wang, Y., The Choice of China's Floating Population: Why Beijing, Shanghai and Guangzhou are so popular——An analysis based on individual costs and benefits. Population
research 2014, 39, (4), 49-56.
15. Zhang, Y.; Cen, Q., China's population spatial mobility pattern and analysis of the influencing factors of interprovincial mobility. Population research 2014, 38, (5), 54-71.
16. Long, Y.; Liu, L., Transformations of urban studies and planning in the big/open data era: A review. International Journal of Image and Data Fusion 2016, 7, (4), 295-308.
17. Yang, Z.; Long, Y., Opportunities and limitations of big data applications to human and economic geography: The state of the art. Progress in Geography 2015, 34, (4), 410-417. 18. Klugman, J., A Sourcebook for Poverty Reduction Strategies: Volume 2: Macroeconomic and
Sectoral Approaches. World Bank Washington, DC: 2002.
19. Pallagst, K., The future of shrinking cities: problems, patterns and strategies of urban transformation in a global context. 2009.
20. Chen, Q.; Song, Z., Accounting for China's urbanization. China Economic Review 2014, 30, 485-494.
21. dos Santos, A. R.; de Oliveira, F. S.; da Silva, A. G.; Gleriani, J. M.; Gonçalves, W.; Moreira, G. L.; Silva, F. G.; Branco, E. R. F.; Moura, M. M.; da Silva, R. G., Spatial and temporal distribution of urban heat islands. Science of the Total Environment 2017, 605, 946-956. 22. Foley, J. A.; DeFries, R.; Asner, G. P.; Barford, C.; Bonan, G.; Carpenter, S. R.; Chapin, F. S.;