査読論文
The Bangladesh Textile-Clothing Industry:
A Demand-Supply Review
Md. Masum
* AbstractThe objective of this research is to explore the demand side and supply side of the textile-clothing industry of Bangladesh as a background study for further research. In terms of the demand side aspects, we investigate demand forecasting, product design and development, order management with distribution, and bilateral relations. For the supply side components, we identify raw materials sourcing, cutting-making-trimming (CMT), and delivery. We describe fiber, yarn, fabric, dyeing-printing-finishing, and accessories as the backward linkages. Using input-output analysis, we discovered that the backward linkage coefficient of Bangladesh was 1.86, which is 1.37 times smaller than China. Transport and communication, public services, and port services, etc., can be identified as forward linkages. The input-output-based forward linkage coefficient of Bangladesh is 1.45, which is 22% lower than China. Comparatively, China is still unsurpassed among the Asian textile-producing nations. Although Bangladesh is doing well in terms of contract-based supply of clothing goods, the demand side needs to be developed. The demand side requires more concentration from firm owners and government to help it transition from assembly to full package production.
Keywords
Textile-Clothing Industry, Demand-Supply Chain, Input-Output Analysis, Linkages
1. The Bangladesh Textile-Clothing Industry: A Demand-Supply Review
Previous studies on the textile-clothing industry in Bangladesh have mostly focused on the supply side. The supply side deals with the cost and time efficiency of production.
* Correspondence to: Md. Masum
PhD Student, Graduate School of Economics, Ritsumeikan University and Assistant Professor of Textile Management, Bangladesh University of Textiles
1-1-1 Nojihigashi, Kusatsu, Shiga 525-8577, Japan Email: [email protected]
Whether production takes place or not, on the other hand, depends on the demand for the product.
An analysis of the demand side of the textile-clothing industry is very important because firms in Bangladesh produce clothing based on customer contracts. These customers are globally recognized brand retailers and distributors. These brand retailers are responsible for demand forecasting and for the distribution of Bangladeshi products. Firms in Bangladesh produce clothing with minimal knowledge about the ultimate users’ preferences. Therefore, a thorough discussion of the demand side is indispensable.
The supply pattern of clothing products is not the same as that of other products. This is why a vast number of research studies have focused on the supply side of the industry (Ahmed, 2004; Ali & Habib, 2012; Asgari & Hoque, 2013; Berg, Saskia, Sebastian, & Tochtermann, 2011; Islam, 2013; Kader & Akter, 2014; Mather, 2004; Nuruzzaman, 2013). The supply side of the clothing industry in Bangladesh is greatly affected by the time and cost of production (Islam, Begum, & Rashed, 2012; Kaes & Azeem, 2009; Rahman, 2004; Rahman & Anwar, 2006; Rashid, 2006; Saxena & Salze-Lozac’h, 2010; Tewari, 2006). Globally recognized clothing retailers choose the suppliers who can offer products at the minimum cost and maximum speed. Previous studies have mainly shown only the stages of the supply chain, but the requirements of each stage are not specified.
The main objective of this research is to study the demand-supply chain of the Bangladeshi textile-clothing industry. The research questions to be addressed are as follows:
What is the demand-supply structure of the textile-clothing industry in Bangladesh? What are the backward and forward linkages to the demand-supply structure?
The rest of the paper is organized as follows. In Section 2, we discuss the current state of the clothing industry, including the industry’s contribution to the national economy, product mix, product destinations, and emerging markets for the products, etc. In section 3, we elaborate the demand side of the industry including customer analysis, demand forecasting, the design of the product, the order confirmation process, and the roles of intermediaries between the distributors and producers. In section 4, we describe the supply side of the industry. This section specifies the demand-supply flow of the raw materials and the CMT activities of the clothing firms. Finally, in section 5, we conclude the paper with a discussion of the future direction of related work.
2. Current State of the Textile-Clothing Industry of Bangladesh
The term Made in Bangladesh is a sign of pride for workers, businesses, and consumers in the textile-clothing sector (Baumann-Pauly, Labowitz, & Banerjee, 2015). Bangladesh is the second largest clothing exporter in the world (Masum & Islam, 2014). The contribution of this sector accounts for 80% of the country’s export earnings (Masum & Inaba, 2015). This sector accounts for 23% of the country’s gross domestic product (GDP). 1 The economy has grown nearly 6% per year since the mid-1990s. This growth has contributed to a young workforce. Since the arrival of the garment sector in the late 1970s, the country’s poverty rate has fallen from 70% to less than 25% in 2015. 2 There seems to be a strong positive correlation between clothing export growth and poverty reduction (Labowitz & Baumann-Pauly, 2015). All these contributions are, more or less, linked to the country’s clothing industry.
Labowitz and Baumann-Pauly (2015) stated that there are about 7,000 (3,200 direct sourcing and 3,800 indirect sourcing) factories producing clothing for more than 200 foreign brands with a sales volume of 1.57 billion units in 2014. They employ 5.1 million workers capturing a 5.1% market share 3 after China’s 38.6% (Labowitz & Baumann-Pauly, 2015). The country exported $25.5 billion worth of clothing in 2015 with a 49:51 combination of knit and woven clothing. In Bangladesh, 75% of total manufacturing employment is in the textile-clothing sector, of which 85% are women. On the other hand, 60% to 75% of the benefits of this value added amount goes to retailers and producers (Oxfam International, 2016). However, the value addition in the country is steadily increasing in this industry (Quasem, 2002).
The production processes of textile-clothing firms in Bangladesh mainly fall into three types: i) vertically integrated, i.e., they buy fiber and then process the fiber into finished apparel; ii) semi-vertically integrated, i.e., they buy yarn and then convert the yarn into finished clothing; and iii) horizontally integrated, i.e., they buy fabric and then convert fabric into finished clothing. Textile clothing is an export-oriented industry. The output includes knit clothing and non-knit/woven clothing, which are mainly described as HS code 61 and 62. Clothing export growth was 12.4% on average over the last 10 years, while knit and non-knit growth was 12.5% and 12.3% respectively. Table 1 shows that 2010, 2012, and 2015 were particularly shocking when it comes to export growth.
Table 1. Clothing Export Statistics of Bangladesh
2006 2007 2008 2009 2010 2011 2012 2013 2014 2015
Total Export Growth 22% 16% 16% 10% 4% 41% 6% 11% 12% 3%
Clothing Export Growth 23% 17% 16% 15% 1% 43% 7% 13% 14% 4%
Knit Export Growth 35% 19% 21% 16% 1% 46% 0% 10% 15% 3%
Non-Knit Export Growth 13% 14% 11% 15% 2% 40% 14% 15% 13% 5%
No. of Export Destinations 140 140 139 143 144 148 145 148 152 151
GDP Growth (%) 6.7 7.1 6.0 5.0 5.6 6.5 6.5 6.0 6.1 6.5
Note. Raw data from Export Promotion Bureau Bangladesh, 2015.
Clothing export growth has been supported by the European Union’s (EU) generalized system of preference (GSP) facility, a relaxation of rules of origin, and a duty free quota facility from Canada, Australia, Japan, and members of the European Free Trade Agreement. Moreover, the global financial crisis in the late 2000s eventually boosted the Bangladeshi clothing sector because buyers worldwide switched to less expensive clothing products, which is known as the Wal-Mart Effect 4 globally. The clothing export growth rate has been consistently higher than Bangladesh’s overall export growth except in 2010.
An analysis incorporating two-digit export data over the last 10 years shows that the share of knit and woven clothing export in the export basket was 39% and 39% respectively. On the other hand, the average contribution of clothing exports in Bangladesh was 82% in 2015.
3. Demand Side of the Textile-Clothing Industry of Bangladesh
The clothing product has a limited life cycle (summer products, winter products, etc.), incredible variety, volatile-unpredictable demand, and a long-inflexible supply process. The demand side activities of the textile-clothing industry include knowing the expectations of users, the trends of the age, upcoming events, and seasonal variations, etc., which are linked to demand forecasting and subsequently the ability to design the right product. These activities arise from the research and development divisions of firms. The demand side of the textile-clothing industry is shown in Figure 1 and is described in the following section.
Demand
Side 3.1 Customer analysis 3.2 Demand forecasting 3.3 Product design 3.4 Order confirmation 3.5 Bilateral relations
3.1. Customer Analysis
The Bangladeshi clothing industry’s customers are the brand retailers and distributors. Bangladesh sells knit and woven clothing to these customers as finished goods. After buying clothing products from Bangladesh, retailers sell through outlets located in different corners of the globe. Bangladeshi firms do not produce goods based on demand forecasting. They produce goods after receiving orders from retailers and distributors. Therefore, the manufacturing process is order-driven. To know the demand scenario for the textile-clothing output under prevailing circumstances, it is important to analyze the retailers and their selling destinations. An analysis of clothing importing destinations demonstrates, Table 2, that the regions currently demanding the most clothing are the European Union with 44% of clothing imports, followed by the United States with 21%, Japan with 8%, Hong Kong with 4%, and Canada with 2% (World Trade Organization, 2013). Whereas, Bangladeshi firms exports 59% of total clothing products to the European Union and 26% to the United States in the same period 5. Emerging export markets of Bangladesh, including Australia, Brazil, China, Japan, account for 15% of total exports.
Table 2. Clothing Import Markets
Destination % of total import in 2011 Destination % of total import in 2011
European Union 44% Switzerland 1%
United States 21% Korea Republic 1%
Japan 8% Australia 1%
Hong Kong 4% China 1%
Canada 2% Rest of the World 16%
Russian Federation 1%
Note. Information obtained from World Trade Organization, 2013.
An analysis of the five-year export data related to knit clothing shows that the top-ten export destinations or demanders of Bangladeshi knit clothing are Germany, the United States, the United Kingdom, France, Spain, Italy, the Netherlands, Canada, Denmark, and Belgium. Figure 2 shows that 21% of the total knit products are demanded by Germany, 12% by the United States, 11% by the United Kingdom, and 9% by France over the last five years.
Exports to established markets such as the United States and the Netherlands are steady or occasionally decline for knit products, whereas exports to newer destinations
such as Russia, Australia, China, and South Korea, etc., are soaring.
As with knit clothing, the top demanders of woven clothing are Europeans and Americans except for Japan in Asia (Figure 3). The United States buys 37%, Germany buys 14%, the United Kingdom buys 10%, and Japan buys nearly 3% of the total exports of non-knit clothing.
The Bangladeshi textile-clothing industry has grown into a 100% export-oriented industry. The government facilitates this industry through the duty-free importing of raw materials, cash incentives, duty drawbacks, back-to-back credit, and bonded warehouses, etc. A total 100% of export-oriented firms do not sell their finished products in the local market. The importing of finished clothing is used to satisfy local demand. Figure 4 demonstrates that the volume of the finished clothing import was $3.68 billion in 2014–15 with 7.85% growth during the last decade to meet the clothing demand of 160 million local people.
Hong Kong 4% China 1%
Canada 2% Rest of the
World 16% Russian Federation 1% 21% 21% 21% 21% 20% 13% 17% 22% 22% 23% 0% 5% 10% 15% 20% 25%
FY 2009‐10 FY 2010‐11 FY 2012‐13 FY 2013‐14 FY 2014‐15
% k ni t clothings e xp or t Fiscal Year GERMANY UNITED STATES UNITED KINGDOM FRANCE SPAIN ITALY NETHERLANDS CANADA DENMARK BELGIUM
Figure 2. Top ten export destinations for knit clothing. Source: The same as Table 1.
37% 14% 10% 5% 5% 4% 4% 3% 3% 3% 2% 14% 0% 10% 20% 30% 40% 7.90 9.21 10.70 12.35 12.50 17.91 19.09 21.52 24.49 25.49 1.73 1.89 1.89 2.10 1.99 2.68 3.02 3.27 3.58 3.68 ‐ 10.00 20.00 30.00
Figure in billion US dollar ($)
Finished Clothing Export Finished Clothing Import
Figure 3. Non-knit clothing destinations over the last five years. Source: The same as Table 1.
The above analysis gives an idea of the destinations of Bangladesh’s clothing outputs. The retailers and distributors have their outlets in the above-mentioned destinations. Retailers and distributors also forecast demand and buy clothing from Bangladesh.
3.2. Demand Forecasting
Demand forecasting refers to the predicting of future demand based on factors that affected demand in the past. The fashion industry relies heavily on accurate forecasting of future demand (Liu, Ren, Choi, Hui, & Ng, 2013). Rodrigues and Figueiredo (2012) stated that demand for each fashion product has a short and well-defined selling period corresponding to one selling season (20–30 weeks). Fashion trends, seasonality, the influence of exogenous factors, seasonal data, end-of-season sales, sales promotions, and the purchasing power of consumers all affect the ability to forecast demand (Nenni, Giustiniano, & Pirolo, 2013; Thomassey, 2014). Inaccurate forecasts significantly influence the performance of the supply chain in terms of increased inventory costs, back orders or loss of sales, and customer goodwill throughout the supply chain (Aksoy, Ozturk, & Sucky, 2012).
Local firms mostly get contracts from Western brand retailers based on low-cost and high lead-time considerations. Sen (2008) stated that Western retailers and buyers choose Far East contractors for high lead-time (90 days or more) contracts. Bangladesh specializes in high-volume, low-cost production of technically simple garments and utilizes the world’s largest low-cost labor pool, which allows subcontracting from lead contractors to complete orders on time at a lower price per unit than lead contractors (Padmanabhan, Baumann-Pauly, & Labowitz, 2015).
The activities of textile-clothing firms in Bangladesh do not begin with demand forecasting based on information from the point of sales or research office. Demand comes either from the brand retailers directly or the agents or franchisees. Foreign firms
37% 14% 10% 5% 5% 4% 4% 3% 3% 3% 2% 14% 0% 10% 20% 30% 7.90 9.21 10.70 12.35 12.50 17.91 19.09 21.52 24.49 25.49 1.73 1.89 1.89 2.10 1.99 2.68 3.02 3.27 3.58 3.68 ‐ 10.00 20.00 30.00
Figure in billion US dollar ($)
Finished Clothing Export Finished Clothing Import
Figure 4. Relationship between import and export of finished clothing. Source: The same as Table 1.
115 The Bangladesh Textile-Clothing Industry(Md. Masum)
represent 75% of the agents or franchisees, known as intermediaries. These intermediaries earn a commission ranging from 1% to 4% from the export proceeds upon successful negotiation and finalization of contract performance. Therefore, firms in Bangladesh are not forecast-driven, because the retailers and distributors are the ones who perform the demand forecasting and play the key role.
3.3. Design and Development
Design is the first step in developing new products in the fashion industry; this is followed by modeling/prototyping, detailed engineering, material sourcing, production, and distribution (Bandinelli, Rinaldi, Rossi, & Terzi, 2013). Clothing firms in Bangladesh do not themselves engage in design, distribution, or retailing. The first step in design is to analyze the targeted consumers/users. The design process is influenced by the works of other designers presented in collections in cities like Paris, Milan, and New York, or trade shows from earlier seasons (Sen, 2008). Design is either completed in-house or is commissioned to small design companies.
Firms in Bangladesh receive the product design at the time they sign the contract with the retailers-distributors. Retailers sell the product using their own brand name. The brand company earns the lion’s share of the profit from the total supply chain. Retailers and brand companies multiply their cost by 2 to 2.2 times as a general rule in setting prices (Sen, 2008). Brand retailers also play the role of distributor in the clothing business. 3.4. Order Confirmation
The most important part of the demand side, which prevails in the clothing industry of Bangladesh, is order confirmation. The apparel industry is identified as a buyer-driven value chain that contains three types of lead firms: retailers, marketers, and branded manufacturers (Gereffi & Memedovic, 2003). Bangladesh is the station of the order-driven manufacturers. It is the marketers and retailers that place production orders. Olhager (2012) stated that order-driven manufacturers produce goods responding to particular customer needs, while others produce standard products. Textile-clothing factory owners in Bangladesh are not involved in marketing activities. They play the role of production hubs under partial supervision of the intermediaries or direct retailers. Retailers-distributors dominate the demand side of the industry in the presence of the intermediaries. They forecast market demand and place production orders for manufacturers. Below we discuss the main tasks of the order management stage, where manufactures are involved.
Figure 5 demonstrates that before receiving the production order from the retailers, an introductory talk takes place between the retailer and the producer about the production order. If they can reach a verbal agreement in the negotiation stage, the first party (the importer) visits the production facility including the condition of the building and fire safety system. If the above-mentioned issues are in compliance, the deal goes into the design confirmation stage. At this stage, the importer hands over samples to the exporter for physical prototypes. After sample confirmation has been received from many producers, the first party makes the final per-unit pricing decision. Based on similar sample quality, the buyer confirms the order with the supplier that offers the lowest price. After confirming the price, the buyer confirms the payment methods and terms. In Bangladesh, maximum payments are done though documentary credit, which is popularly known as letter of credit (L/C). Afterward, the producers in Bangladesh use this L/C as the funding source for the production.
3.5. Bilateral Relations
Bilateral relations is another emerging factor on the demand side. Due to the failure of
trade agreements, clothing export from Bangladesh is facing non-tariff barriers. Export flows from Bangladesh have not benefitted from the preferential and free trade agreements (Ullah & Inaba, 2012). Ullah and Inaba (2012) also stated that there is bilateral distrust, political conflict, and a higher volume of illegal and informal bilateral trade. These factors have affected the demand of clothing from Bangladesh, including the recently suspended US GSP facility for clothing products from Bangladesh, which affected the demand to the United States.
4. Supply Side of the Textile-Clothing Industry of Bangladesh
Upon finalization of the production contract, the supplier prepares for the production process. This is the beginning of the supply side in the demand-supply chain. Figure 6 depicts the components of the supply side of the textile-clothing industry. The supply side
Order
Confirmation Negotiation confirmationFacility confirmationDesign
Payment methods specification
Figure 5. Components of the order confirmation stage on the demand side. Source: Interview with the practitioners
components include raw materials sourcing, clothing production, delivering the finished goods, and maintaining a good relationship with the buyer-distributors.
4.1 Raw Materials and Backward Linkage
The first stage of the supply side involves sourcing raw materials, also known as the industry’s backward linkage. The raw materials are categorized as fiber, yarn, fabric, wet processing, and accessories. Fiber producers at the top of the supply chain produce either natural or man-made materials. According to the US Department of Agriculture (USDA), Bangladesh imports 99% of its raw-cotton. A statistical sketch of demand and supply of cotton is given in Table 1A in the Appendix A.
The textile-clothing industry imports fiber (raw-cotton and staple-fiber) and yarn mostly. Figure 7 shows that, respectively, in 2014–2015, yarn imports increased 3.2 times, staple-fiber imports increased 6.9 times, and raw-cotton imports increased 3.1 times from the 2005–2006 fiscal year. Imports of raw-cotton are more or less stable, but staple-fiber imports and yarn imports are soaring in terms of the export of clothing. Bangladeshi private fabric manufacturing firms can mostly meet the industry’s knit fabric demand. The woven fabric sector, on the other hand, continues to be dependent on imports.
The output of fiber is yarn. Natural and synthetic fibers of short lengths are converted into yarn by spinners, throwsters, and texturizers (Sen, 2008). The average growth rate of
4.1 Raw mater ia ls so urcing Fiber Yarn Fabric Wet Processing Accessories 4. 2 C lo th in g prod uction Cutting Sewing Finishing Packing 4.3 D elivery & pay men t Port facility Transportation Delivery confirmation Payment confirmation 4.4 After sa
le
s
se
rv
ice
Figure 6. Supply side of the textile-clothing industry of Bangladesh.
0% 500% 1000% 1500% 2000% Finished Clothing Export Yarn Import Staplefibre Import Rawcotton Import
Figure 7. Trend of imported inputs and exported outputs of the textile-clothing industry.
raw-cotton fiber imports was 17% during the last decade, whereas the staple-fiber import growth rate was 29%. While the raw-cotton import reduced by 22%, the staple-fiber import increased by 138% (see Table A2 in the Appendix A). The yarn import growth rate was below average because local yarn production began to replace the importing of yarn. Therefore, in the raw-material import chain, staple-fiber substitutes for raw-cotton. The compound average growth rate (CAGR) was 12.8% for raw materials and 12.4% for clothing. The ratio of imported raw materials to exported finished goods was 19%.
Fabric segment of the production chain transforms yarn into fabric by weaving, knitting, or a non-weaving process in cloth mills and handlooms. In knitting, yarn is inter-looped by means of latched and spring needles. The process may generate rolls of knitted fabric that are used for particular apparel such as sweaters or hosiery. Non-woven processes involve compression and interlocking fibers by means of mechanical, thermal, chemical, or fluid methods (Sen, 2008).
Fabric may not be standard for clothing production until it is dyed and cleaned. Dyeing-printing-washing firms carry out this job through wet processing. Accessories subsector produces $28 billion equivalent accessories. A total of 100% of raw materials for plastics-based accessories and 80% of raw materials for paper-based accessories are imported (Faruque, 2014). In the textile-clothing export market, garments-accessories, and packaging (GAP) are significant, although GAP constitutes an insignificant percentage of the cost of products and occupies the most important position in terms of production economics (Khan & Molla, 2014). This subsector satisfies 90% of domestic demand. While the country has more or less achieved self-reliance in terms of its supply of accessories, progress is less noticeable in fabric manufacturing, especially when it comes to woven fabrics (Quasem, 2002).
Backward linkage. The above-mentioned supply side issues are known as the backward linkage to the clothing industry. The term backward linkage is used to indicate the interconnection of a particular sector with the upstream sectors from which it purchases inputs (Miller & Blair, 2009). Industrial sectors depend on each other for inputs; this dependence can be called backward linkage (Hara, 2008). Backward linkage is also known as the output multiplier effect, which is also known as the sector’s pull power. (Ilhan & Yaman, 2011). The larger the backward linkage indicator, the more inputs that sector receives from other sectors. If the output multiplier is high, it means that an increase in final demand increases the total production, i.e., it activates the other sectors by receiving inputs.
Bangladesh’s input-output table for 2012 has been used for backward linkage analysis. The production process of the textile-clothing industry is subdivided into fiber, yarn, fabric, wet processing, and clothing in the input-output table for 2012. Fabric is described as cloth milling and handloom cloth. In the table, clothing is further subdivided into knit clothing and woven clothing.
The total backward linkage coefficient of yarn subsector is 1.46 points which includes domestic backward linkage index 1.25 keeping a import leakage of 0.21. Factual information of this industry shows that there are as many as 407 yarn manufacturing firms in Bangladesh. The domestic firms can meet up to 70% of the total demand of the fabric manufacturing firms, and the other 30% of the yarn is mainly imported from China and India (Table 1A in the Appendix A gives more details).
Handloom cloth, among the production process components, has the highest degree of total production repercussions. The backward coefficient of this subsector is 2.09, which means that if demand for one unit of handloom cloth increases in the economy, there will be 2.09 production units of handloom cloth in the industry. Out of these 2.09 units, 1.94 units will be produced domestically, and 0.14 units will be imported (leakage). Statistics of this backward linkage show that there are 787 fabric-manufacturing mills in Bangladesh. Fabric manufacturing mills may be knit-fabric-producing firms and woven-fabric-producing firms. Local suppliers meet 90% of the demand for knit fabrics and 40% of the demand for woven fabrics for export-oriented clothing firms. As per the USDA data, shown in Table 1A in the Appendix A, Bangladesh imports 38% of its fabric and, on average, domestically supplies the other 62%.
If the total production repercussion in the economy is considered, the ranking of the components of the production process is as follows: handloom cloth, woven clothing, wet processing, knit clothing, yarn making, and cloth milling with 2.09, 1.93, 1.88, 1.84, 1.46,
Table 3. Backward Linkage Indicators of the Textile-Clothing Industry and its Subsectors
Total 6 Backward
Linkage Indicator Domestic
7 Backward
Linkage Indicator Leakage
Handloom Cloth 2.09 1.94 0.14 Wet Processing 1.88 1.63 0.25 Woven 1.93 1.62 0.32 Knit 1.84 1.56 0.27 Yarn Industry 1.46 1.25 0.21 Cloth Milling 1.32 1.23 0.09
and 1.32 coefficients respectively. Table 3 below illustrates the total backward linkage and domestic backward linkage.
Domestically, the wet processing (dyeing-printing-finishing) subsector is strong for backward linkage with 1.63 coefficient, but leakage is very high (0.25). Bangladesh is 100% independent when it comes to this service, but 90% of service ingredients such as dyes and chemical are mainly imported. There are 236 dyeing-printing-finishing mills in Bangladesh with a service capacity of 1,700 million meters of woven fabric, 300 million kilograms of yarn, and 600 million kilograms of knit fabric.4 An index comparing the production capacity in the year 2000 and that of the year 1996 shows that the dyeing and finishing sectors almost doubled their capacity during the same period (Quasem, 2002).
Comparison of backward linkage with some Asian countries. 8 Input-output analysis
focuses on the multiplier effects that stem from the “roundaboutness” in production, meaning that sectors use each other’s outputs as inputs (Raa, 2005). The results of comparative input-output analysis of the textile-clothing sector show that China and India have strong backward linkage for the textile-clothing industry with 2.55 and 2.14 domestic indices respectively. India is major exporting country as far as textile sector is concerned and not dependent on imports (Ministry of Textiles, 2015). India is the largest exporter of yarn in the international market and has a share of 25% in world cotton yarn exports; India accounts for 12% of the world’s production of textile fibres and yarn, ranked second, after China; the country has the highest loom capacity, including handlooms, with a share of 61% in world loom 9. Whereas, China is the world’s largest manufacturer, exporter and consumer of garments having 38% stake with strong backward linkage. China fully satisfies its domestic demand for yarn, fabric, dyeing-printing-finishing and accessories. This is why, backward linkage of China and India is the strongest in the region. Bangladesh has a 1.86 index for domestic production repercussion. These figures mean that if there is one unit change in the final demand, clothing production will be changed by 2.55 times in China, 2.14 times in India, and 1.86 times in Bangladesh. Backward linkage of Bangladesh is also good because, except fiber production, Bangladeshi firms can meet up all other components in the backward structure.
Table 4 shows that the domestic backward linkage of Bangladesh for the textile-clothing industry is 37% lower than China, 15% lower than India, and 4% lower than Thailand. Sri Lanka holds the lowest backward linkage coefficient.
In Viet Nam case, the domestic backward linkage is very poor compare to exposure in the industry. Though the Vietnamese textile-clothing sector is a major exporter, it is
heavily dependent upon imported raw materials and inputs, especially from China, to meet its production requirements. Viet Nam’s cotton production satisfies 1% of the sector’s demand, and its fabric production satisfies about 12–13% percent of demand 10. As the industry is import dependent, there is a huge leakage of 2.18 points (Table 4).
An empirical study of Vietnam’s textile and clothing sector showed that in 1996 and 2000, the total backward linkage indicators were 1.799 and 2.122 respectively (Chung, 2014). In 2006–2007, the social-accounting matrix-based gross-output multiplier for readymade garments in India was 3.7, and in Bangladesh, it was 3.97 (Raihan & Khondker, 2010).
Table 4. Backward Linkage Indicators of the Clothing Sector of Some Asian Countries
Country Domestic BackwardLinkage Indicator Linkage IndicatorTotal Backward Leakage
Bangladesh 1.86 2.42 0.56 India 2.14 2.58 0.44 China 2.55 3.40 0.85 Thailand 1.93 2.72 0.79 Sri Lanka 1.16 1.69 0.53 Viet Nam 1.59 3.77 2.18
Note: Calculated from Input-output tables compiled by ADB 11
In sum, the backward linkage of India and China is much stronger than other countries in the region because the most important raw materials of textile-clothing industry is fiber, both the countries can satisfy 100% of their demand through domestic production and also exports to the global market including other Asian countries. Bangladesh, Sri Lanka and Thailand are heavily dependent on imported fiber. Whereas, Viet Nam is not only dependent on imported fiber but also dependent on imported yarn and fabric.
4.2 Clothing Production
Clothing production units carry out a number of processes from order receiving (L/C confirmation) to delivery of the finished clothing. The processes begin with the production planning. Production planning includes raw materials planning, production capacity planning, line planning, scheduling of jobs, and assigning duty-responsibility for each job, etc.
retailer-distributor. Pattern pieces are created from the designs, which are then used to cut the fabric (Sen, 2008). Fabric is developed as per the buyer’s requirements. Fabric development means sourcing or manufacturing customer-specific fabric with matching properties such as dyeing and colors, etc. In the case of yarn-dyed fabrics, the merchants develop a fabric sample with specific designs, whether stripes or checks. Other approvals related to the print, embroidery, or art work associated with the fabric are also given by the retailer. The pattern master then prepares the fit pattern, re-develops the pattern with the buyers’ comments, and finalizes the fit sample.
After reaffirming the sample design with the buyer, the factory goes into bulk cutting and ornamentation through printing or embroidery (if needed). The addition of sewing or accessories is then done to prepare the complete clothing as per the design specifications. The steps in clothing production are given in Figure 8.
Inspection is an ongoing process that begins with raw materials sourcing and continues until the final shipment. Internal and external inspections are made. Internal inspections are done by the producers. The buyer-nominated inspector performs external inspections throughout the production process. Afterward, the products are washed, ironed, and ultimately packed for delivery. Delivery is done as per the terms of the contract with the buyer, e.g., if the delivery term is FOB (free on board), the products are sent to the nominated board, whereas, if the delivery is EXW (ex-works), the product is to be made ready at the factory premises for delivery, etc.
The clothing production segment is the most labor-intensive and fragmented segment in the supply chain. Capital and knowledge requirements are not significant, making it attractive for new entries (Sen, 2008). Labor is most important for clothing manufacturing. Direct labor costs in the clothing industry in Bangladesh represents 10% of costs (Table 5), which is substandard for a labor intensive industry.
Production Planning Raw materials
sourcing Sample approval from the buyer
Cutting Sewing
Inspection Finishing
Packing Ready to Deliver
Figure 8. Sequential activities of clothing production plants. Source: Interview with the practitioners.
Table 5. Selected Clothing Production Indicators
Indicators Cost of Sales Materials Raw
Cost
Gross Value Added
Marketing
Cost Admin Cost Financial Cost Labor Cost ProfitNet
% of output value 80% 63% 37% 1% 3% 4% 10% 11%
Source: Audited Annual Reports, 2014 of 10 clothing firms.
The major cost components in the production units are cost of sales 12, cost of raw materials, and financing cost, which are 80%, 63%, and 4% of sales respectively. The average profit is 11% with 0.07 standard deviation.
4.3 Delivery and Payment
After making the product ready, the producer sends the goods to the port of shipment. This process is done by the producer through clearing and forwarding agents. These agents charge nearly 1% of the invoice value. From the producer to the buyer, it takes nearly 30– 35 days (Islam, 2013). The forward linking components under this stage include transportation, port facility, and public services, etc. The transportation system is very poor in Bangladesh. There is only one road linkage to the port city of Chittagong, and the maximum production facilities are located in Dhaka. The rail communication system is also quite poor. To deliver products to the port takes a full day. The distance is nearly 300 kilometers. Jochen Weikert, a program coordinator at German International Cooperation Bangladesh, has suggested the importance of improving the physical infrastructure for smoother communication and transportation of goods (Star Business Report, 2016).
There are two sea ports in Bangladesh. One of them, i.e., the Chittagong sea port, is effective and is used for 95% delivery of textile-clothing products. This port handles more than 80% of the country’s external trade. The business community has been very unhappy with the performance of the port. 13 Most of the bulk ships have been replaced by container ships, and around 40% of world cargo is now carried in containers. The container mother vessels do not come to Bangladesh. They anchor at sea ports in Singapore, Malaysia, or Sri Lanka. The Bangladesh-bound container cargo is at first unloaded at these ports and is later carried up to the Chittagong and Mongla sea ports by feeder vessels. Similarly, the export cargo in containers from Bangladesh follows the same route. The turnaround time for the container vessels fell to 3.04 days in Chittagong port, which is above average. 14 Future sea ports (under construction) in Payra and Sonadia will be helpful for serving the sector’s export-import activities.
through these airports. In the case of seasonal or trend emergencies, clothing manufacturers sometimes use these airports, but the usage rate is less than 1%.
Payment. In the order confirmation stage, the payment method is also specified. In the case of Bangladesh, 99% of the payment is settled through documentary credit or a letter of credit (L/C). When this happens, it is the time to claim the payment from the importer. After shipping the goods, the shipping documents and the payment-claiming document, i.e., the bill of exchange, are sent to the importer’s bank. The exporter ultimately receives the payment at this stage through the bank.
4.4 After Sales Service
After sales service and customer relationship management have become important parts of business success. Although the cycle ends when payment is received from the buyer, the producer expects further orders from the same buyer in order to begin a new cycle of production, as the industry is order-driven. To ensure the arrival of new orders, producers tend to maintain warm relationships with the retailers, including the handling of complaints from the end users. Therefore, in short, the Bangladeshi textile-clothing industry follows the cycle of three activities depicted in Figure 9.
Forward linkage. The term forward linkage indicates the interconnection of a particular sector with the downstream sectors (Miller & Blair, 2009). Another name for it is input multiplier. The input multiplier measures the effect of a monetary unit change in the primary input available to a sector on the input of all industries (Bon, 2000). Input-output analysis using input-Input-output table 2012 shows that the total forward linkage coefficient of cloth milling is highest among the textile-clothing subsectors; the yarn subsector has good forward-linkage capacity, followed by wet processing. The analysis also shows that the handloom cloth, woven cloth, and knitted cloth subsectors have similar
Figure 9. Demand-supply cycle of the Bangladeshi clothing business.
Forward linkage. The term forward linkage indicates the interconnection of a particular
sector with the downstream sectors (Miller & Blair, 2009). Another name for it is input
multiplier. The input multiplier measures the effect of a monetary unit change in the primary
input available to a sector on the input of all industries (Bon, 2000). Input-output analysis using
input-output table 2012 shows that the total forward linkage coefficient of cloth milling is
highest among the textile-clothing subsectors; the yarn subsector has good forward-linkage
capacity, followed by wet processing. The analysis also shows that the handloom cloth, woven
cloth, and knitted cloth subsectors have similar forward-linkage coefficient. Table 6 shows that
the domestic forward linkage coefficients for yarn, cloth milling, handloom, wet process, knit,
and woven are 1.24, 1.23, 1, 1.31, 1, and 1, respectively. The analysis also shows that the total
coefficients and domestic coefficients for handloom, woven, and knit clothing subsectors are
1.00 each. This indicates little to no push power for these subsectors’ outputs. The domestic
forward linkage for wet processing is 1.31, which is the highest among the subsectors, followed
by yarn and cloth milling.
Table 6.
Forward Linkage Indicators of the Textile-Clothing Industry and Its Subsectors
Demand (Order confirmation) Supply (Clothing production) Relationship (for next order)
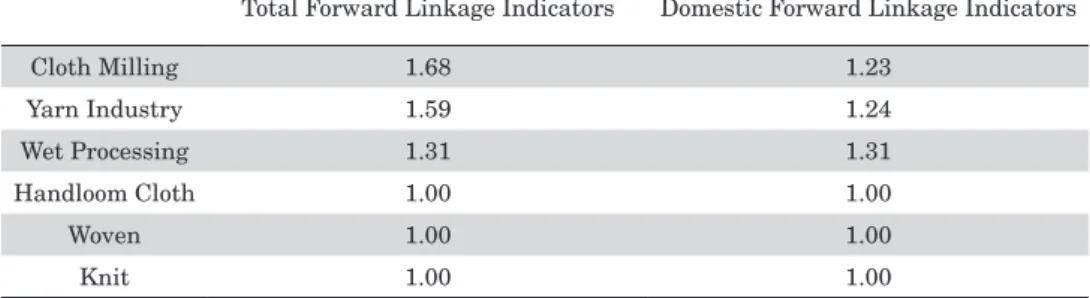
forward-linkage coefficient. Table 6 shows that the domestic forward linkage coefficients for yarn, cloth milling, handloom, wet process, knit, and woven are 1.24, 1.23, 1, 1.31, 1, and 1, respectively. The analysis also shows that the total coefficients and domestic coefficients for handloom, woven, and knit clothing subsectors are 1.00 each. This indicates little to no push power for these subsectors’ outputs. The domestic forward linkage for wet processing is 1.31, which is the highest among the subsectors, followed by yarn and cloth milling.
Table 6. Forward Linkage Indicators of the Textile-Clothing Industry and Its Subsectors
Total Forward Linkage Indicators Domestic Forward Linkage Indicators
Cloth Milling 1.68 1.23 Yarn Industry 1.59 1.24 Wet Processing 1.31 1.31 Handloom Cloth 1.00 1.00 Woven 1.00 1.00 Knit 1.00 1.00
Note. Calculated from Input-Output Table 2012, Bangladesh
Comparison of forward linkage with some Asian countries. If the forward linkages are higher than average, it implies that the relative importance of output from this industrial sector is higher (Hara, 2008). Figure 9 shows the result of a comparative input-output analysis on the forward linkage of the clothing sector of some Asian textile-clothing manufacturing countries.
When imported components are deducted and only domestic components are considered, China holds 1.77 index for forward linkage that is highest among the
1.45 1.33 1.77 1.42 1.06 1.46
1.74 1.39 2.10 1.70
1.30
2.81
Bangladesh India China Thailand Sri Lanka Viet Nam
Domestic Forward Linkage Total Forward Linkage
comparing countries. This indicates that if one unit demand increases in the economy of China, there will be 1.77 units push effect in the all industries of China. Similarly, indices for Bangladesh, India, Sri Lanka, and Viet Nam are 1.45, 1.33, 1.42, 1.06, and 1.46 respectively (figure 10). Total push power of clothing sector of Viet Nam (2.81) is the highest followed by China (2.10).
China has the highest domestic backward linkage coefficients (2.55) followed by India (2.14). While the forward linkage is calculated, it results that China again proves that it is the domestically sound nation for the textile and clothing business having 1.77 points followed by Viet Nam. Viet Nam is domestically good for input multiplier (1.46) holding 2nd position. Sri Lanka remains poor for domestic and total forward linkage.
The forward linkage of Bangladesh is 22% lower than China and almost the same as Vietnam and Sri Lanka. However, it is 13% higher than India and 27% higher than Thailand. This analysis also proves that the forward linkage activities of Bangladesh and the compared countries are almost similar, except for China. This also implies that the push power of the industry in the region is almost similar.
Empirical studies on Vietnam’s textile and clothing sector have shown that in 1996 and 2000, the total forward linkage indicators were 3.351 and 2.821, respectively (Chung, 2014).
5. Conclusion
This paper studied the demand-supply structure of the textile-clothing industry in Bangladesh with backward and forward linkages. The findings showed that the demand structure of the textile-clothing industry is order-driven, while retailers-distributors create the order for production. Bangladesh is comprised primarily of branded manufacturers, but the relationship between retailers-distributors and manufacturers in the demand-supply structure is not direct. There is an intermediary who requires 1–4% of the invoice value. Many of the intermediaries are controlled by foreign dealers. The profit calculation statistics show that retailers-distributors benefit more than manufacturers. Bangladeshi firms are dependent on retailers-distributors for demand forecasting and product design and development. Initiative at the firm and regulatory level is unsatisfactory in making the industry forecast-driven in order to reduce dependency on retailers-distributors. On the other hand, cotton, as the top-tier supply for clothing production, is import dependent. Bangladeshi firms import 99% of their raw cotton. However, local firms can meet the
maximum demand for yarn, fabric, dyeing, printing, washing, and accessories. The research also found that labor, as one of the most important components in the supply structure, is not nourished attentively, although the industry is labor intensive. Production-cost analysis in the industry showed that 80% of revenue is cost of sales, 63% of revenue is raw materials cost, and only 10% of revenue is labor cost.
Input-output analysis of the backward linkage of the industry demonstrated that fabric plays most important role among the industry’s subsectors, with 2.09 times production repercussions. A comparison of the Bangladeshi backward linkages to some Asian countries revealed that the backward linkage of China is 37% stronger than that of Bangladesh. India and Sri Lanka’s backward linkages are also stronger than that of Bangladesh. The forward linkage of the industry in Asian countries tends to be standard except for China, whose forward linkage is 1.2 times greater than Bangladesh. The policy recommendations based on the findings of this research are as follows for sustainable growth of the industry.
To shift from the existing order-driven industry to a forecast-driven industry, firms and the government should acquire knowledge about forecast demands and design new products and marketing activities. Olhager (2012) indicated that forecast-driven firms can engineer, fabricate, assemble, and deliver the product by themselves. Firms, in their current financial condition, cannot invest more to become forecast-driven individually. Some major firms could initiate this change through cooperation and active support from the government. The initiative may include demand forecasting, new product development, opening outlets in major world cities, creating one’s own brand, and advertising for the brand. At the same time, foreign direct investment in the demand side will be helpful for the industry in the long run, as knowledge and technology will be available to local entrepreneurs in future.
Forecast-driven full package production model helps to increase profitability because, at present, the retailers earn the lion’s share of the profit from the total supply chain. Brand retailers multiply their cost by 2 to 2.2 times as a general rule in setting prices (Sen, 2008). The recommended approach will increase firm independence. Olhager (2012) stated that order-driven manufacturers produce goods responding to particular customer needs, while others produce standard products. Producing standard product is a cost saving and independent approach. Order-driven manufacturing is time consuming and requires much time in order negotiation and finalization. Forecast-driven approach helps to reduce additional cost for intermediaries, an intermediary who requires 1–4% of the invoice value
now. Sometimes changes in production specifications may lead to changes in production settings, the recommended approach will save firms from such cumbersome actions. It is a good system for resolving cash-flow problem. Payment received by the manufacturers, under order-driven approach, at very late as 99% of the payment is settled through L/C. Order-driven system creates problem of cash flow during production. To ensure the arrival of new orders, producers tend to maintain warm relationships with the retailers, which involve additional cost and time.
However, the shifting process is not so easy. Firms and the government should acquire knowledge about forecast demands and design new products and marketing activities. In their current financial condition, firms cannot invest more to become forecast-driven individually. Financing research activities and developing human capital to replace foreign human resources are challenging. Moreover, there may create brand image problem, i.e. brand of a 3rd world country may not be fashionable to the 1st world country consumers.
So, forecast-driven full package production model helps to increase profitability and firm independence; reduce cost of production, seasonal unemployment, time to market, payment uncertainties, dependency on willingness of order supplier; and finally ensures balanced growth of the industry. Although it requires high investment, wrong demand forecasting may lead to negative profitability and may create image problems to fashion lovers.
Branding, which is the primal force of demand side control, adds monetary value much higher than the manufacturing value added. Branding creates white collar jobs. Ultimately it creates manufacturing identity. Examples of such strategies include South Korea, which were manufacturing country in 1960s and 1970s but now many companies of this country have their own brand. If country can create their own brand, it can outsource the manufacturing for the time being, e.g. European countries, the United States, Japan, Hong Kong, Taiwan, Korea, Singapore, etc. had their own brands and manufacturing facilities but now they manage the demand side only and outsource the manufacturing assembly. So in future, as the country (Bangladesh) develops, the industry will survive if the country starts full package production now, i.e. forecast-driven manufacturing under Bangladeshi control.
To reduce the dependency on imported raw materials, companies must develop alternative ways of using local raw materials, such as jute fiber. Babu (2010) suggested the possibility of using jute fiber for clothing production, as fabrics constructed with jute-cotton-blended yarns are best suited for clothing used for winter wear. More research is
needed in this segment. To finance research activities, the government should allocate special funds to improve the top tier of the supply structure. Firms also need to support researchers through modern lab establishment in educational institutions, permitting to use their (firms) production infrastructure or other resources to them (researchers).
For short term betterment, under the current setting, the demand-supply structure can be made favorable for Bangladesh if the role of foreign intermediaries could be minimized. To minimize the role of foreign intermediaries, it is important to develop human capital to replace foreign human resources. The government should institutionalize education and training in this field to overcome this issue.
Our study faced a lack of primary data, such as limited information on input-output tables and insufficient individual firms’ survey data. As a result, to study the textile-clothing industry of Bangladesh further, we need to investigate the demand-supply chain with primary data, input-output-based industrial analysis, subsectoral analysis, structural analysis, cost-benefit analysis of forecast-driven manufacturing, I-O analysis of Asian textile industry, and so on. As a next step, the author should develop the input-output table in Bangladesh with available data in order to complete a structural analysis of the textile industry in comparison to former textile producing nations, like South Korea, Taiwan, Hong Kong, and Singapore.
Acknowledgement
This research is supervised by Professor Kazuo Inaba, Graduate School of Economics, Ritsumeikan University. The author is indebted to Professor Inaba for active supervision on every step of the research beginning from setting objectives to drawing conclusions. The author is also grateful to the anonymous referees for their invaluable contributions. Notes
1 http://www.stern.nyu.edu/cons/groups/content/documents/webasset/con_047408.pdf accessed on 6 January 2016.
2 http://www.thedailystar.net/business/poverty-rate-will-fall-186pc-5-years-minister-157852 report on October 16, 2015.
3 Market share of Italy, Germany, Hong Kong, Vietnam are 5.1%, 4.1%, 4.2%, 4.0% respectively.
4 http://www.bkmea.com/bangladesh_knitwear.html
6 The methodological aspects is explained in the Appendix B. 7 ibid
8 As the subsectors data in the input-output table are rare among the countries, the comparison is based on compressed data on the textile-clothing industry. The data is collected from the Asian Development Bank’s compiled input-output table.
9 https://www.dnb.co.in/SMEstextile/overview.asp (accessed on 19/10/2015)
10 http://www.textileworldasia.com/Issues/2014/April-May-June/Features/Vietnam_On_The_ Move
11 Input-output tables of China 2005, Bangladesh 2006, India 2006, Sri Lanka 2006, Thailand 2007 and Viet Nam 2007. These tables are used for comparative analysis.
12 The manufacturing cost of the products which have been sold out. This is also called the cost of goods sold (COGS). It is used to calculate gross profit (difference between sales revenue and COGS).
13 http://archive.thedailystar.net/forum/2007/march/ctg.htm
14 http://archive.thedailystar.net/newDesign/news-details.php?nid=225142
References
Ahmed, N. (2004). Surviving in a quota free world: Will Bangladesh make it? Dhaka, Bangladesh: Center for Policy Dialogue. Retrieved from http://www.bdresearch.org/home/ attachments/article/702/event42271f3cab3cd.pdf
Aksoy, A., Ozturk, N., & Sucky, E. (2012). A decision support system for demand forecasting in the clothing industry. International Journal of Clothing Science and Technology, 24(4), 221–236. http://dx.doi.org/10.1108/09556221211232829
Ali, M., & Habib, M. M. (2012). Supply chain management of textile industry: A case study on Bangladesh. International Journal of Supply Chain Management, 1(2), 35–40. Retrieved from http://ojs.excelingtech.co.uk/index.php/IJSCM/article/viewFile/587/329
Asgari, B., & Hoque, M. A. (2013). A system dynamics approach to supply chain performance analysis of the ready-made-garment industry in Bangladesh. Ritsumeikan Journal of Asia Pacific Studies. 32(2013), 51–61. Retrieved from http://www.apu.ac.jp/rcaps/uploads/ fckeditor/RJAPS32-5-Asgari.pdf
Babu, B. S. (2010). Jute/cotton blends for winter wear. Retrieved from http://www. indiantextilejournal.com/articles/FAdetails.asp?id=3036
Bandinelli, R., Rinaldi, R., Rossi, M., & Terzi, S. (2013). New product development in the fashion industry: An empirical investigation of Italian firms. International Journal of
Engineering Business Management, 5(Special Issue on Innovations in Fashion Industry), 88–96. doi:10.5772/56841
Baumann-Pauly, D., Labowitz, S., & Banerjee, N. (2015). Closing governance gaps in Bangladesh’s garment industry –The power and limitations of private governance schemes. New York, NY: New York University. Retrieved from http://papers.ssrn.com/sol3/papers. cfm?abstract_id=2577535&download=yes
Berg, A., Saskia, H., Sebastian, K., & Tochtermann, T. (2011). Bangladesh’s ready-made garments landscape: The challenge of growth. McKinsey & Company. Retrieved from https://www.mckinsey.de/sites/mck_files/files/2011_McKinsey_Bangladesh.pdf
Bon, R. (2000). Economic structures and maturity: Collected papers in input-output modelling and applications. Brookfield USA: Ashgate.
Cella, G. (1984). The input-output measurement of interindustry linkages. Oxford Bulletin of Economics and Statistics, 46, 73–84.
Chenery, H., & Watanabe, T. (1958). International comparisons of the sturcture of production. Econometrica, 4, 487-521.
Chung, N. (2014). The economic impact of agricultural and clothing-textile:An input-output analysis. Advances in Management & Applied Economics, 1(2014), 27-29.
Faruque, F. I. (2014). Potentials and impediments of Bangladesh garments accessories and packaging industry. Dhaka, Bangladesh: BGAPMEA. Retrieved from http://www.bgapmea. org/index.php/home/study_report
Gereffi, G., & Memedovic, O. (2003). The global apparel value chain: What prospects for upgrading by developing countries. Vienna, Austria: United Nations Industrial Development Organization. Retrieved from https://www.unido.org/uploads/tx_templavoila/ Global_apparel_value_chain.pdf
Guo, J., & Planting, M. (2000). Using input-output analysis to measure u.s. economic structural change over a 24 year period. The 13th International Conference on Input-Output Techniques, (p. 9). Macerata, Italy.
Hara, T. (2008). Quantitative tourism industry analysis. Oxford, UK: Elsevier Inc.
Hirschman, A. O. (1958). The Strategy of Economic Development. New Haven, CT: Yale University Press.
Islam, M. S. (2013). Supply chain management on apparel order process: A case study in Bangladesh garment industry. Asian Journal of Business and Management Sciences, 2(8), 60–72.
impact on the manufacturing business: An empirical study in the RMG sector of Bangladesh. International Journal of Research in Management & Technology, 2(2), 184– 191. Retrieved from http://www.iracst.org/ijrmt/papers/Vol2no22012/10vol2no2.pdf
Jones, L. P. (1976). The measurement of Hirschmanian linkages. Quarterly Journal of Economics, 90, 323–333.
Kader, S., & Akter, M. M. K. (2014). Analysis of the factors affecting the lead time for export of readymade apparels from Bangladesh: Proposals for strategic reduction of lead time. European Scientific Journal, 10(33), 268–283.
Kaes, I., & Azeem, A. (2009). Demand forecasting and supplier selection for incoming material in RMG industry: A case study. International Journal of Business and Management, 4(5), 149–159. http://dx.doi.org/10.5539/ijbm.v4n5p149
Khan, M., & Molla, S. (2014). Garment accessories & packaging industries in Bangladesh: Growth, social compliance & environmental issues. Dhaka, Bangladesh: BGAPMEA. Labowitz, S., & Baumann-Pauly, D. (2015). Beyond the tip of the iceberg: Bangladesh’s forgotten
apparel worker. Retrieved from http://static1.squarespace.com/static/547df270e4b0ba184 dfc490e/t/5672bef1c647ad862c494795/1450360561022/Bangladesh-Report-Final.pdf Liu, N., Ren, S., Choi, T., Hui, C., & Ng, S. (2013). Sales forecasting for fashion retailing service
industry: A review. Mathematical Problems in Engineering, 2013, 1–9. http://dx.doi. org/10.1155/2013/738675
Masum, M., & Inaba, K. (2015). A comparative input-output analysis of the textile-clothing industry in Bangladesh and some Asian countries. Paper presented at 10th RICA Conference, Bangkok, Thailand.
Masum, M., & Islam, M. (2014). Analyzing job security of lower & lower middle class employees of textile sector of Bangladesh. Journal of Textile Science & Engineering, 1(1), 27–34. Mather, C. (2004). Garment industry supply chain: A resource for worker education and
solidarity. Manchester, United Kingdom: Manchester Metropolitan University. Retrieved from http://www.women-ww.org/documents/www_education_pack.pdf
Miller, R., & Blair, P. (2009). Input-output analysis: Foundations and extensions. New York, NY: Cambridge University Press.
Ministry of Textiles. (2015). Annual Report. India: Government of India.
Nenni, M. E., Giustiniano, L., & Pirolo, L. (2013). Demand forecasting in the fashion industry: A review. International Journal of Engineering Business Management. 5 (Special Issue on Innovations in Fashion Industry), 1–6. doi:10.5772/56840
Bangladesh -Analysis of supply chains. Perth, Australia: Curtin University -. Retrieved from http://espace.library.curtin.edu.au/R?func=dbin-jump-full&local_base=gen01-era02&object_id=199987
Olhager, J. (2012). The role of decoupling points in value chain management. In H. Jodlbauer ,J. Olhager, & R.J. Schonberger (Eds.), Modelling value, contributions to management science (37-47). Heidelberg,Germany: Springer. doi:10.1007/978-3-7908-2747-7_2
Oxfam International. (2016). An economy for the 1%. Oxford, UK: Oxfam GB for Oxfam International. Retrieved from https://www.oxfam.org/sites/www.oxfam.org/files/file_ attachments/bp210-economy-one-percent-tax-havens-180116-en_0.pdf
Padmanabhan, V., Baumann-Pauly, D., & Labowitz, S. (2015). The hidden price of low cost: Subcontracting in Bangladesh’s garment industry. New York, NY: New York University. Retrieved from http://papers.ssrn.com/sol3/papers.cfm?abstract_id=2659202&download =yes
Quasem, A. (2002). Adding value: Building value-addition alliances-backward linkages in the textile and clothing sector of Bangladesh. Bern, Switzerland: International Trade Center, SECO. Retrieved from http://www.intracen.org/uploadedFiles/intracen.org/Content/ Exporters/Sectoral_Information/Manufactured_Goods/Textiles/Backward%20Linkages%20 in%20the%20Textile%20and%20Clothing%20Sector%20of%20Bangladesh.pdf
Raa, T. (2005). The economics of input-output analysis. New York, NY: Cambridge University Press.
Rahman, M., & Anwar, A. (2006). Bangladesh apparel export to the US market: An examination of her competitiveness vis –a-vis China. Dhaka, Bangladesh: Center for Policy Dialogue. Retrieved from http://www.cpd.org.bd/pub_attach/op62.pdf
Rahman, S. (2004). Global shift: Bangladesh garment industry in perspective. Asian Affairs, 26 (1), 75–91.
Raihan, S., & Khondker, B. (2010). Backward and forward linkages of the textile and clothing industry in India, Bangladesh and Pakistan. Munich, Germany: Munich Personal RePEc Archive, Paper No.41231. Retrieved from mrpa.ub.uni-muenchen.de/42231
Rashid, M. A. (2006). Rise of readymade garments industry in Bangladesh: Entrepreneurial ingenuity or public policy. Dhaka, Bangladesh: World Bank and BIDS. Retrieved from https://www.researchgate.net/publication/267835662_Rise_of_readymade_garment_ industry_in_Bangladesh_Entrepreneurial_ingenuity_or_public_policy
Rasmussen, P. N. (1957). Studies in Inter-sectoral Relations. Amsterdam: North-Holland. Rodrigues, E. M., & Figueiredo, M. C. (2013). Forecasting demand in the clothing industry.
Retrieved from http://www.sgapeio.es/descargas/congresos_SGAPEIO/xisgapeio.udc.es/ resumenes/249_63_paper.pdf
Saxena, S. B., & Salze-Lozac’h, V. (2010). Competitiveness in the garment and textiles industry: Creating a supportive environment- A case study of Bangladesh. Asia Foundation. Retrieved from https://asiafoundation.org/resources/pdfs/1OccasionalPaperNo.1BGGARMENTwithC over.pdf
Sen, A. (2008). The US fashion industry: A supply chain review. International Journal of Production Economics, 114(2), 571–595. doi:10.1016/j.ijpe.2007.05.022
Star Business Report. (2016, January 31). Fast-track factory safety efforts. Retrieved from http://www.thedailystar.net/business/fast-track-factory-safety-efforts-210040
Tewari, M. (2006). Is price and cost competitiveness enough for apparel firms to gain market share in the world after quotas? A review. Global Economy Journal, 6(4), 1-46 (Article 5). doi:10.2202/1524-5861.1134
Thomassey, S. (2014). Sales forecasting in apparel and fashion industry: A review. In T. M. Choi, C.L. Hui, & Y. Yu (Eds.), Intelligent fashion forecasting systems: Models and applications (9-27). Heidelberg, Germany: Springer. doi:10.1007/978-3-642-39869-8__2
Ullah, M., & Inaba, K. (2012). Impact of RTA and PTA on Bangladesh’s export: Application of a gravity model. Journal of Industry, Competition and Trade, 12(4), 445–460. doi:10.1007/ s10842-011-0116-3.
World Trade Organization. (2013). Aid for trade and value chains in textiles and apparel. Geneva, Switzerland: World Trade Organization with OECD and IDE-JETRO. Retrieved from https://www.wto.org/english/tratop_e/devel_e/a4t_e/global_review13prog_e/textles_ and_apparel_28june.pdf
Appendix A
Table 1A
Major raw materials production, consumption and import statistics of textile-clothing industry.
Fiscal Year
2010-11 2011-12 2012-13 2013-14 2014-15
Cotton
Cotton Production (1000 bales)
80
103
129
144
120
Cotton Import (1000 bales)
3,000
3,400
5,000
5,300
5,400
Cotton Consumption (1000 bales)
3,100
3,700
4,700
5,300
5,500
Yarn
Yarn Production (1000 tons)
694
613
688
727
748
Yarn Consumption (1000 tons)
940
960
980
1,020
1,060
Import (69% from India in 2013)
273
278
280
300
307
Fabric
Fabric Production (million meters)
3,700
3,950
4,200
4,400
4,600
Fabric Consumption (million meters)
6,150
6,200
6,500
7,100
7,600
Import (64% from China in 2013)
2,400
2,400
2,600
2,800
2,900
Note. Information obtained from Cotton World Markets and Trade, USDA, December 2015